RL02: GRACE-FO quality control
Ulrich Meyer
Significance tests for annual, semi-annual and secular variations in the spherical harmonic domain
Noise assessment in the spatial domain
Noise assessment in the spherical harmonic domain
Assessment of hydrological signal content in selected river basins
Assessment of ice mass change in Greenland
Assessment of ice mass change at the west coast of Antarctica
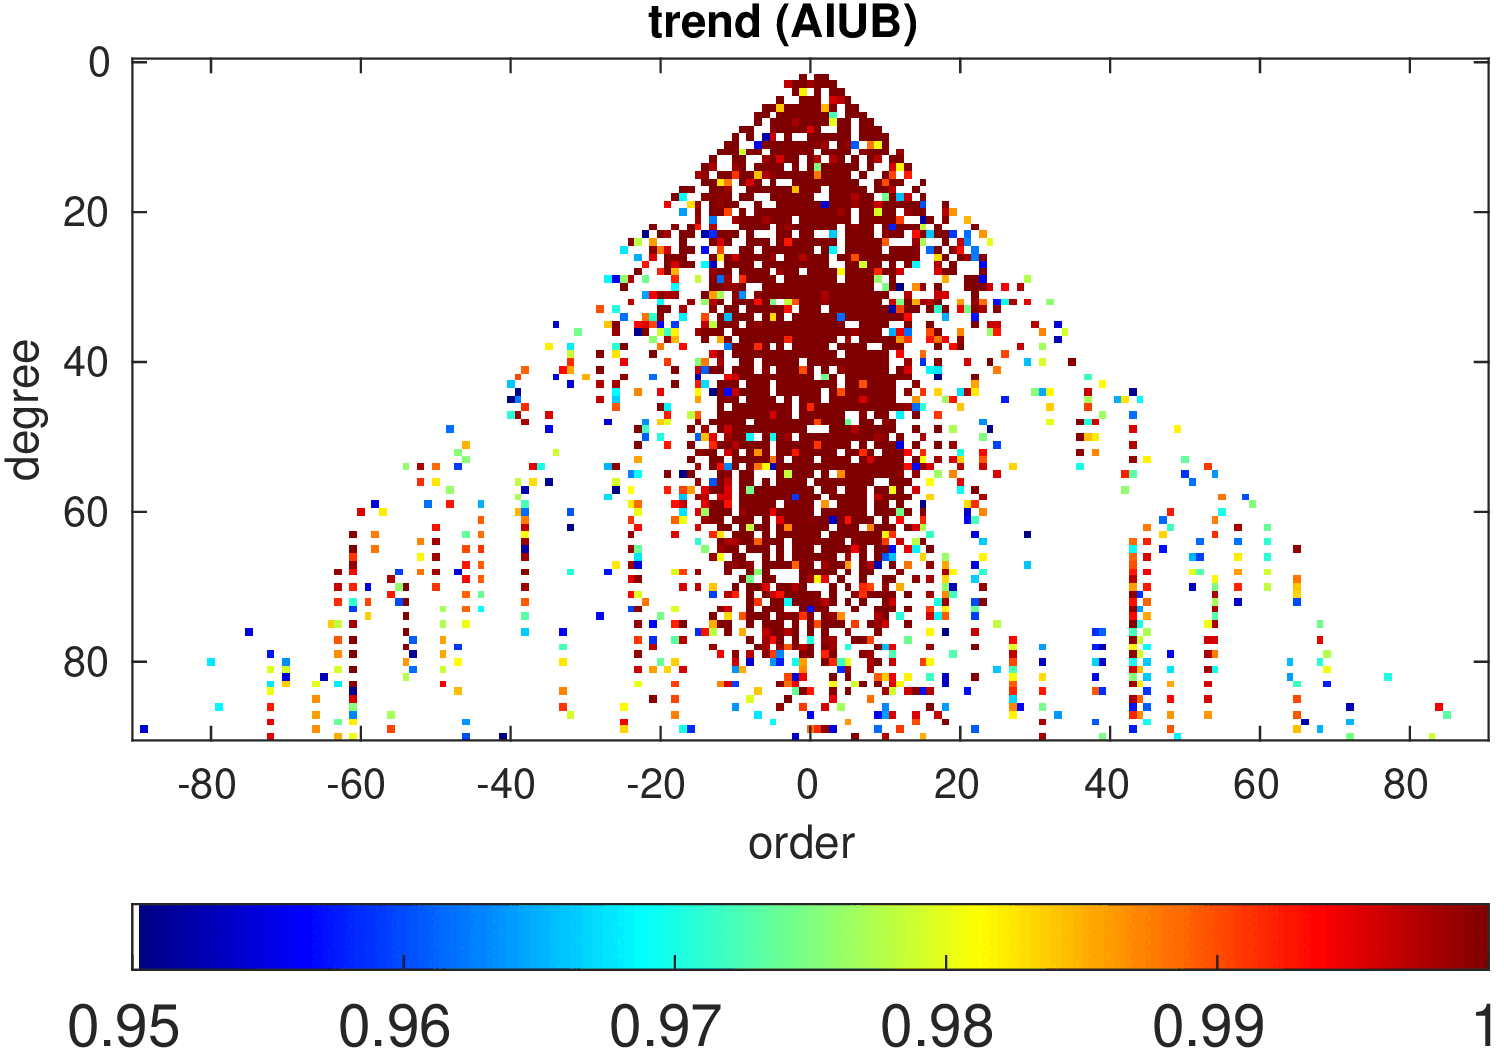
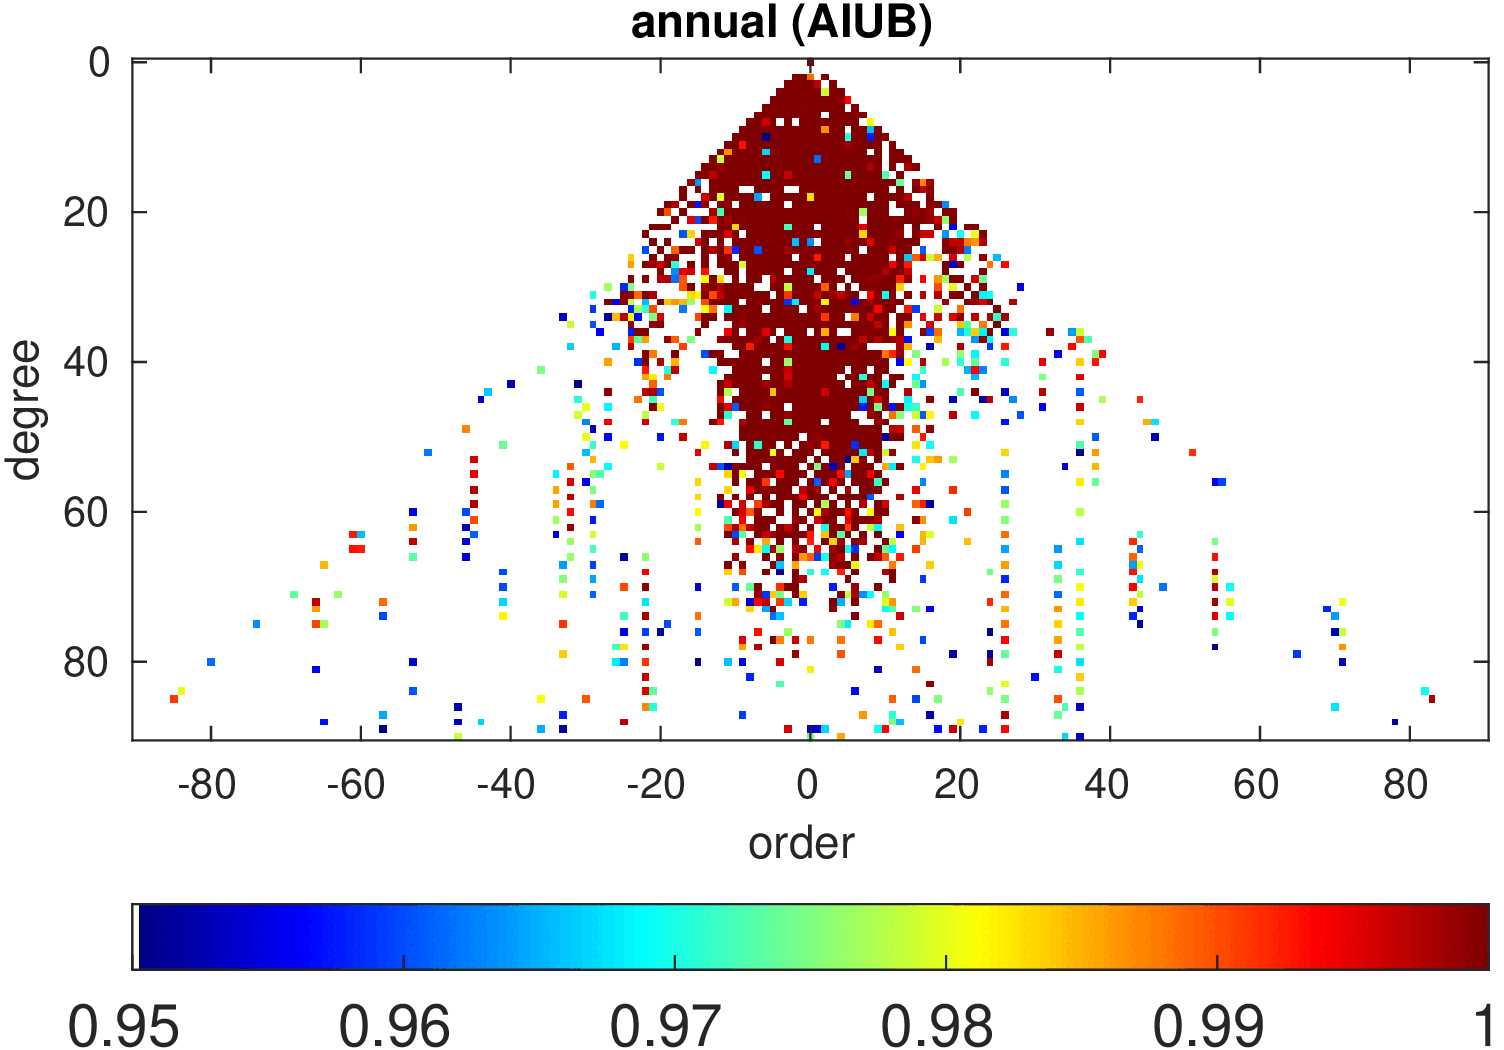
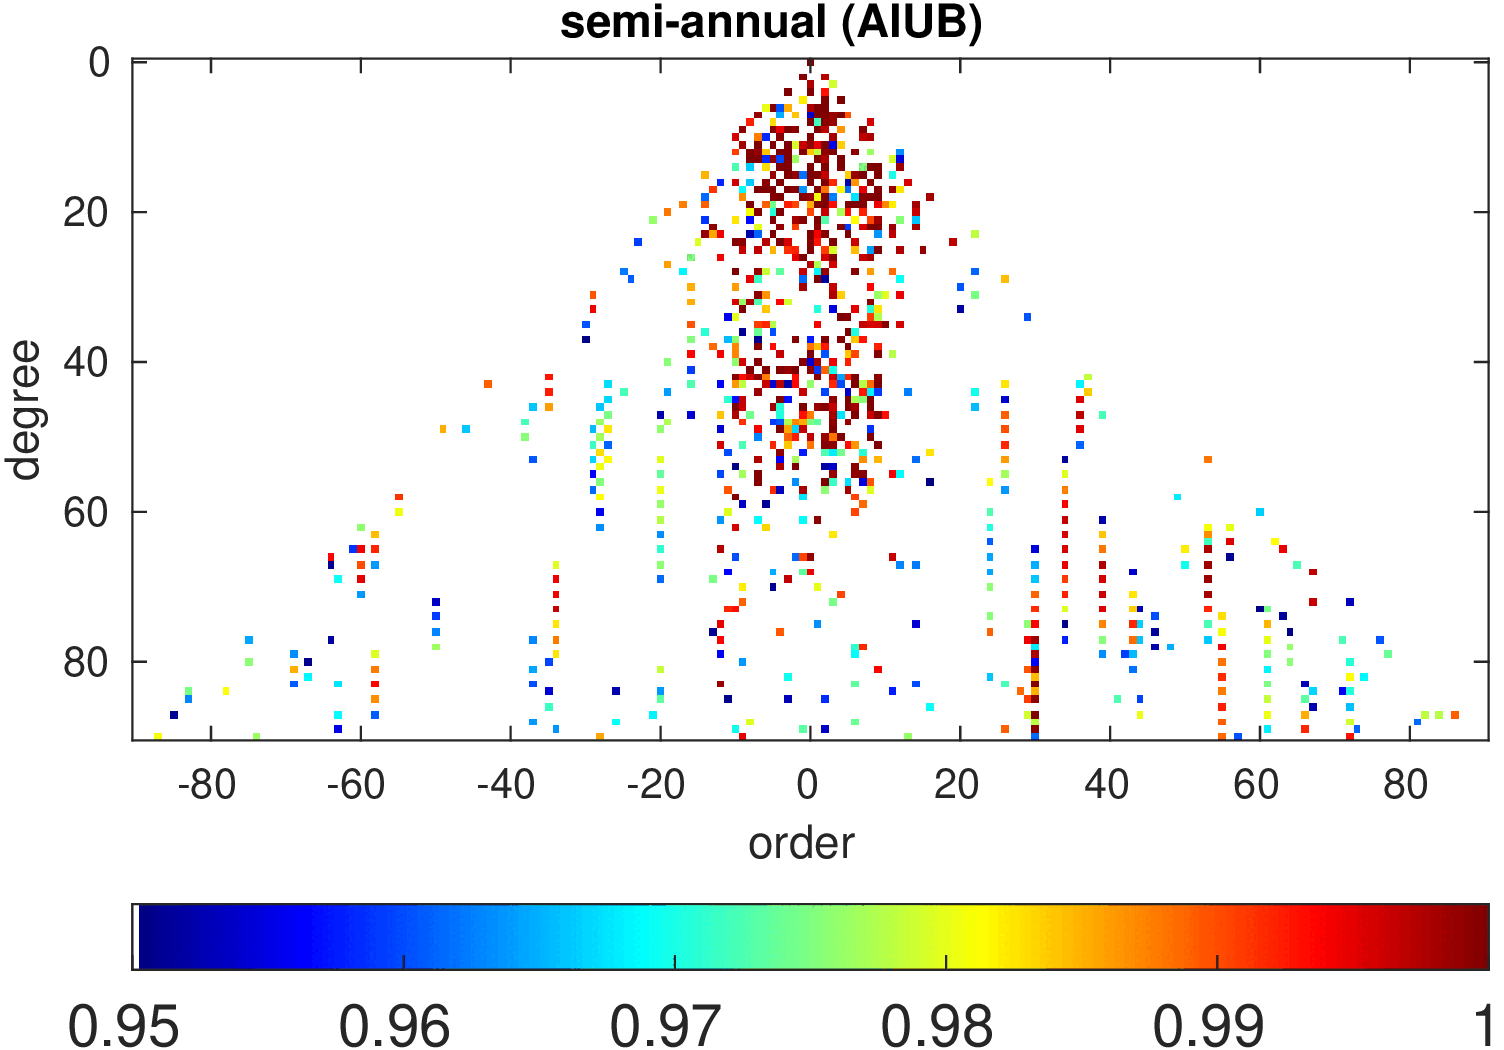
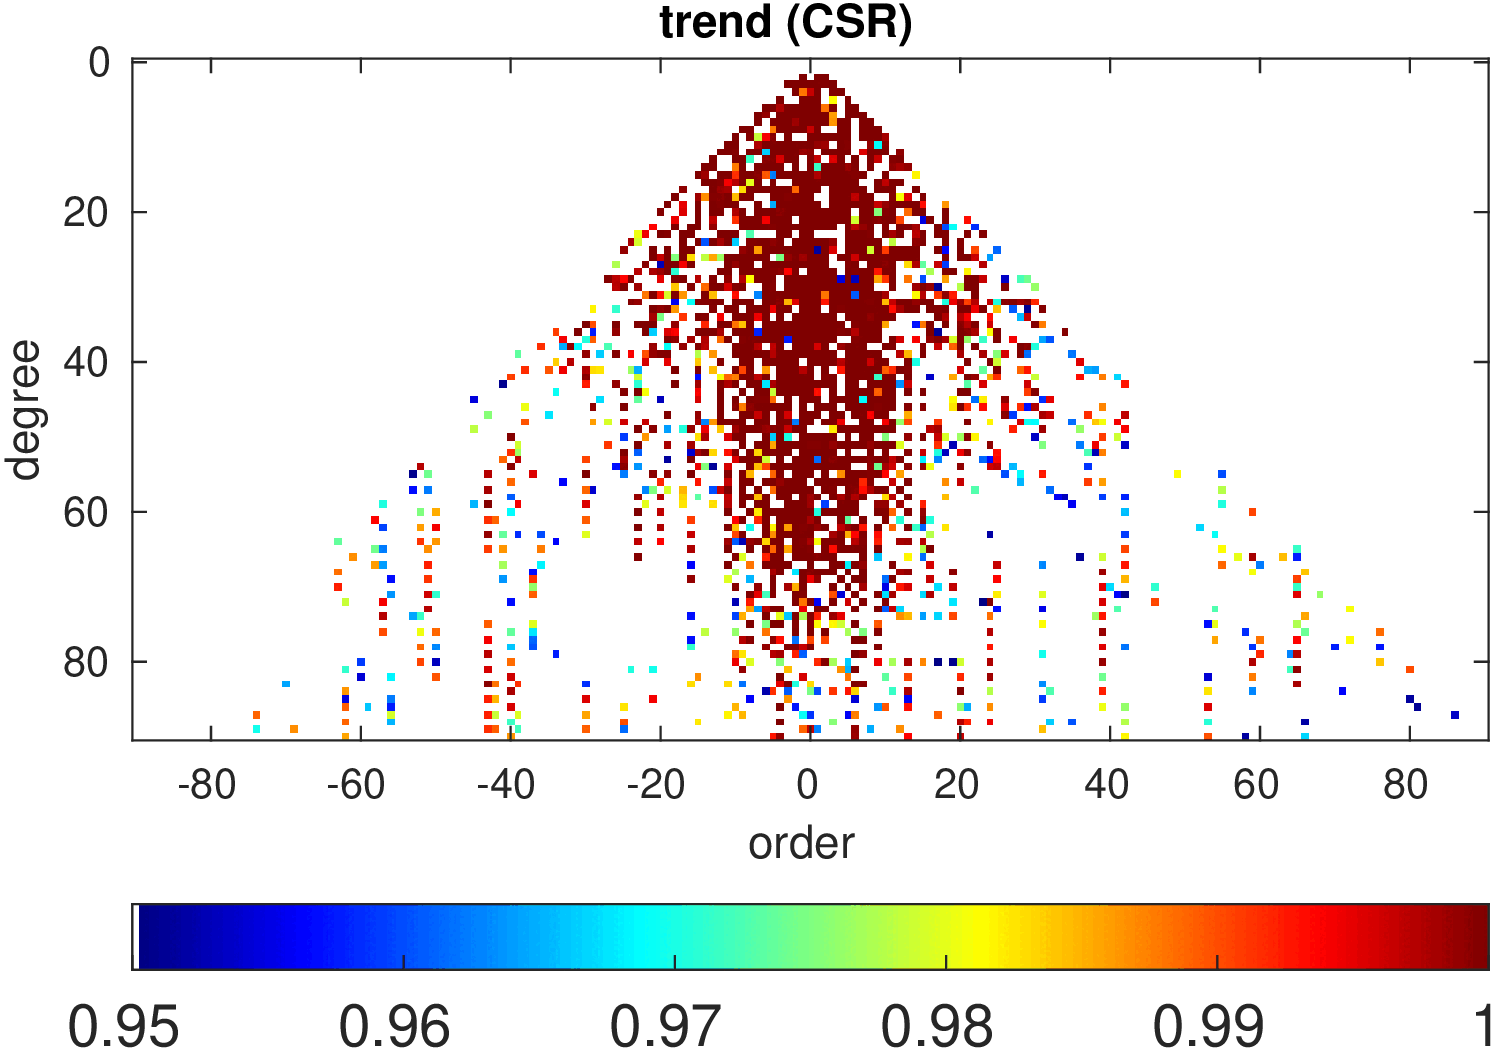
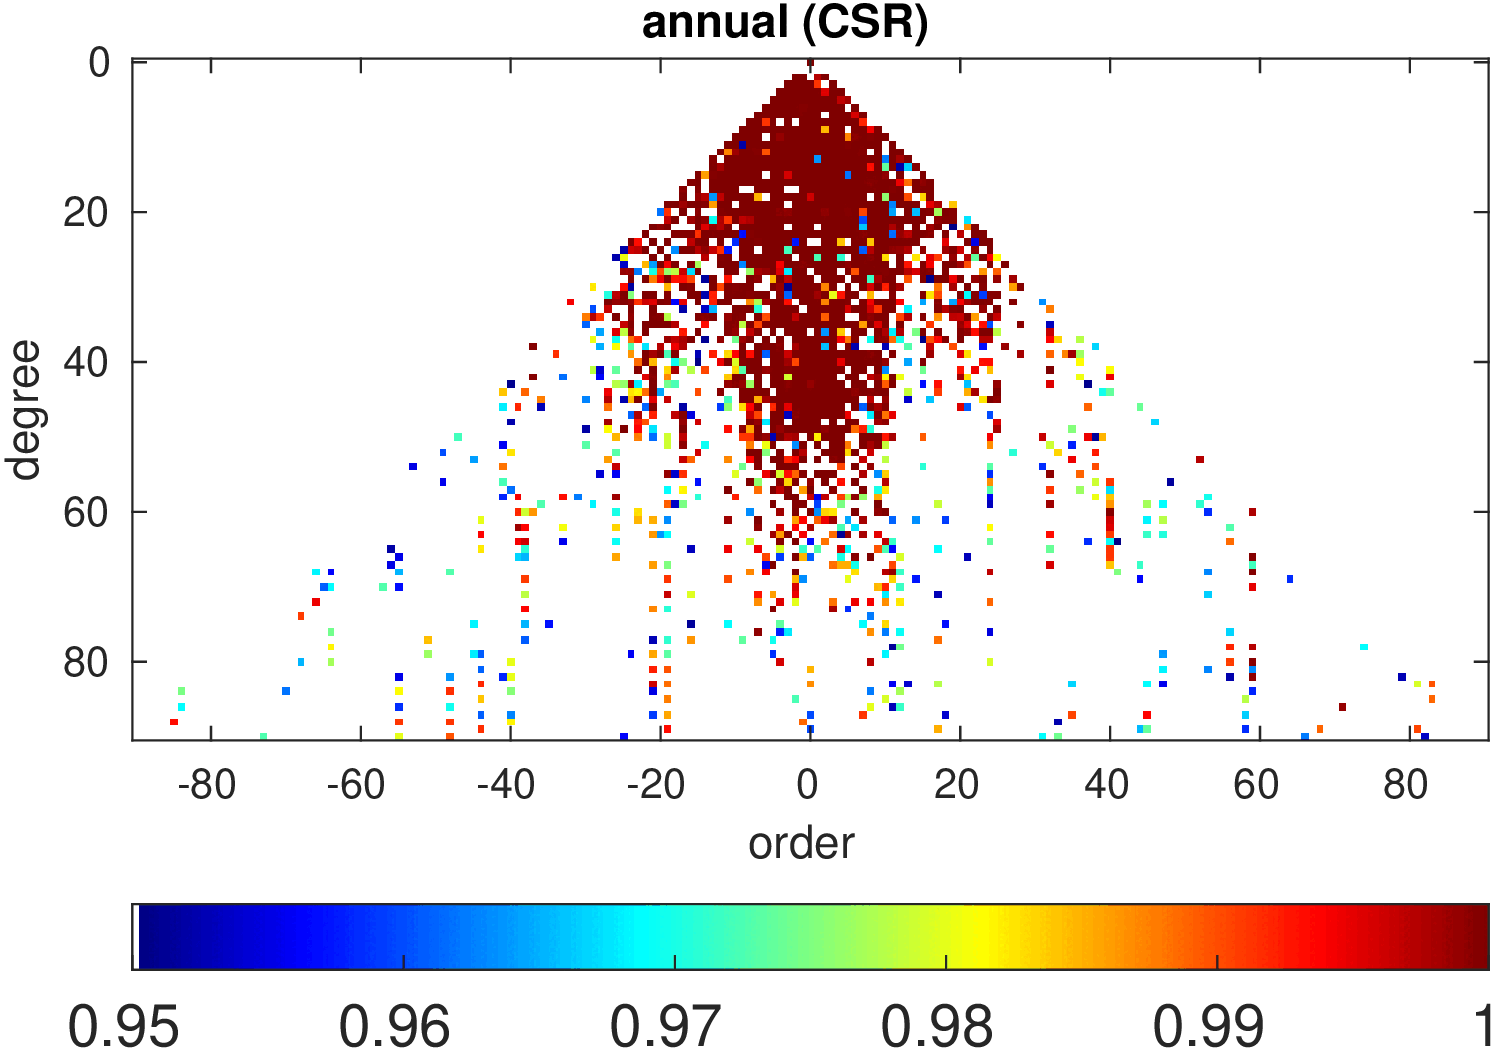
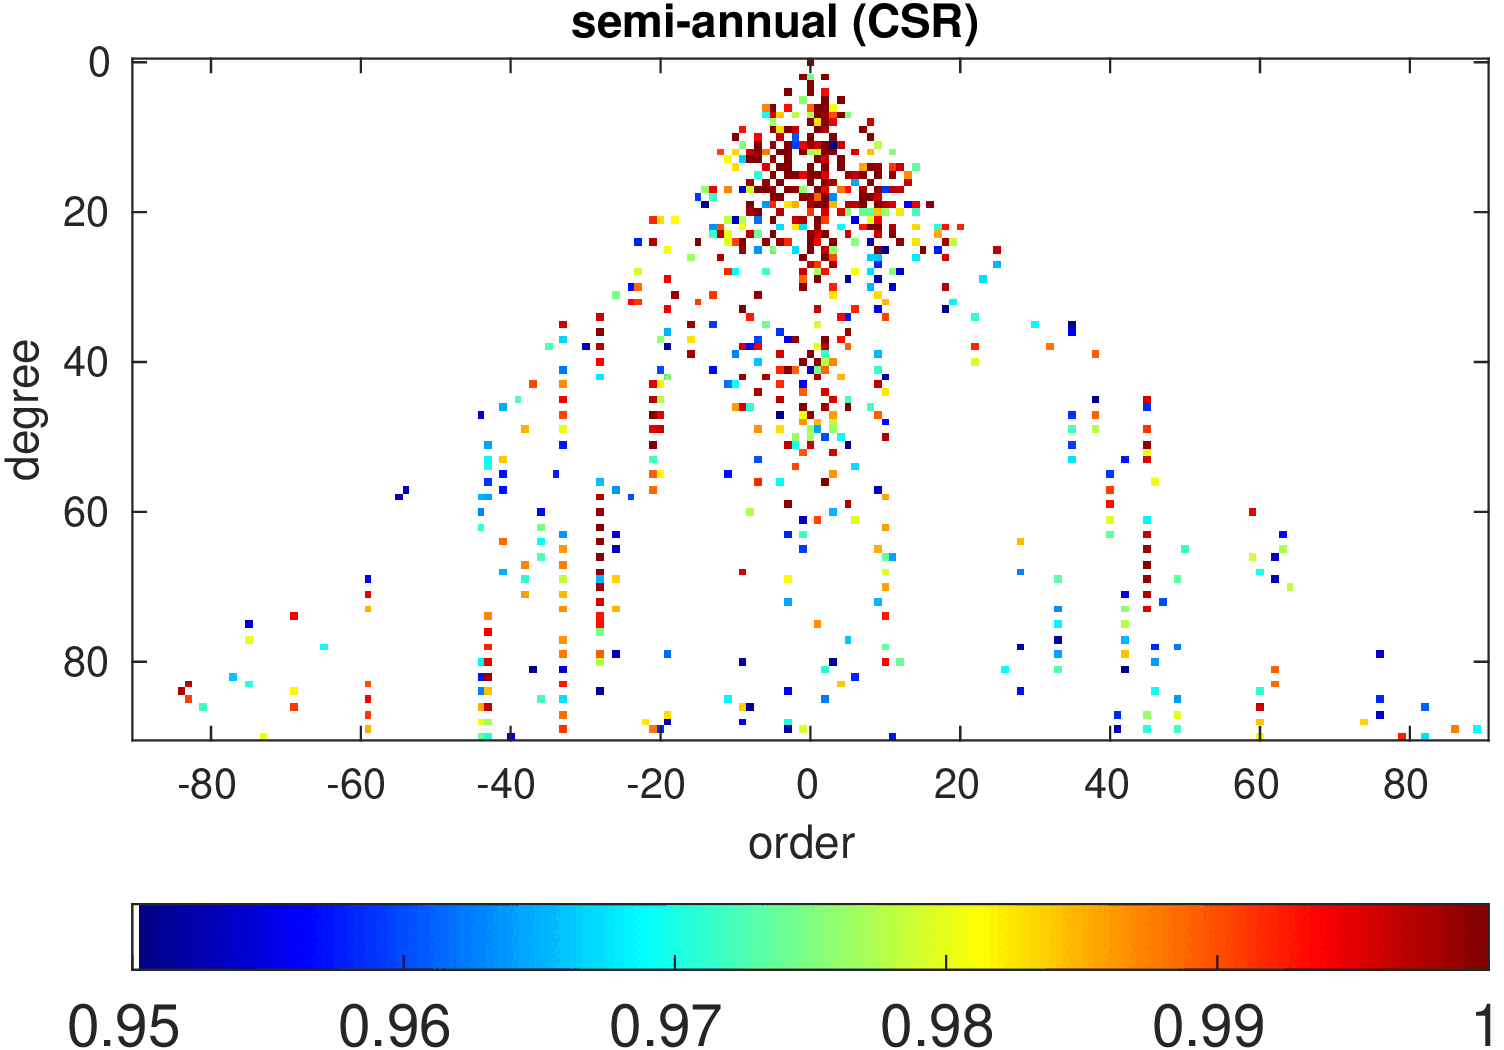
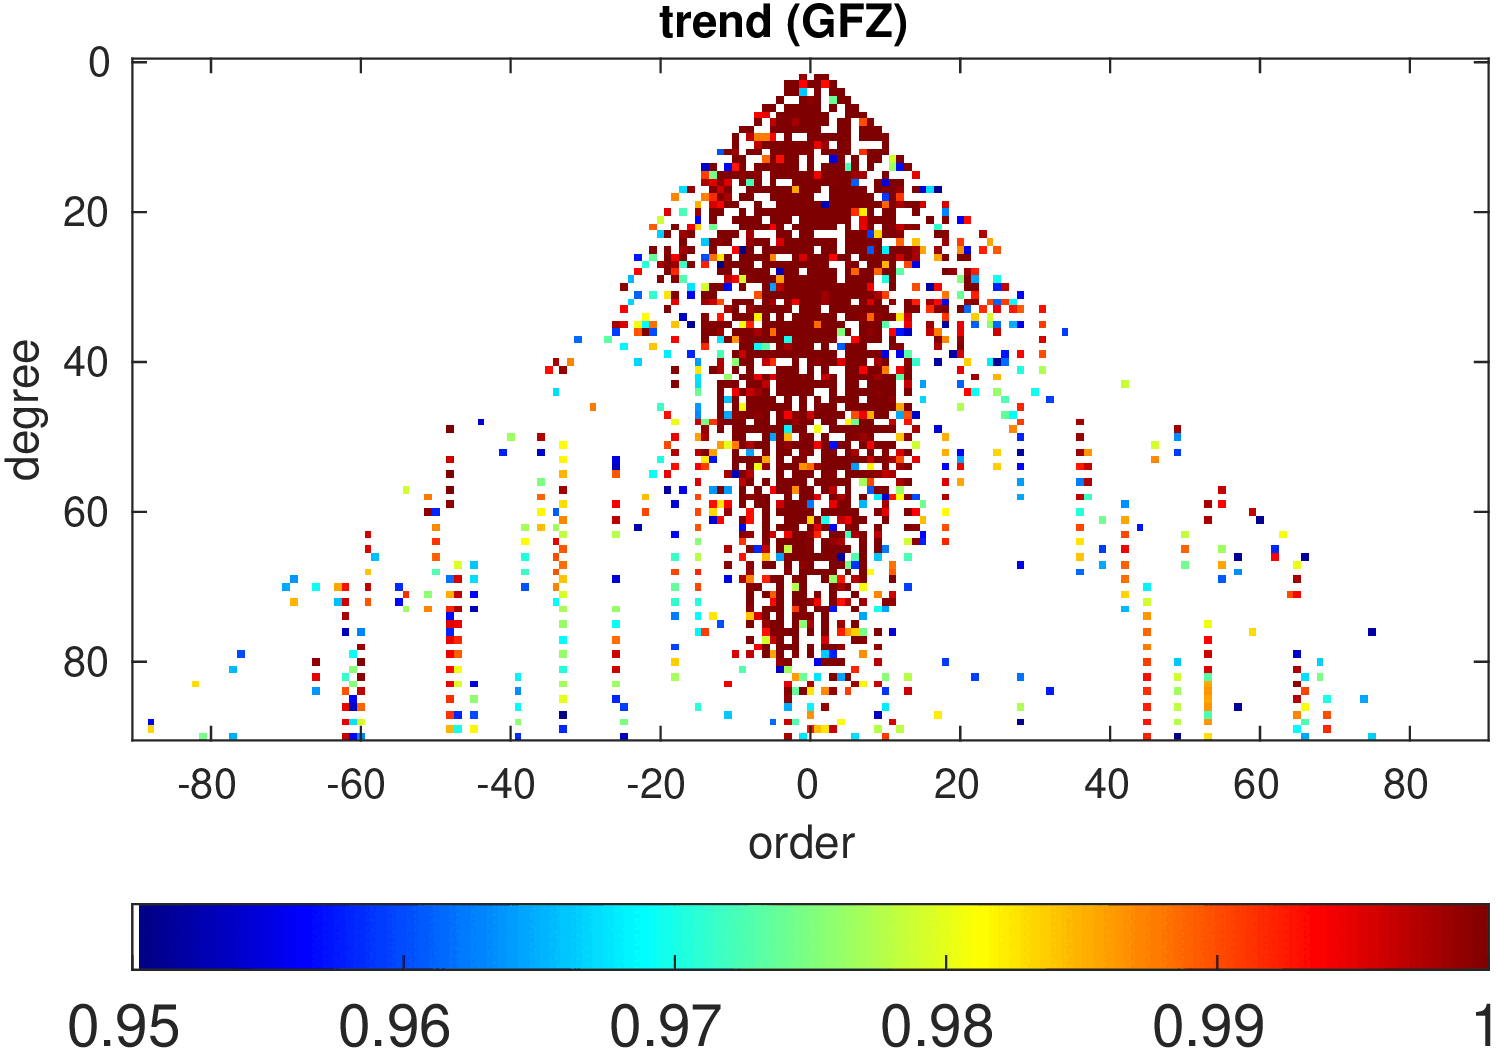
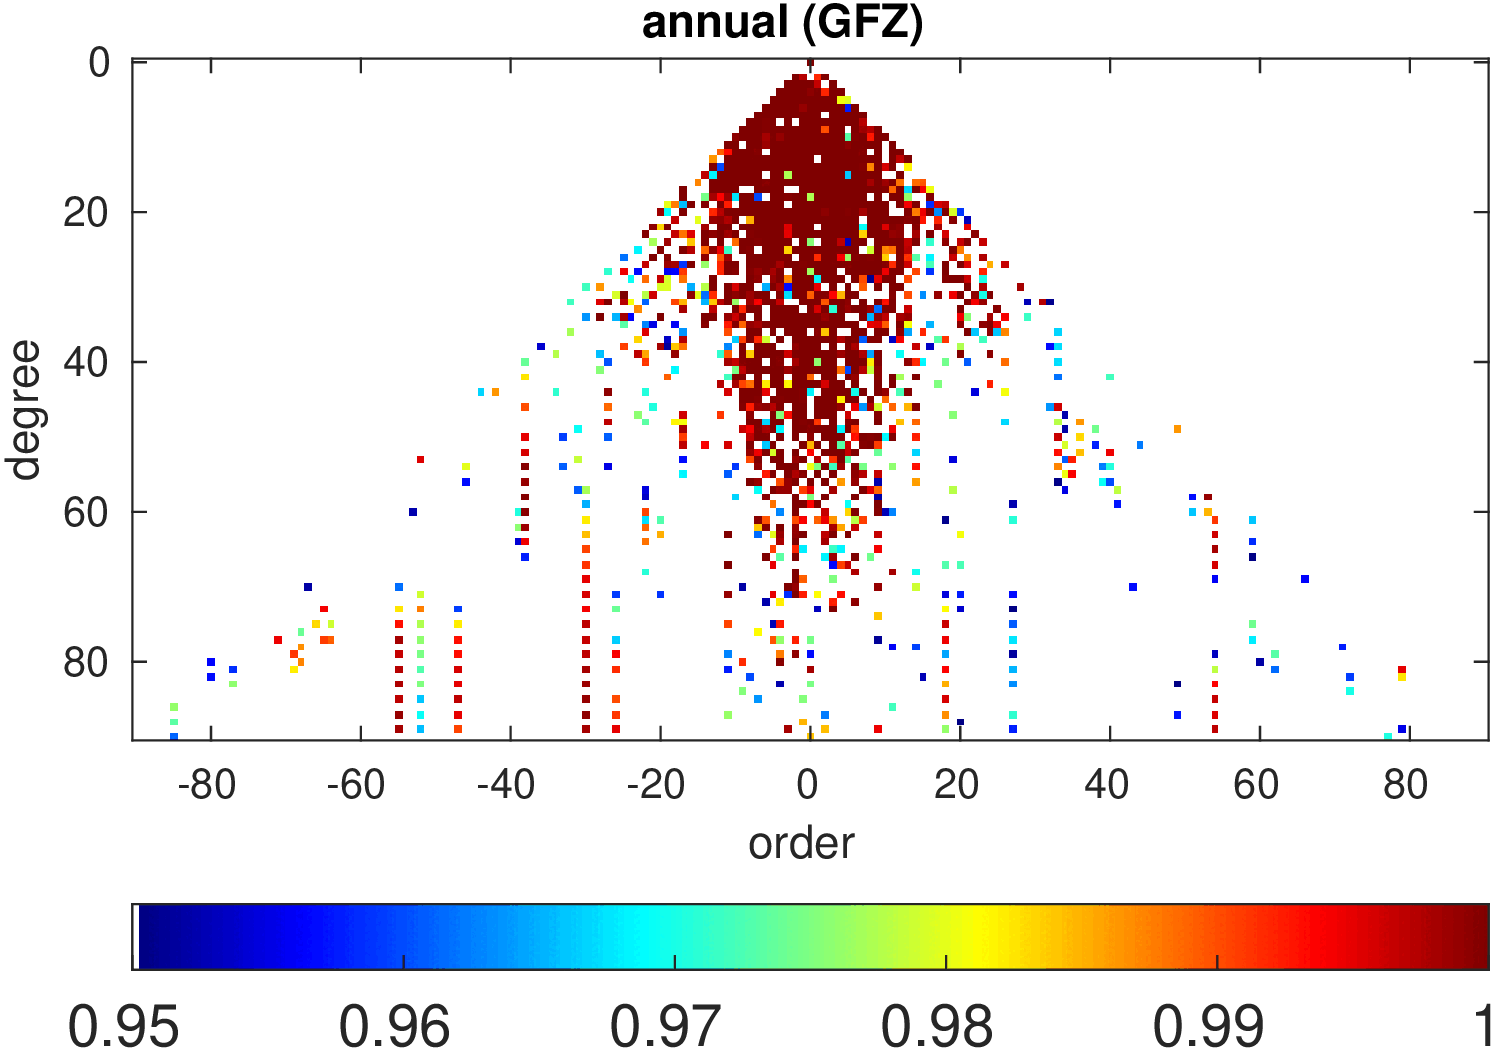
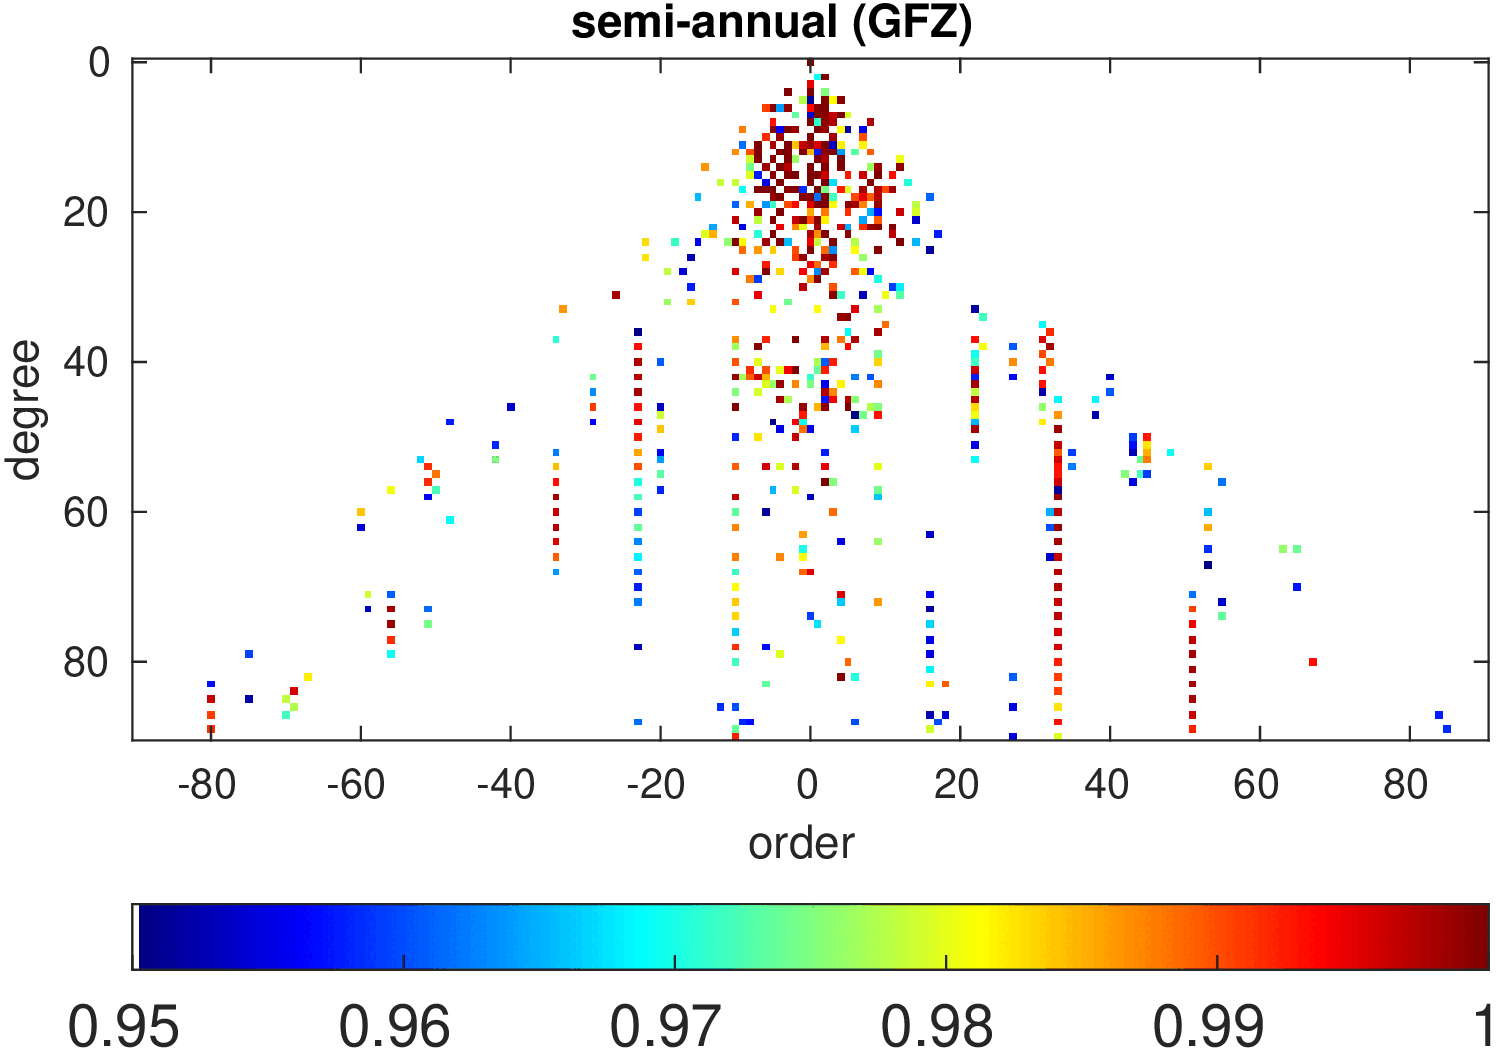
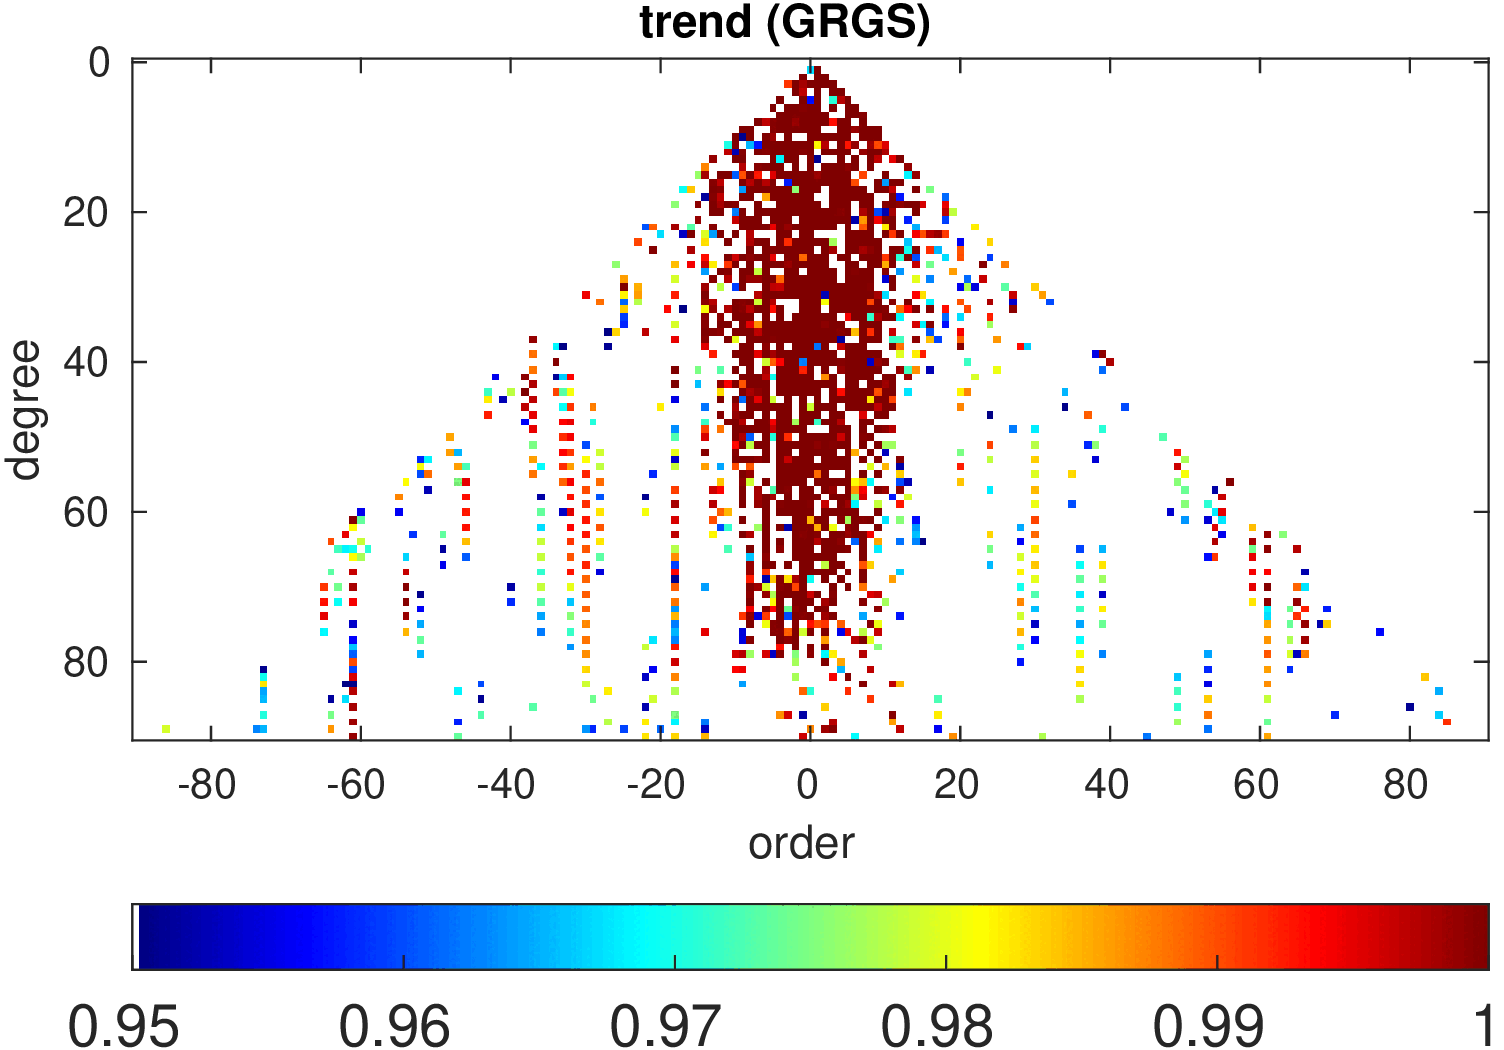
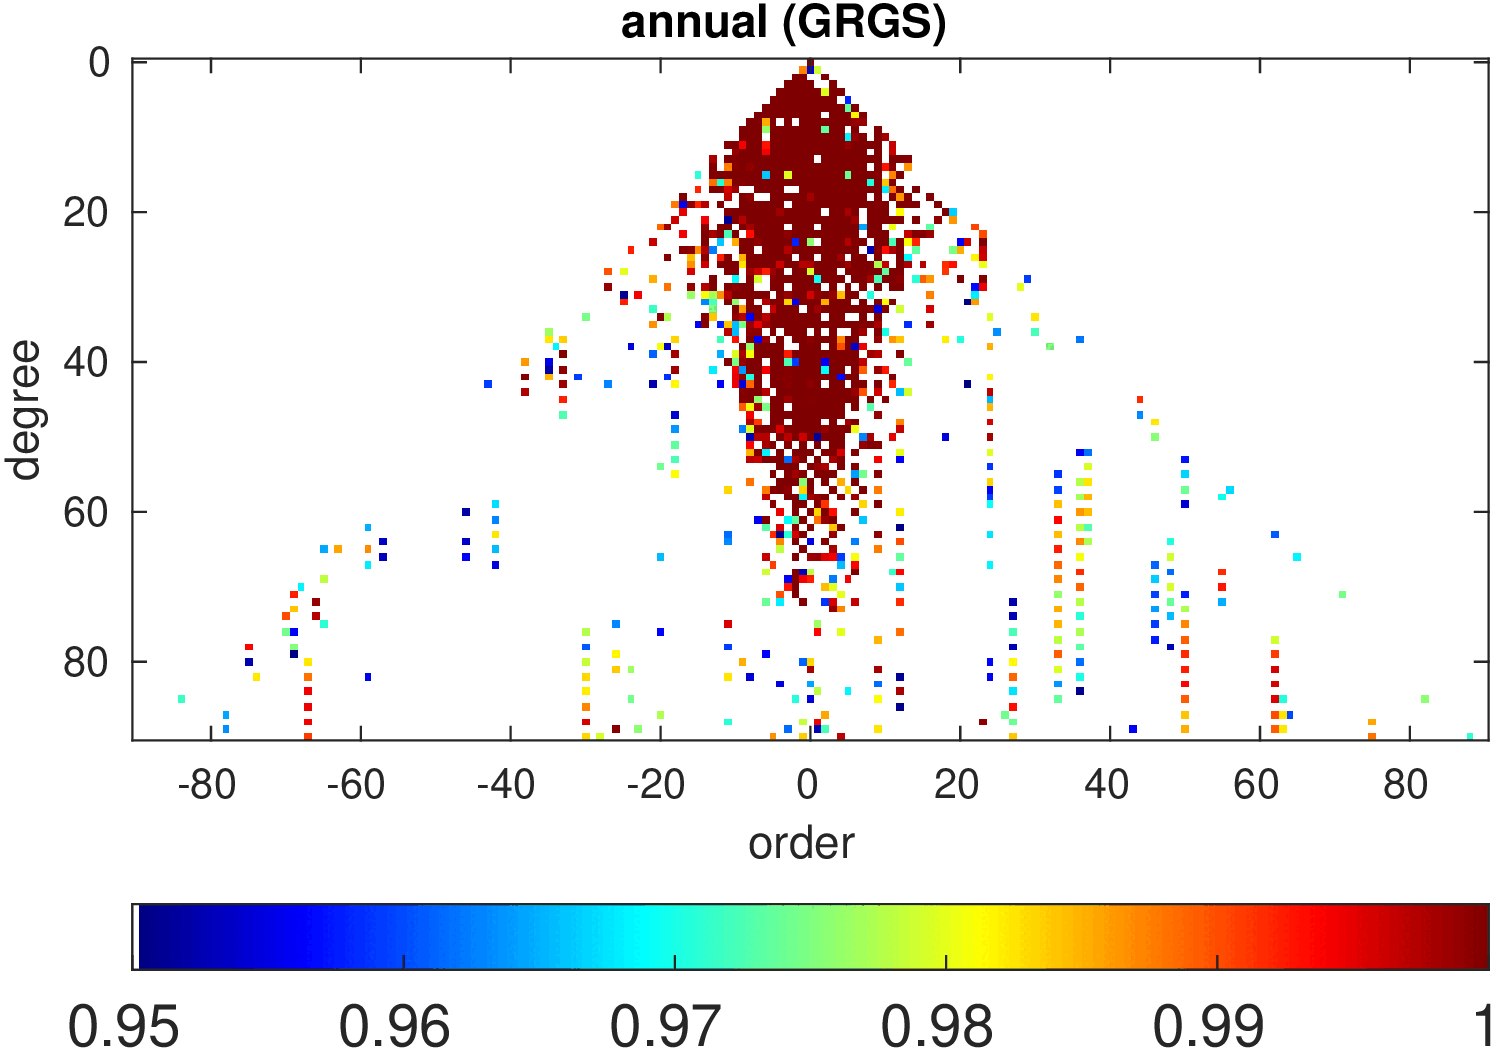
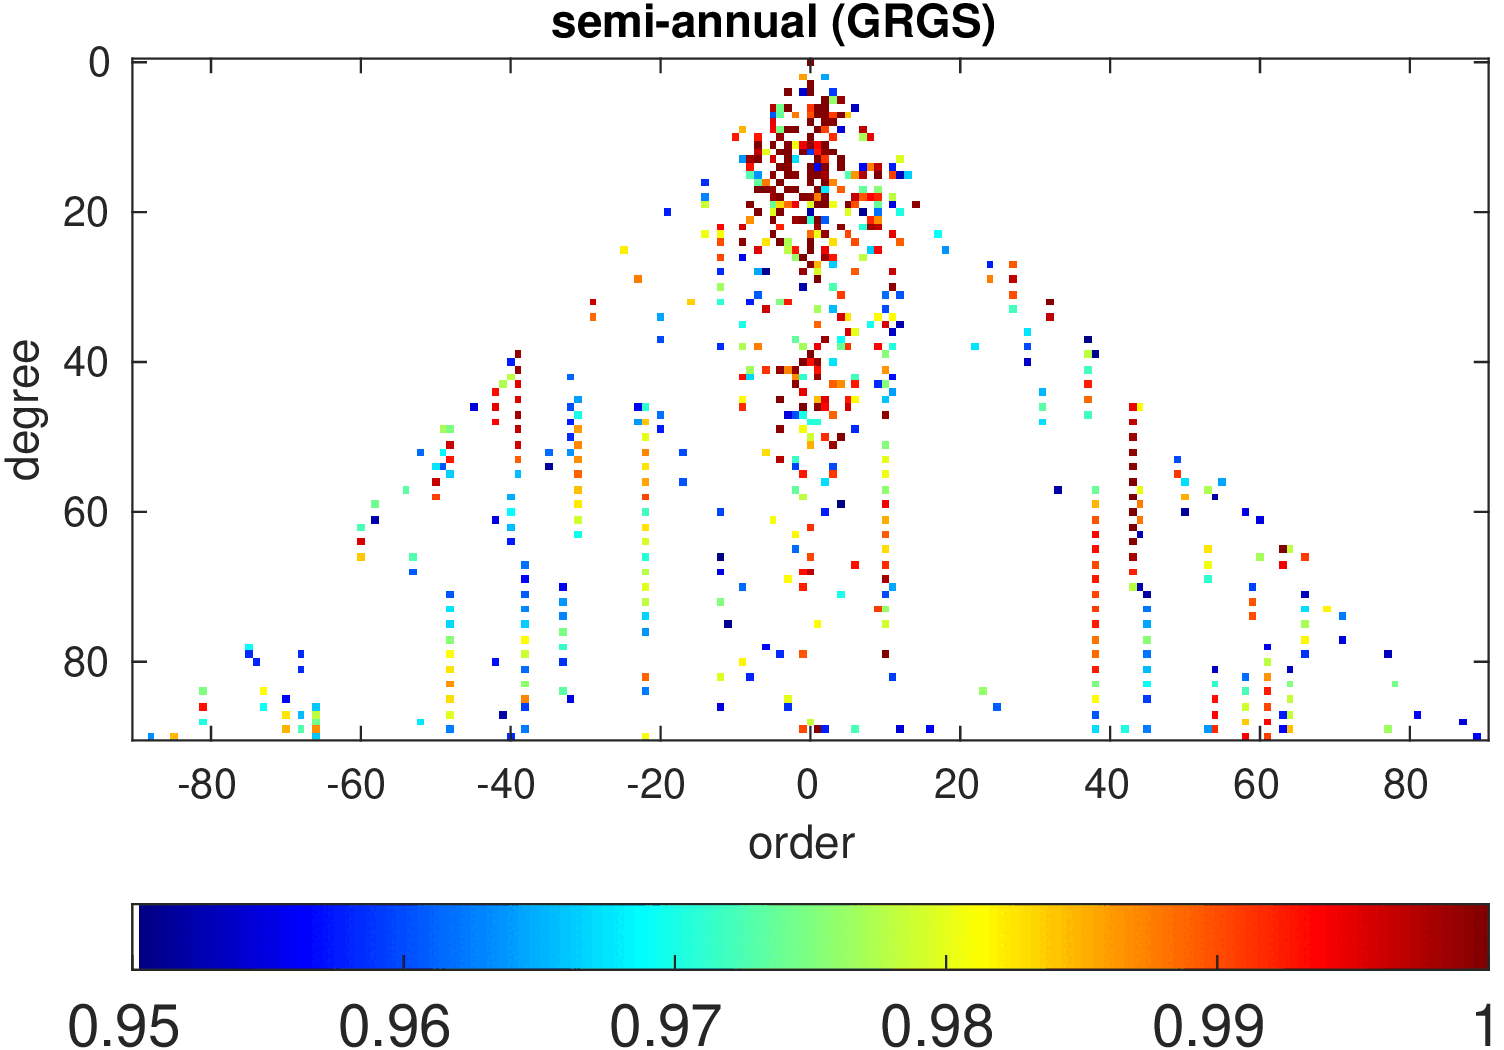
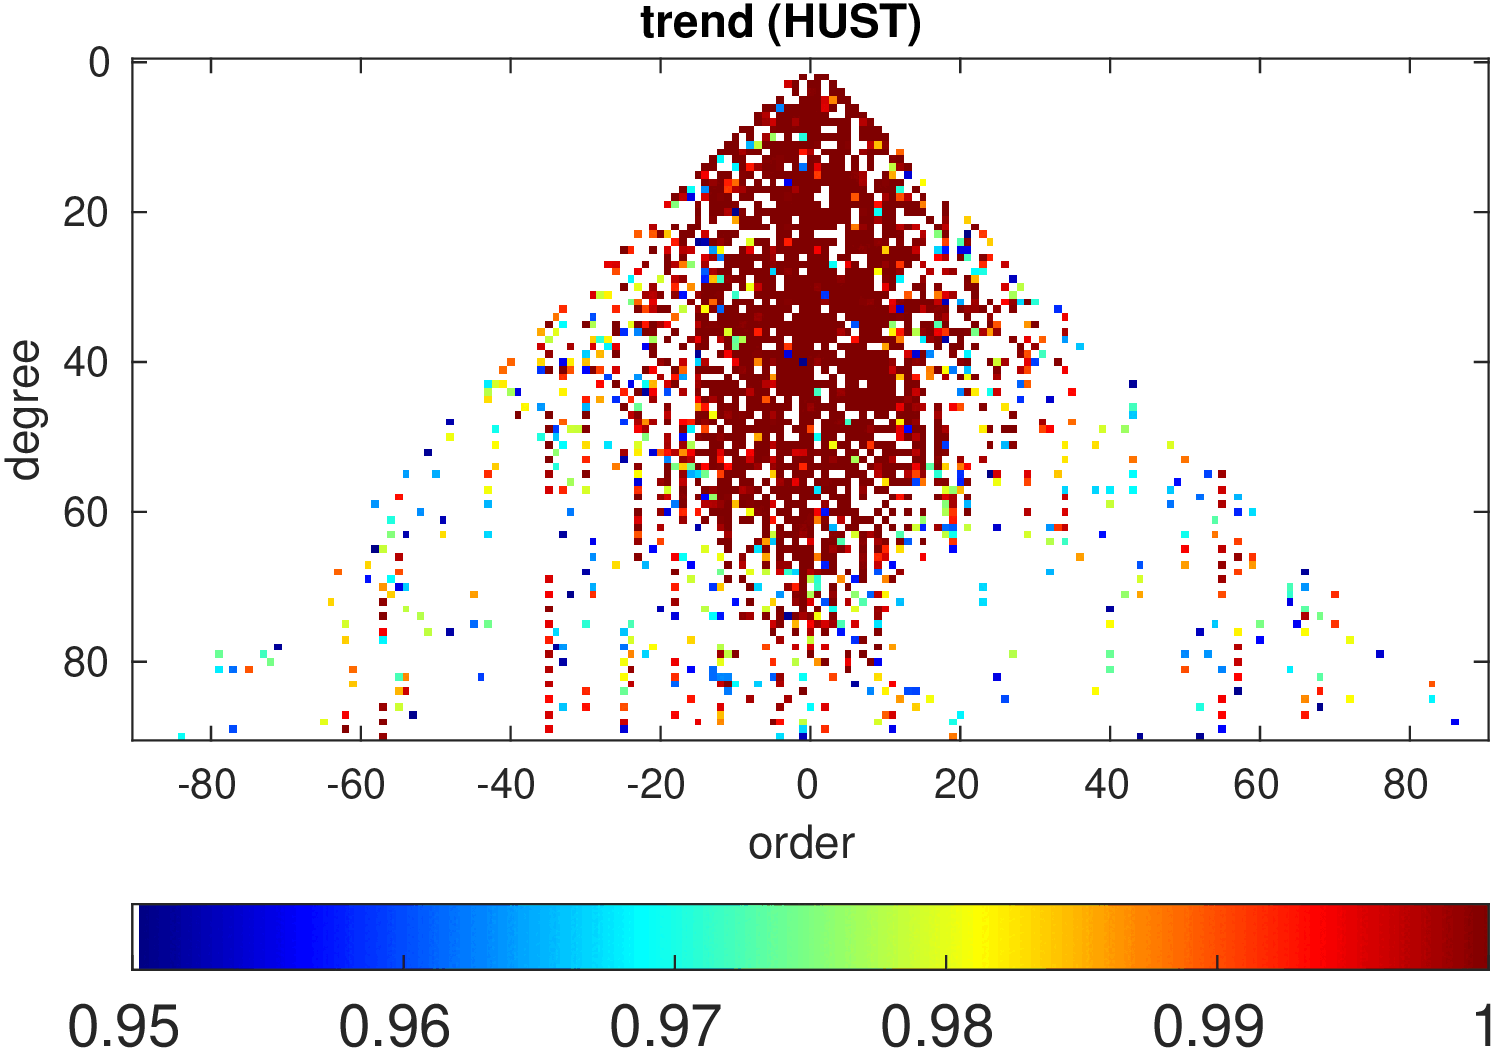
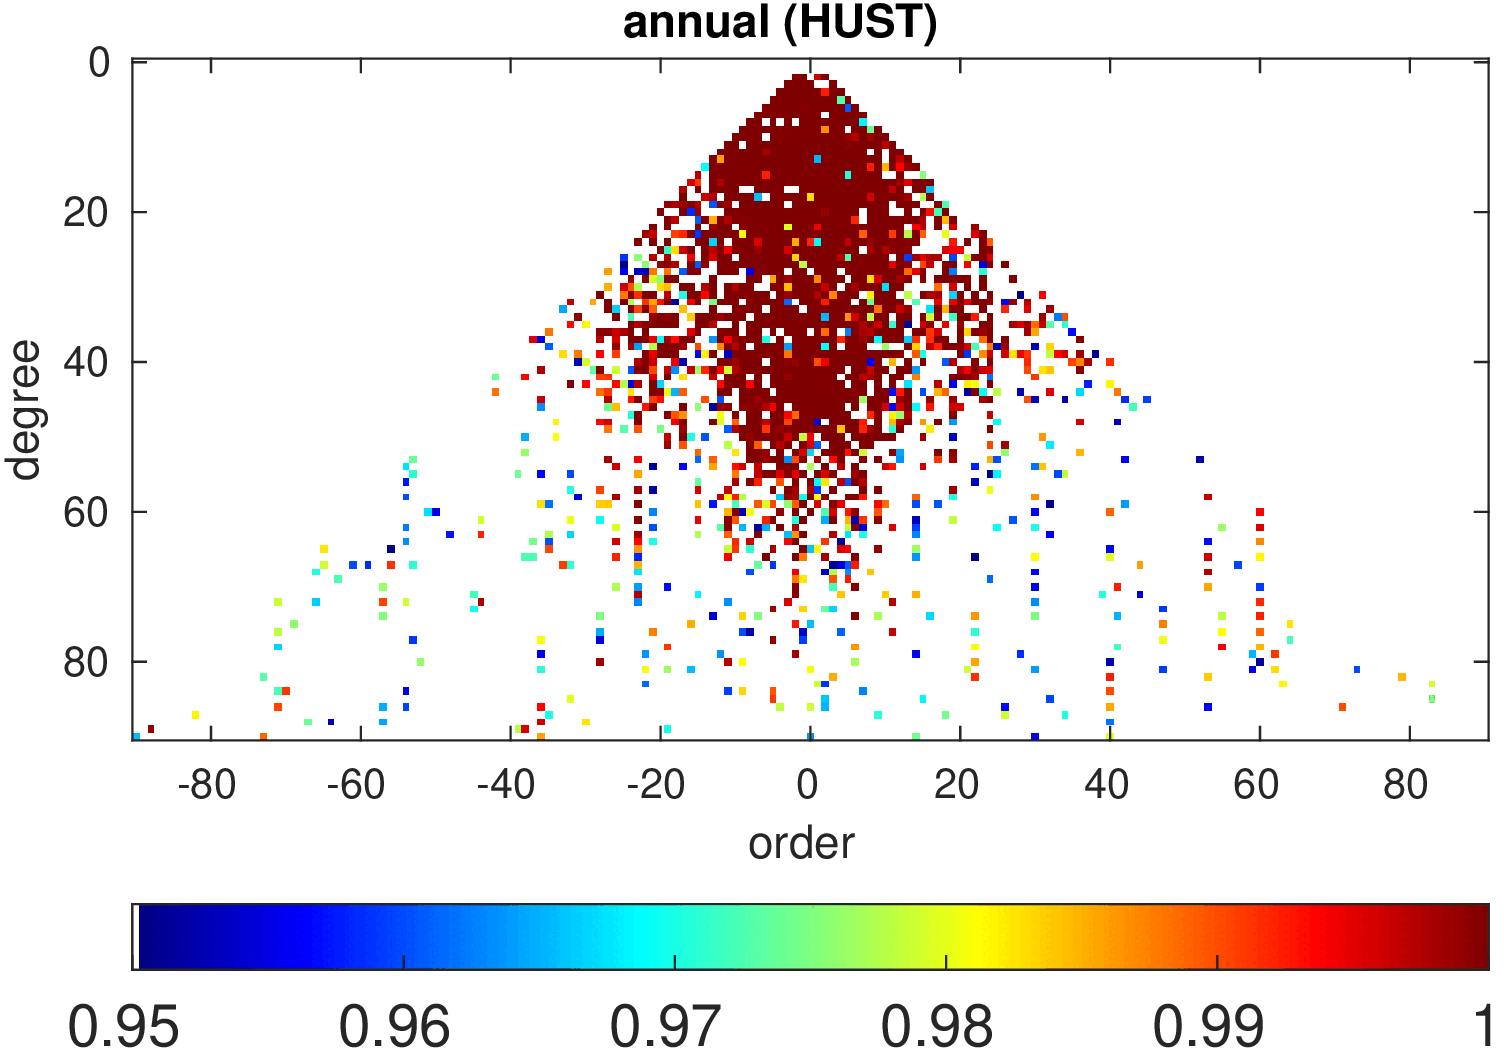
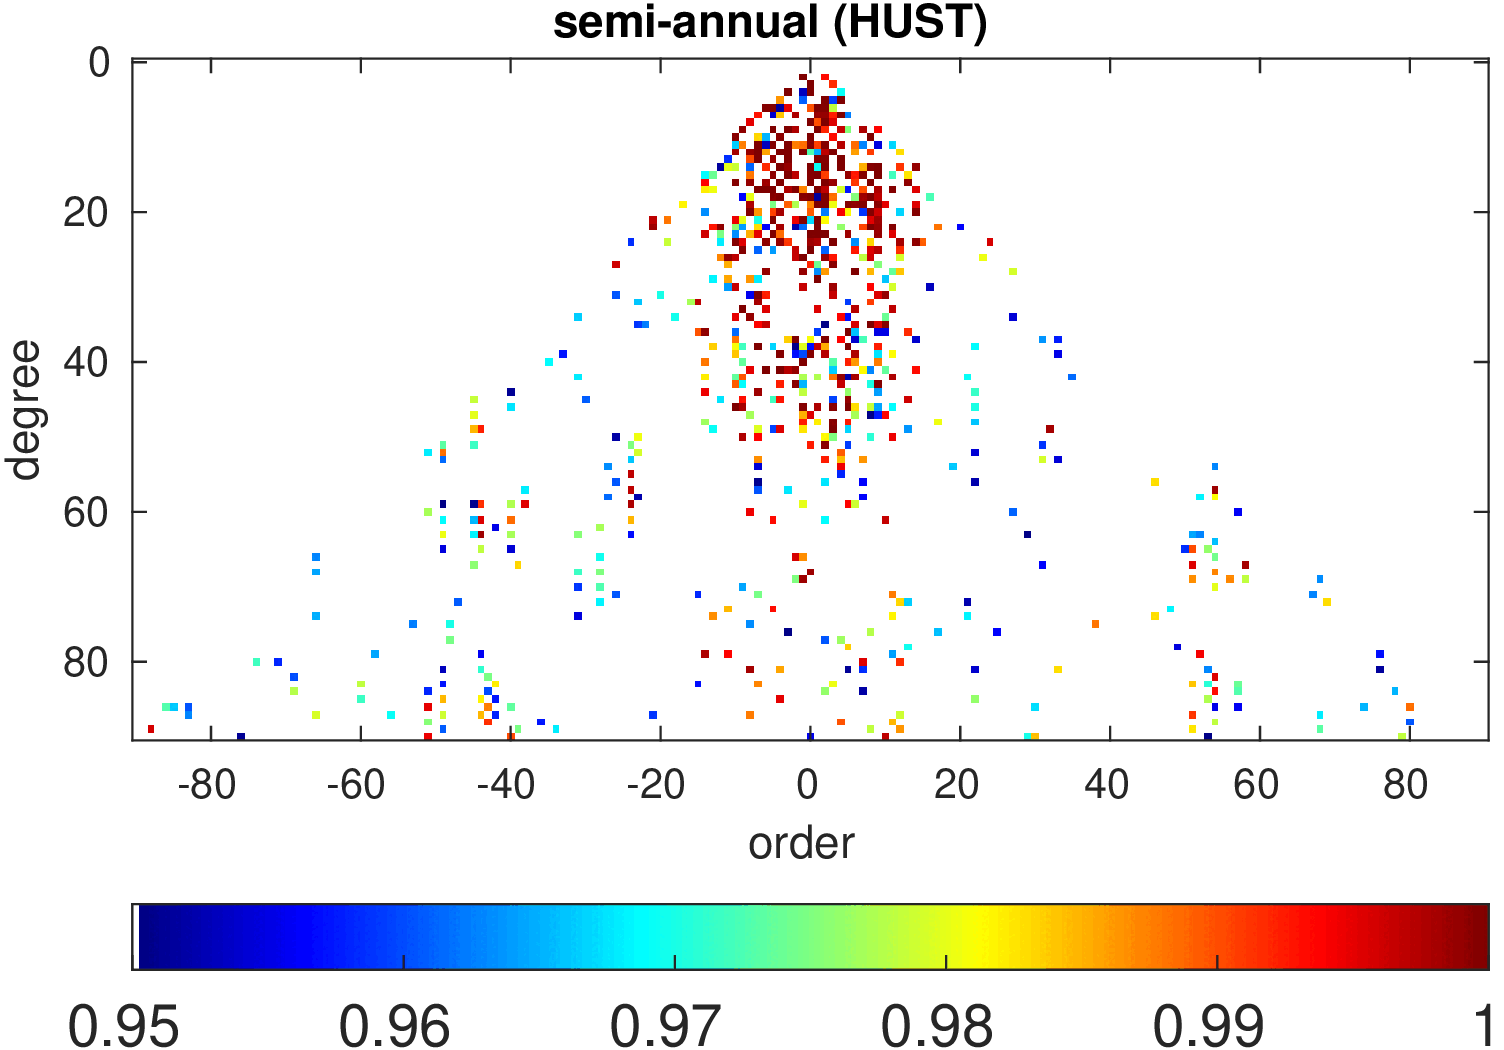
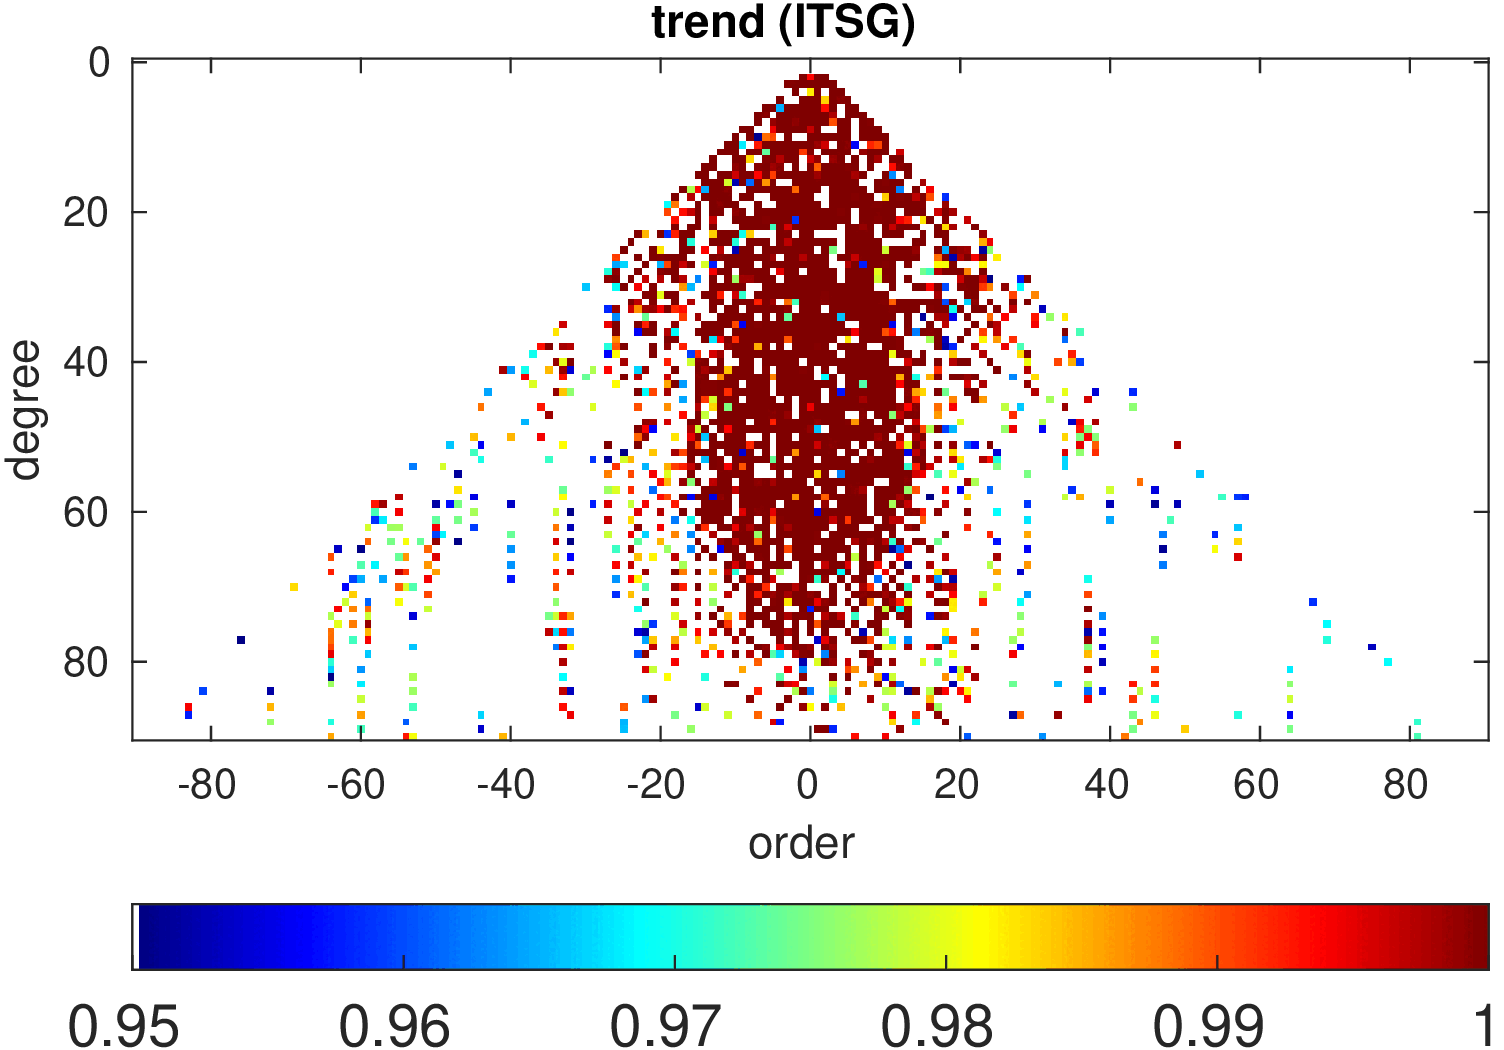
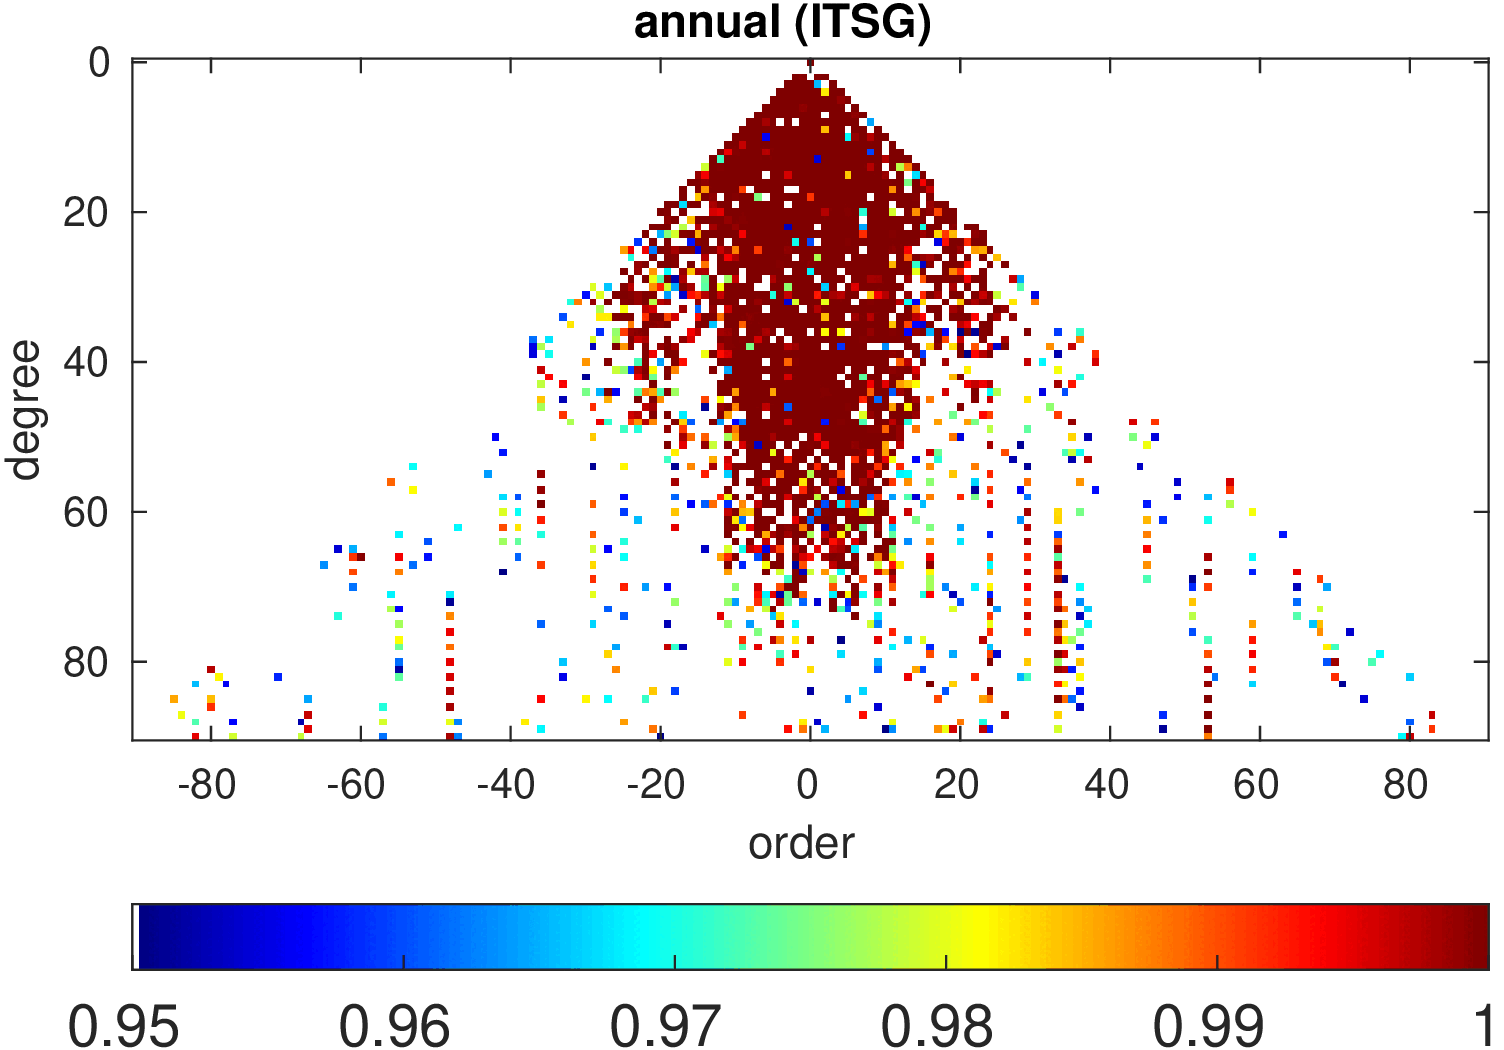
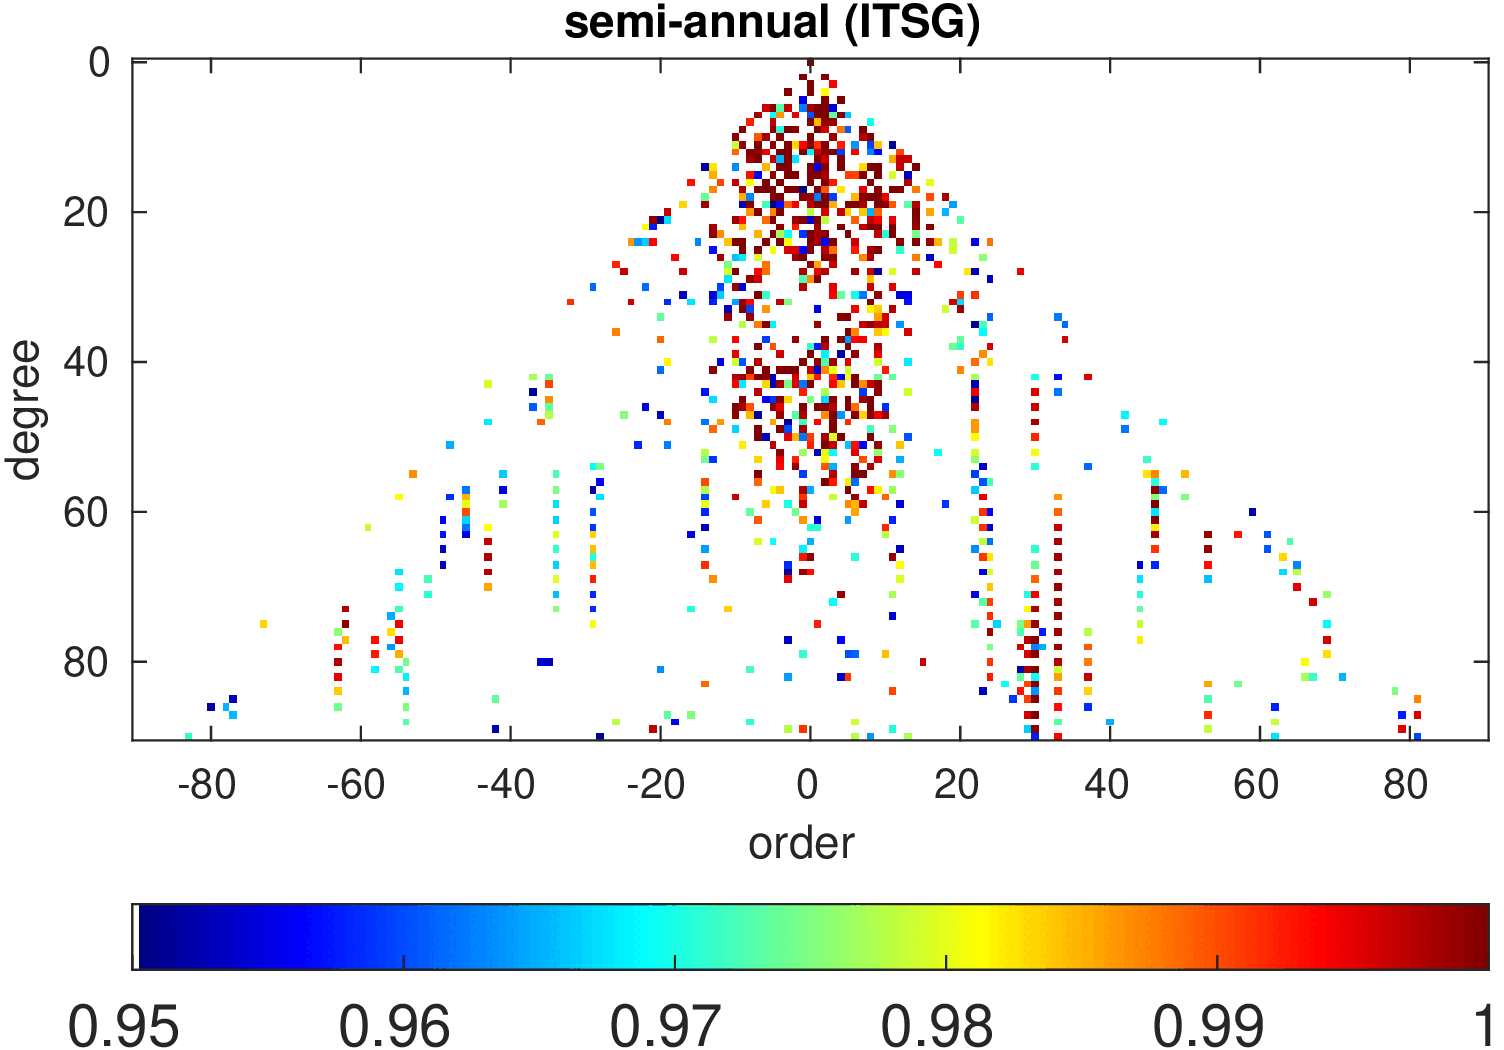
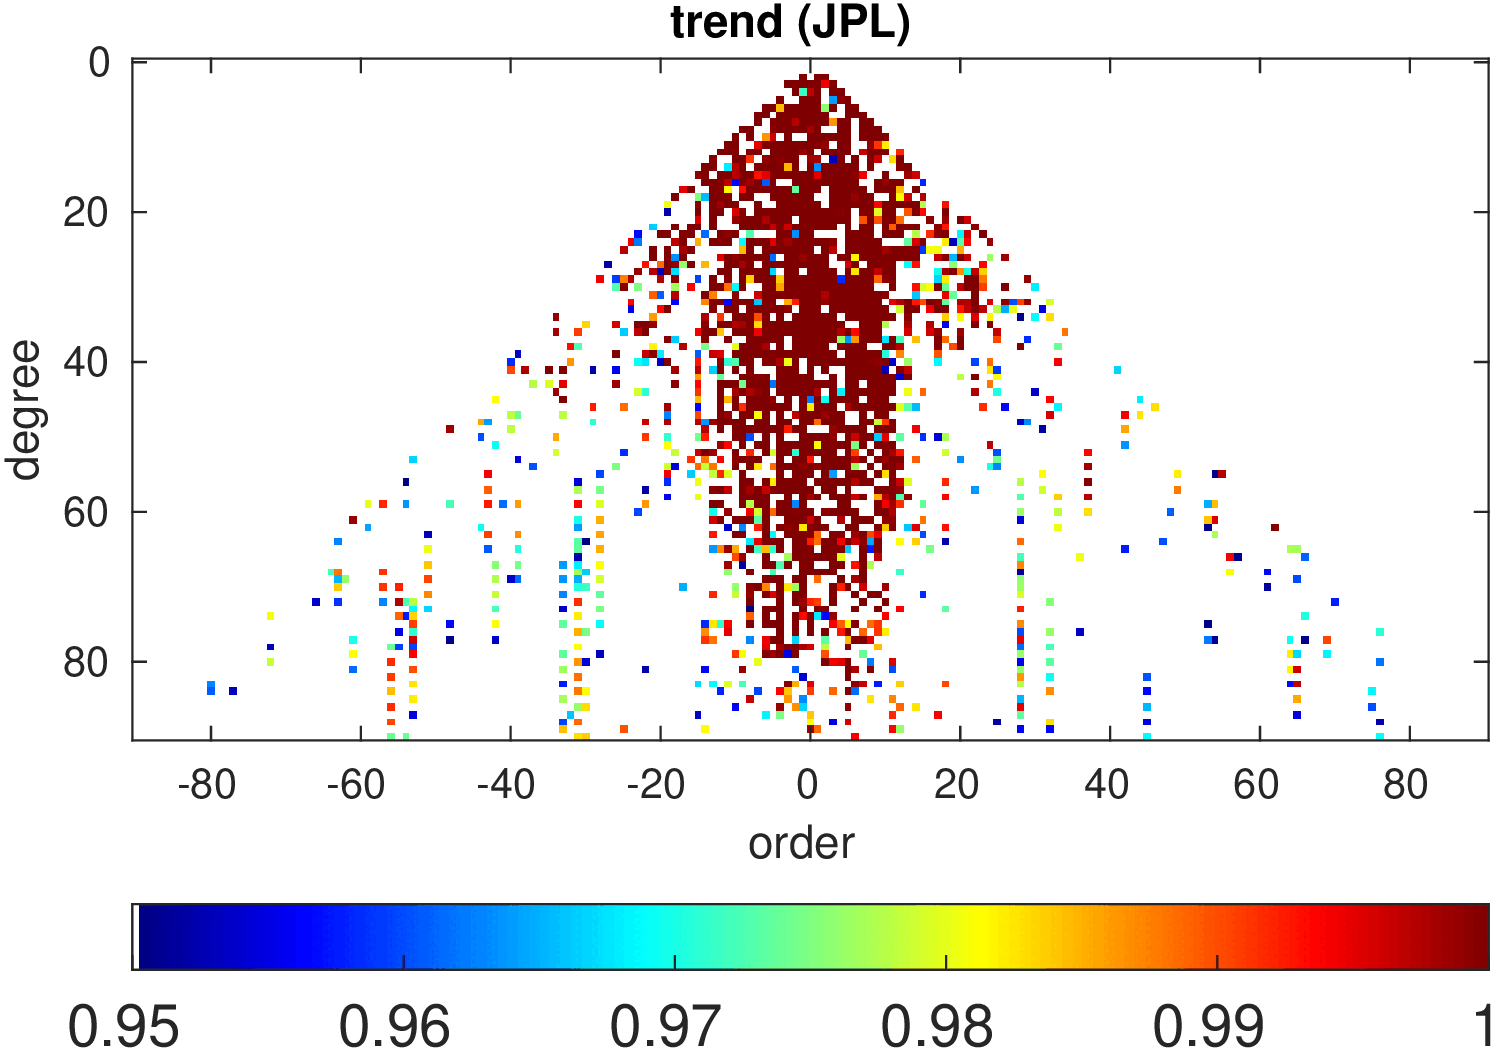
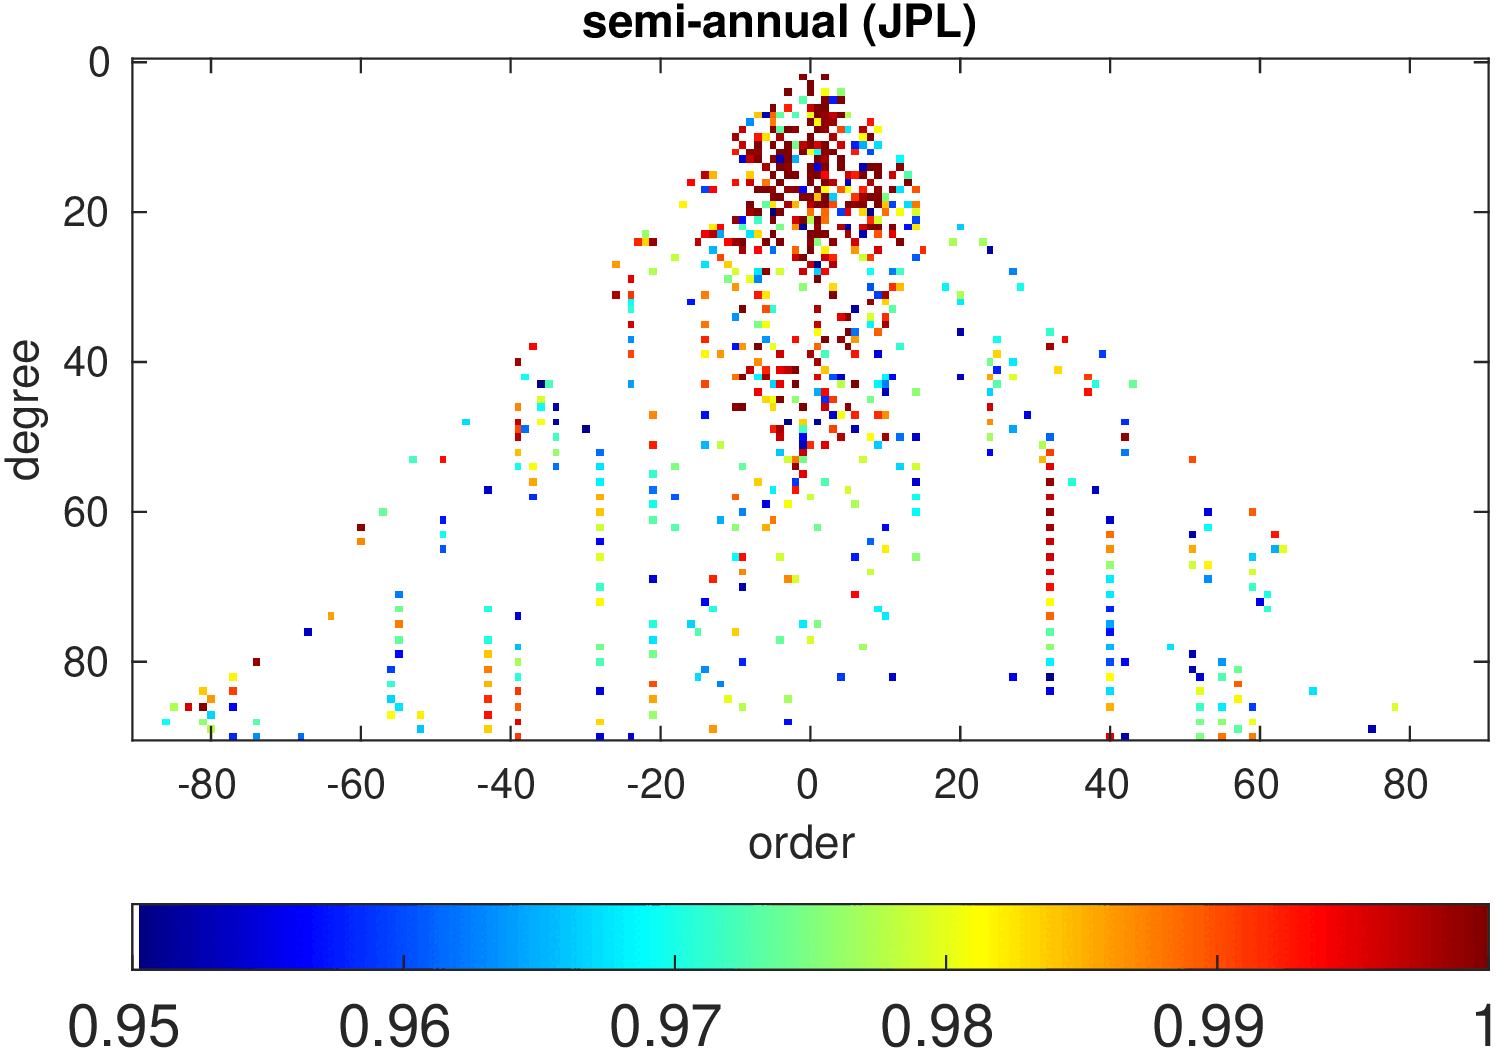
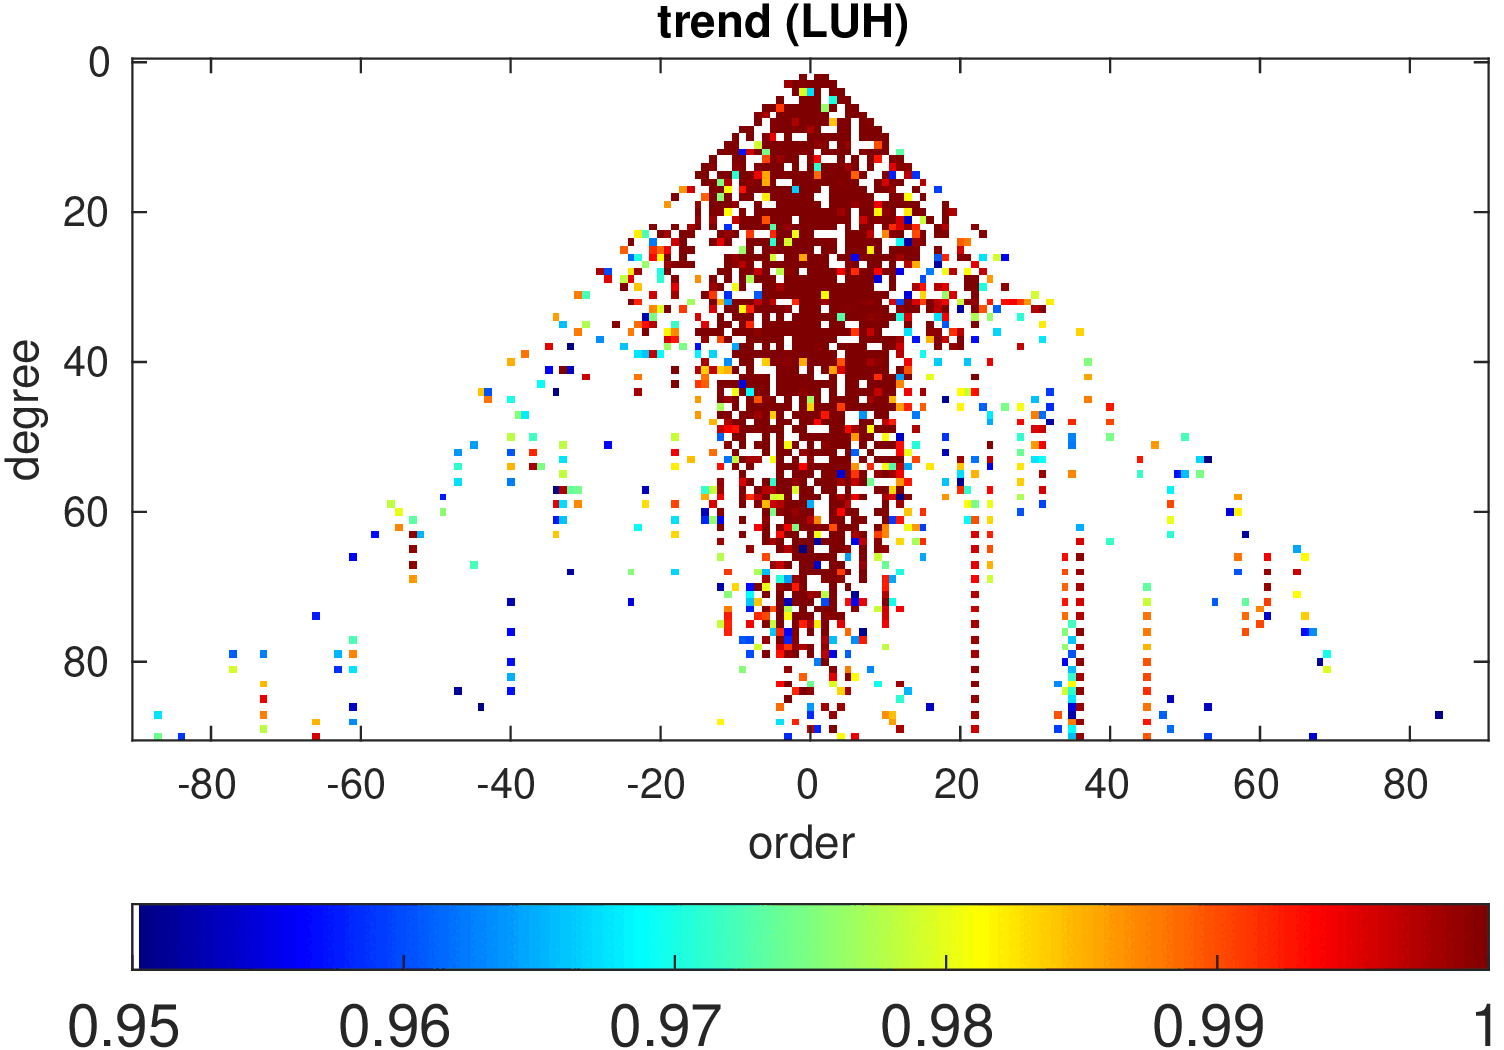
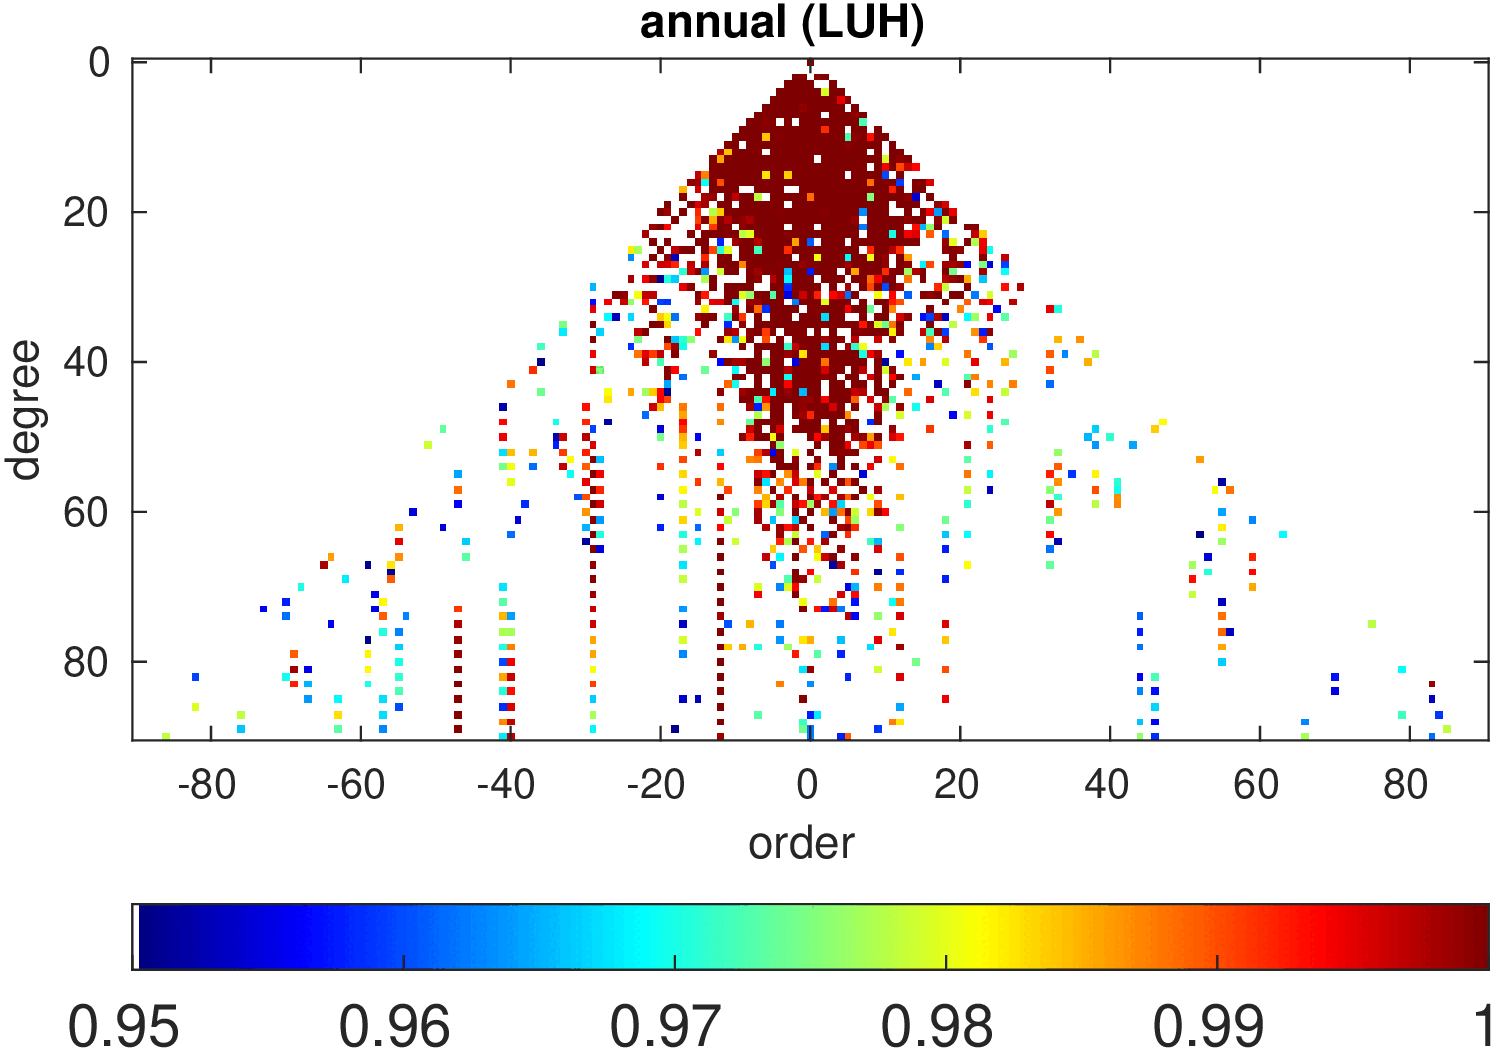
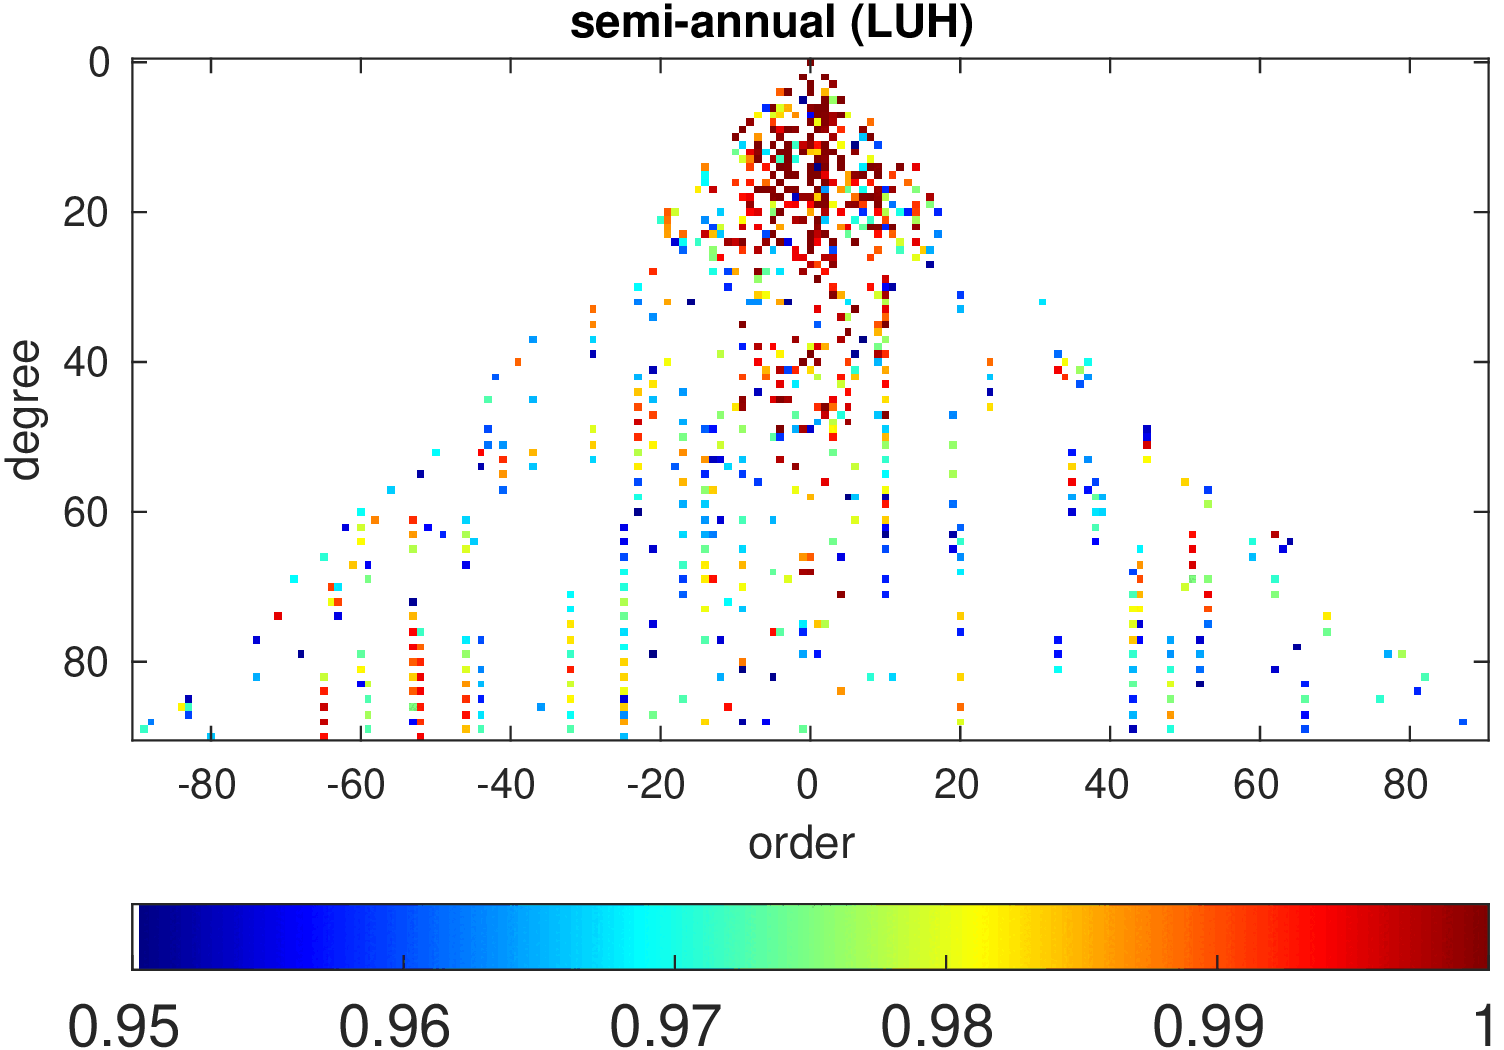
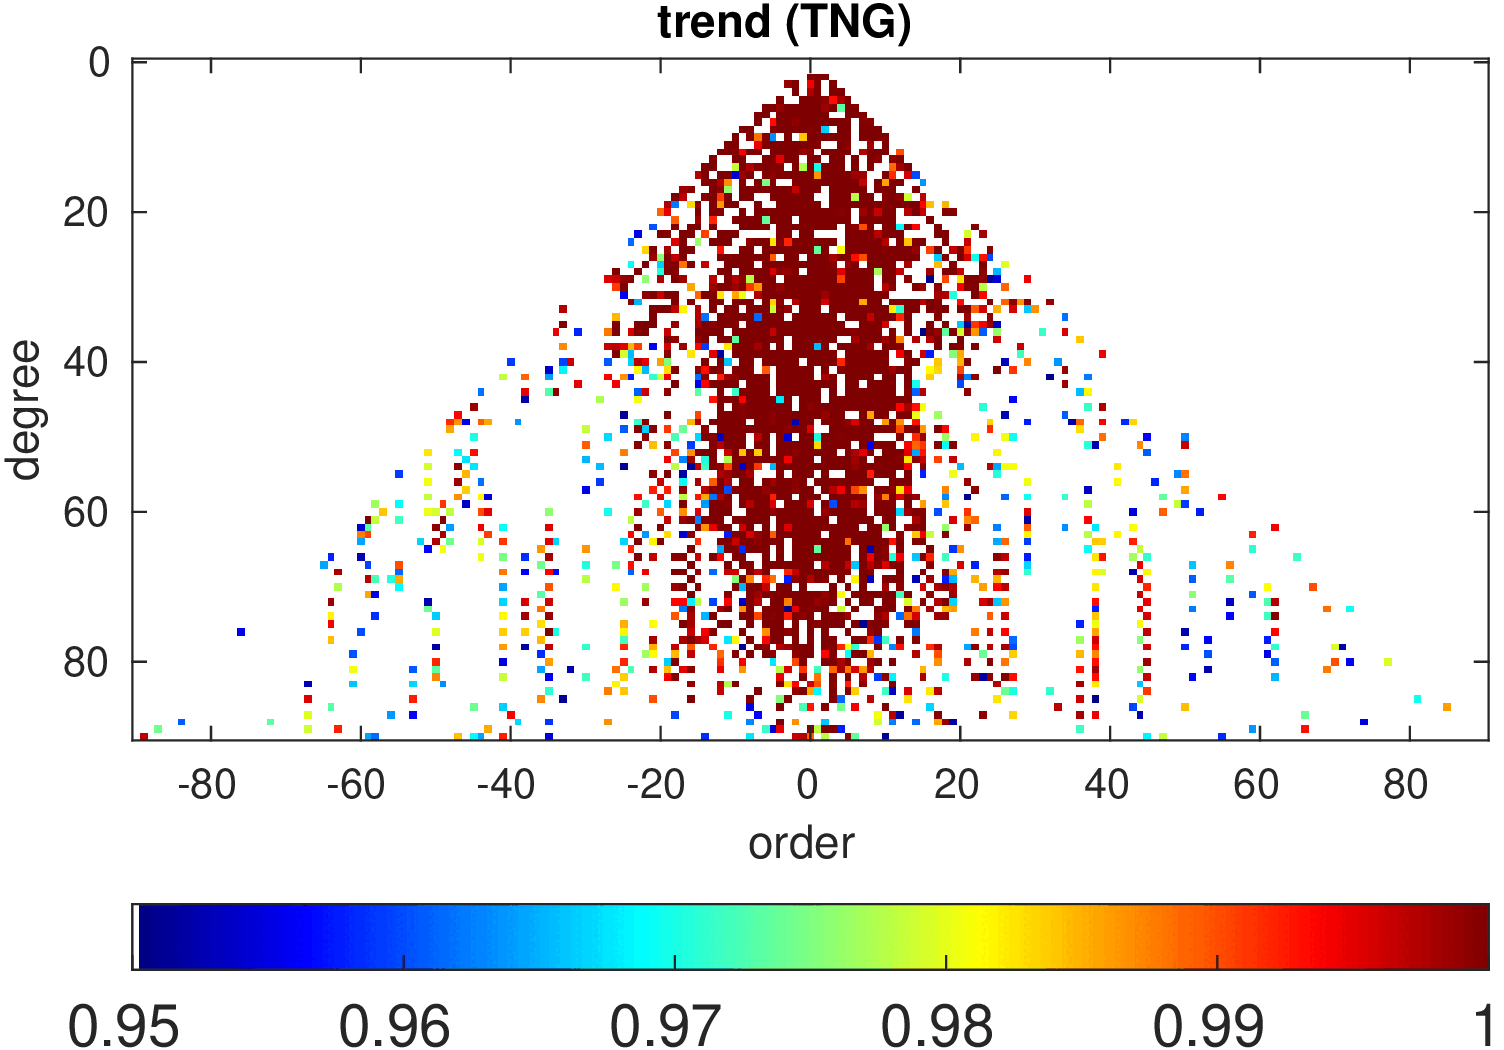
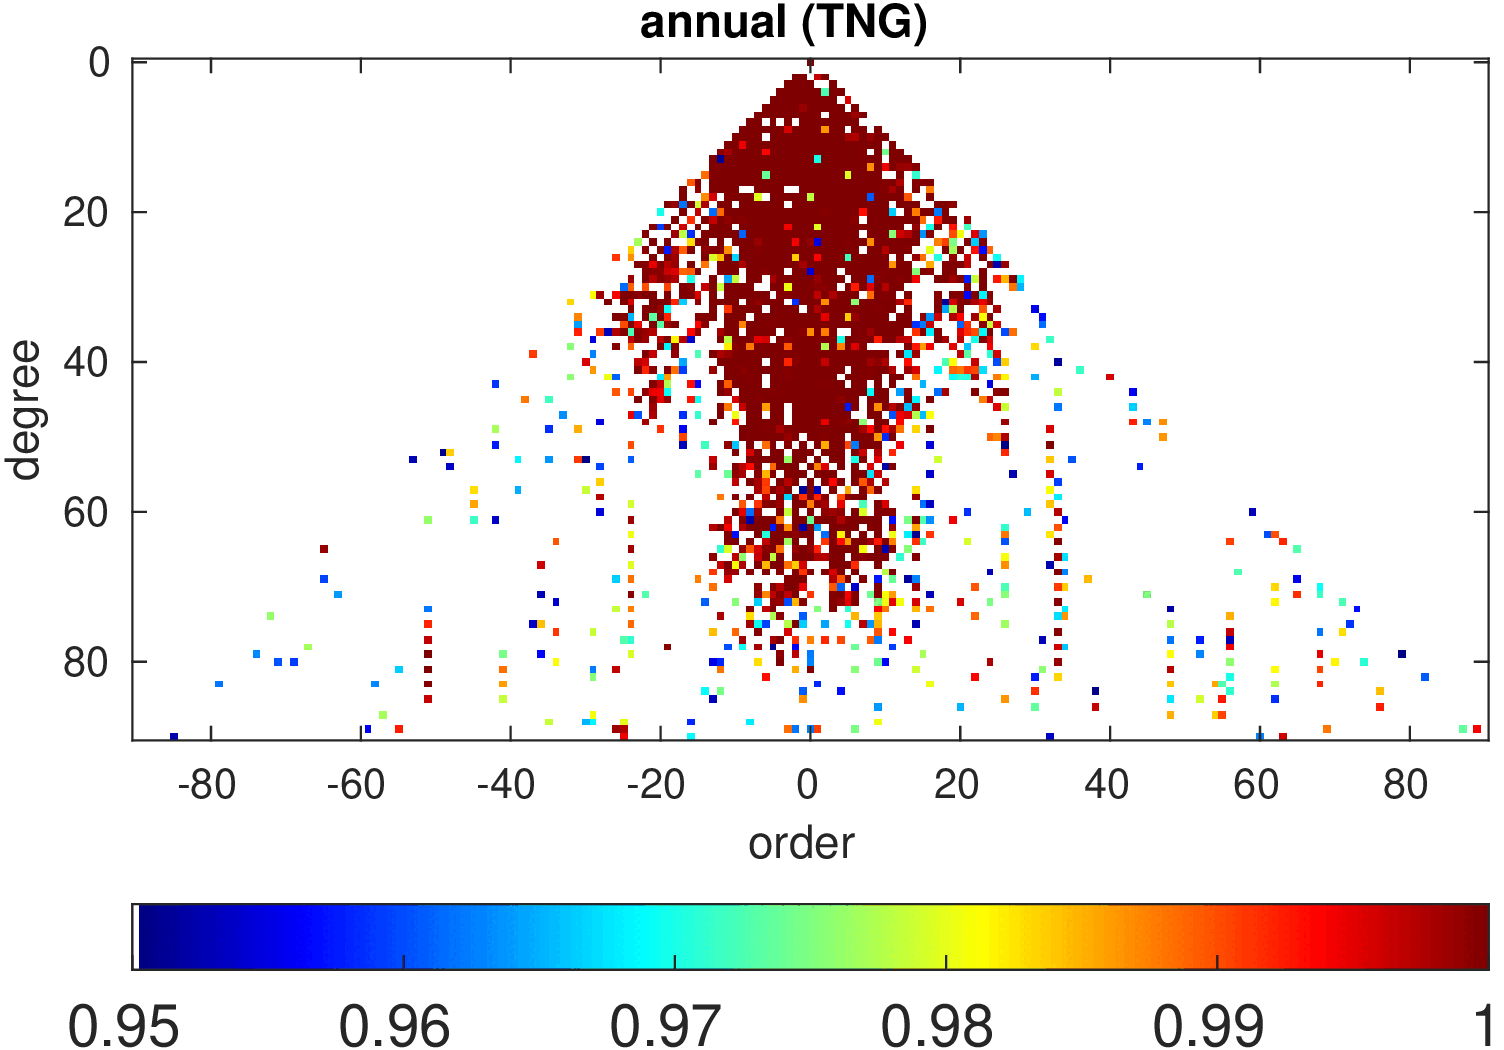
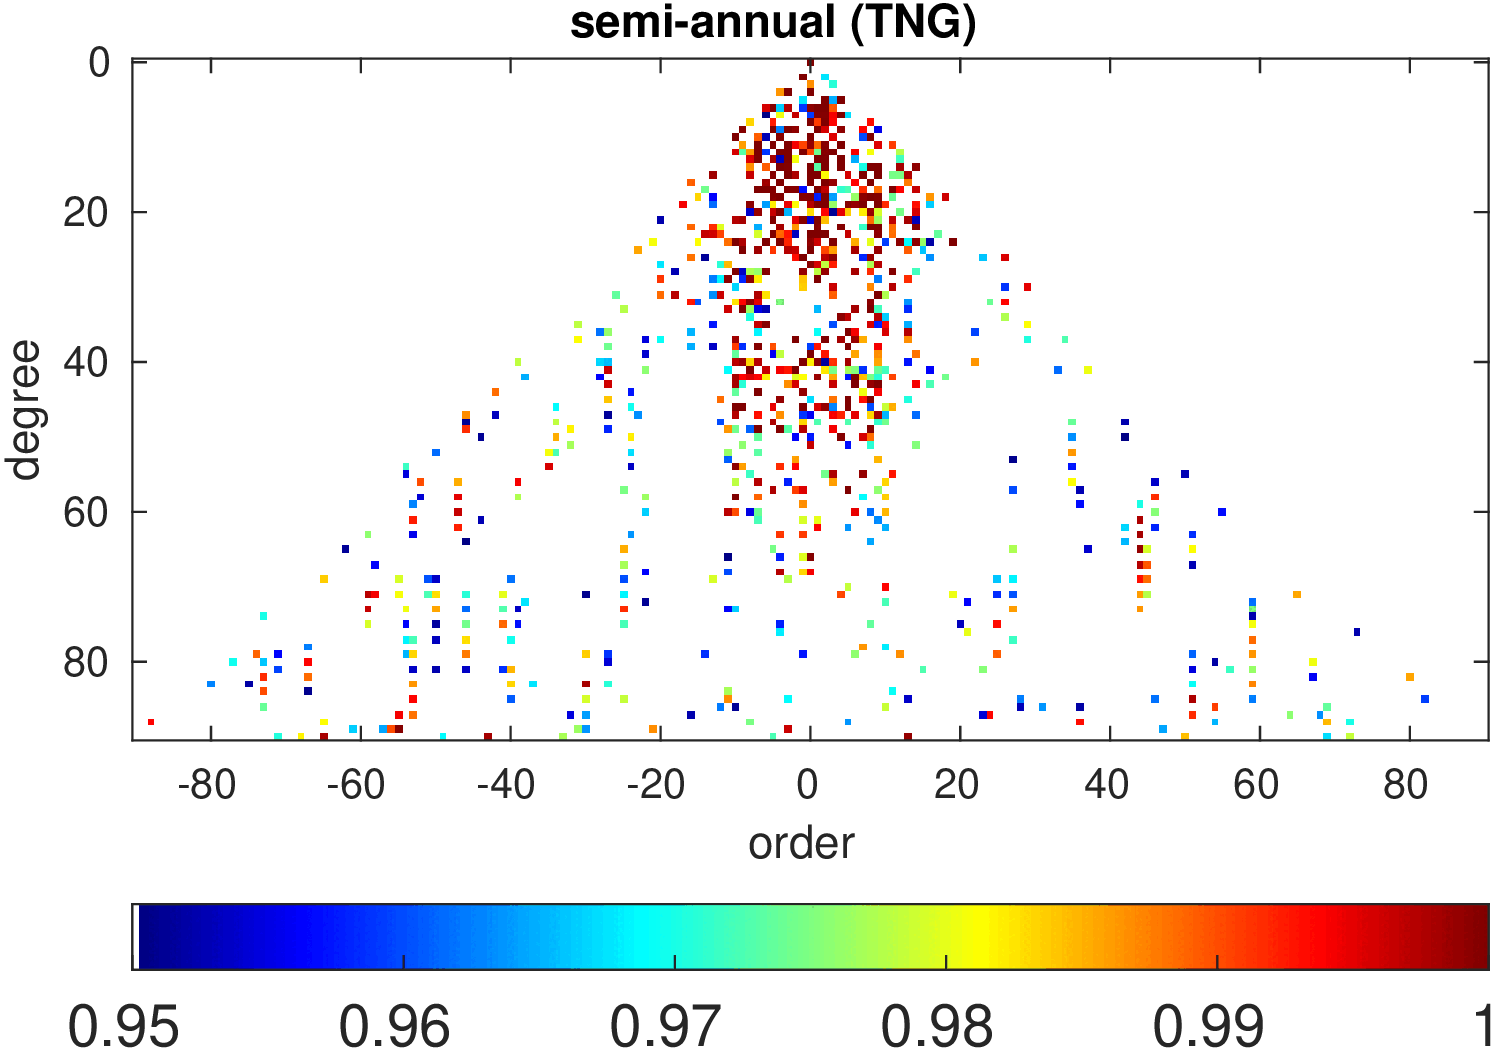
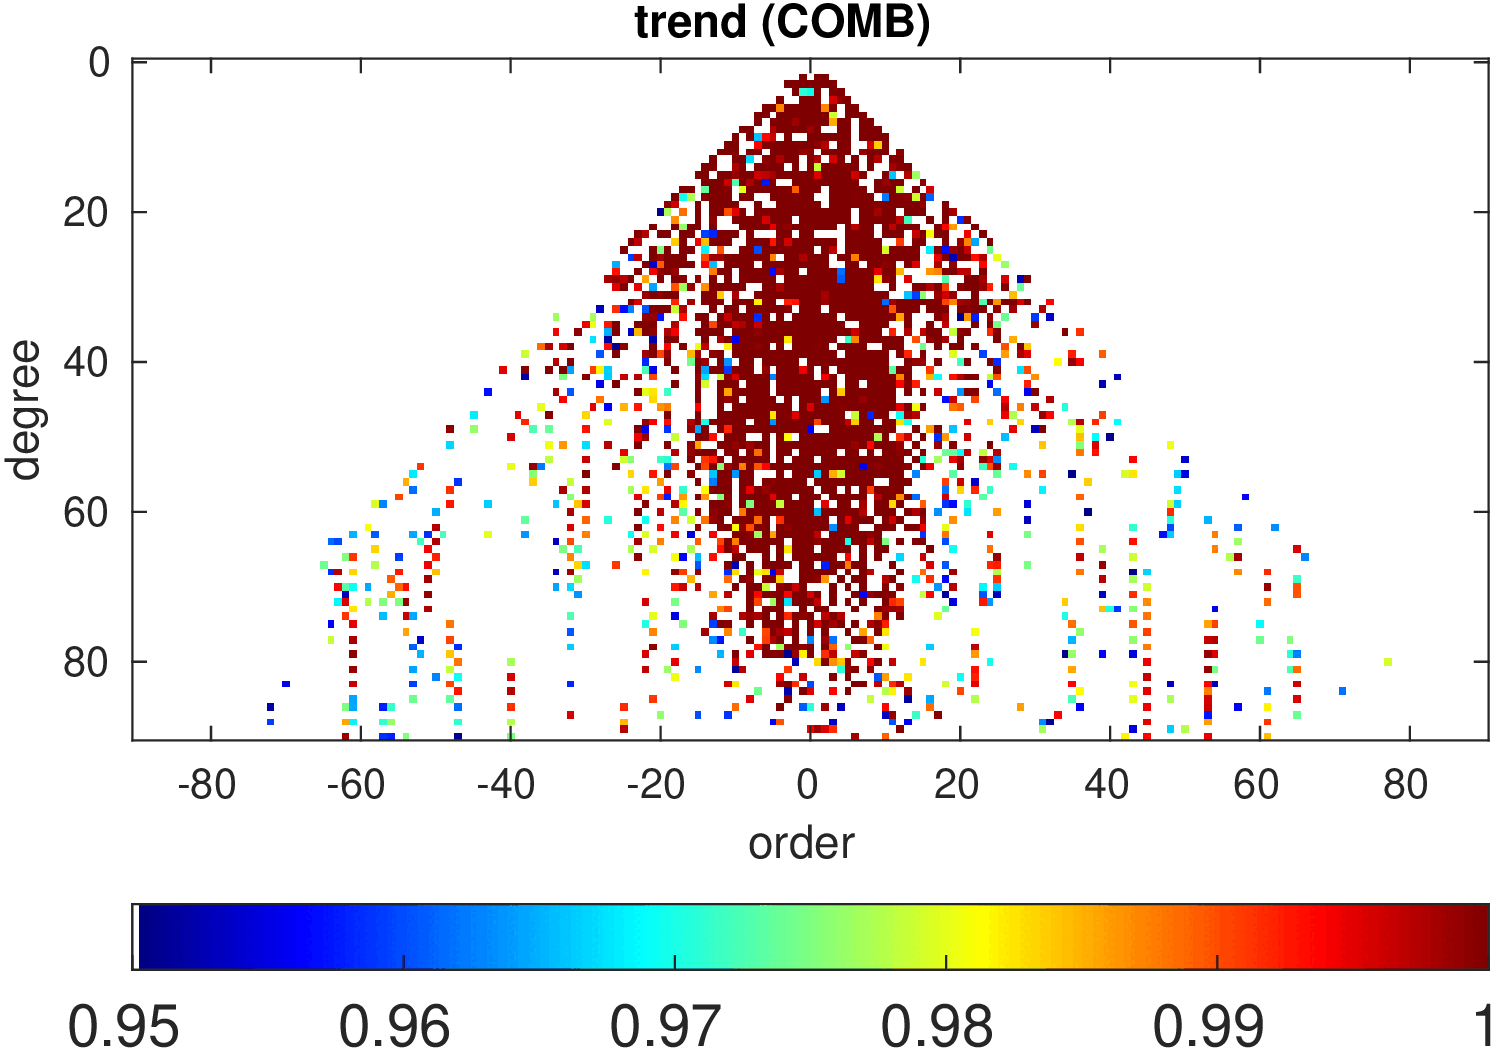
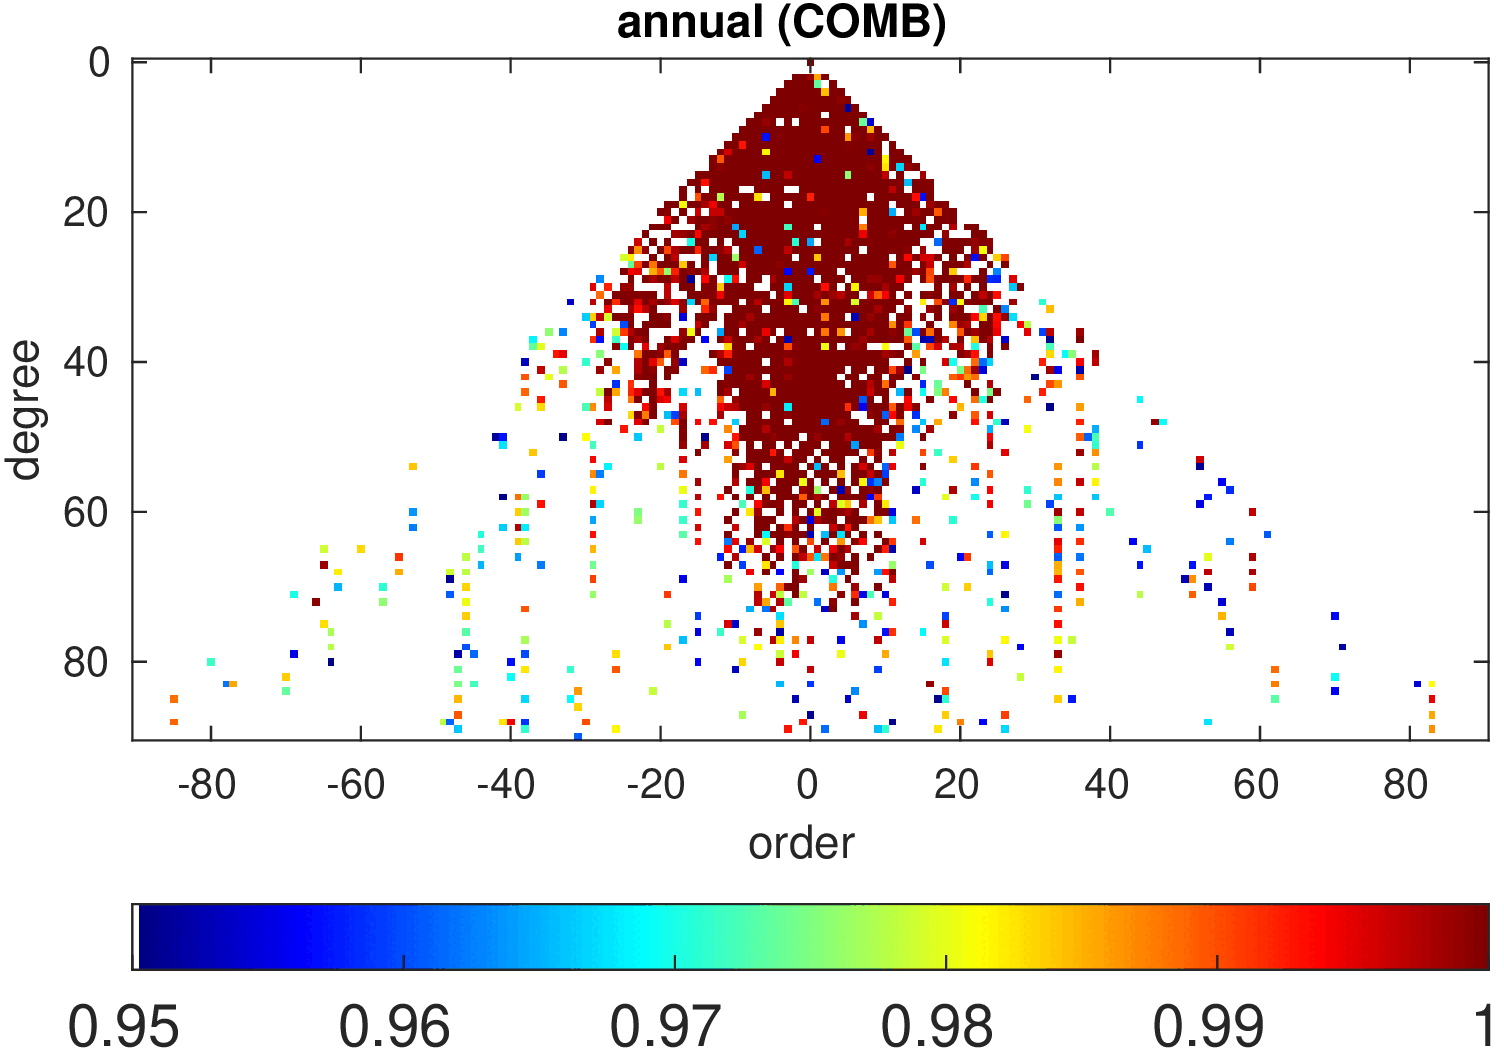
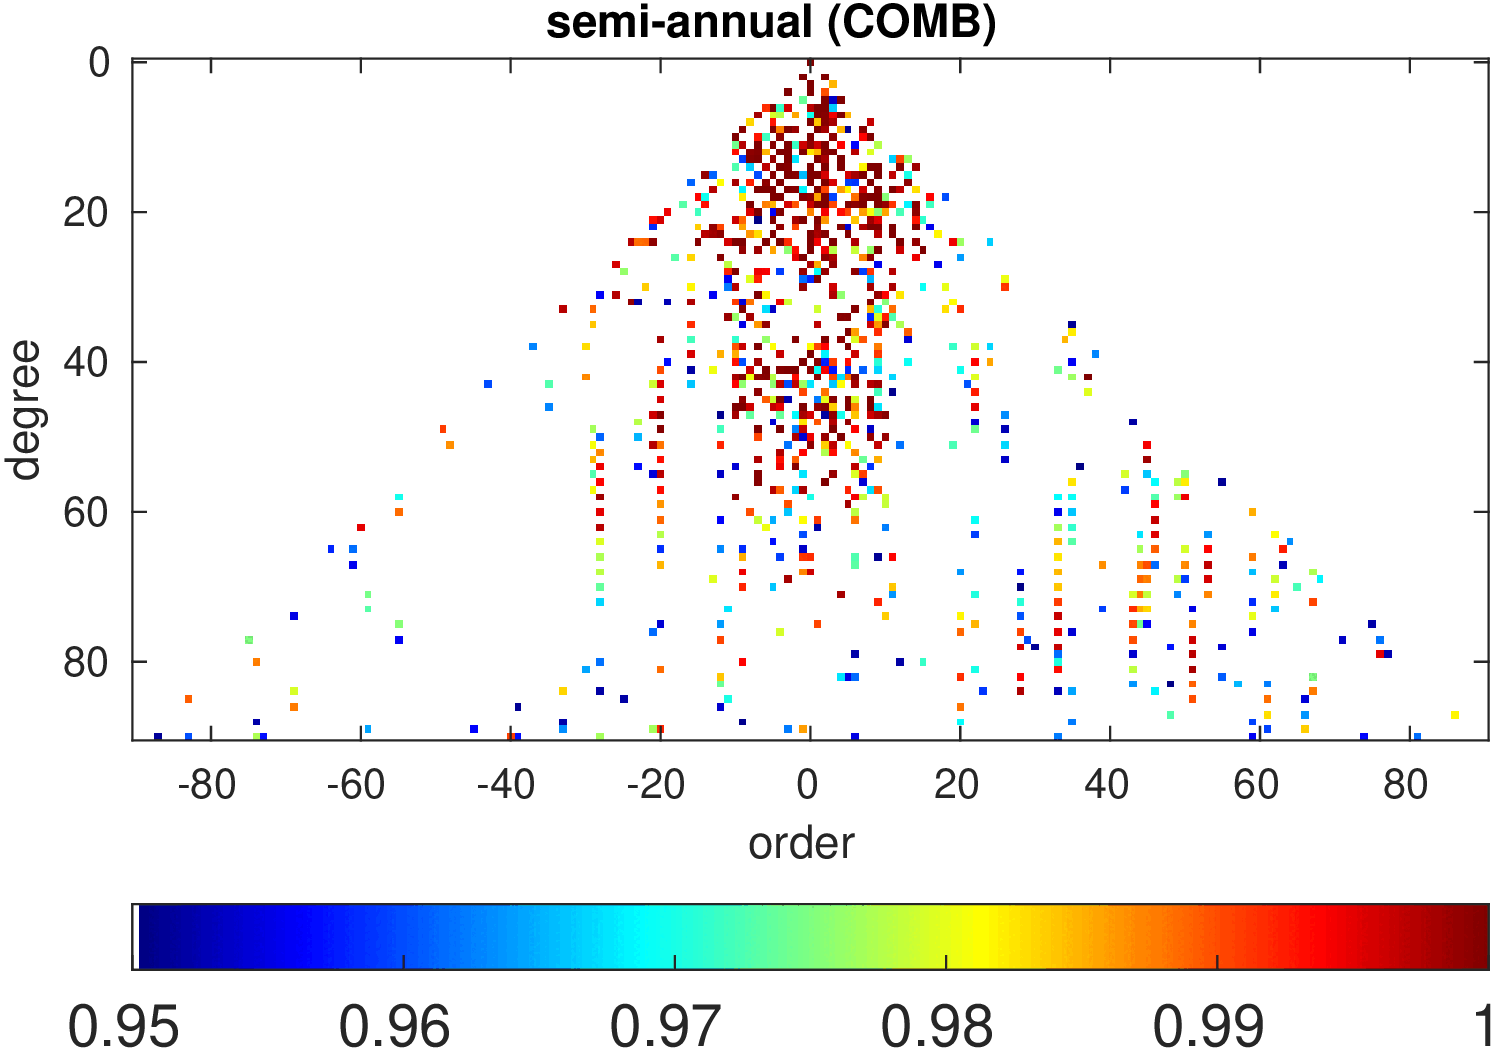
Significance of annual, semi-annual and secular variations in the spherical harmonic domain.
Evaluated is the time-period 2019-2024 common to all time-series.
| AC |
trend |
annual |
semi-annual |
| AIUB |
|
|
|
| CSR |
|
|
|
| GFZ |
|
|
|
| GRGS |
|
|
|
| HUST |
|
|
|
| ITSG |
|
|
|
| JPL |
|

|
|
| LUH |
|
|
|
| TNG |
|
|
|
| COMB |
|
|
|
top
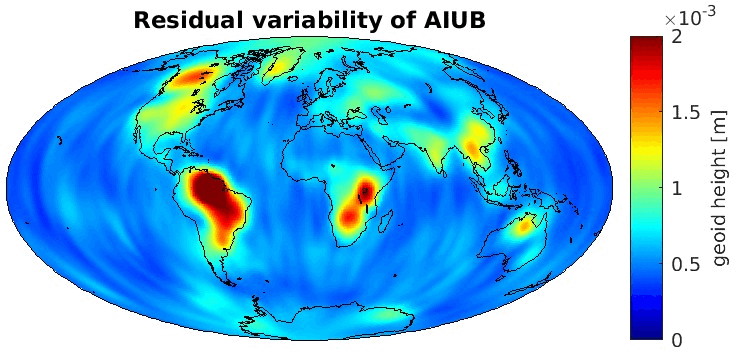
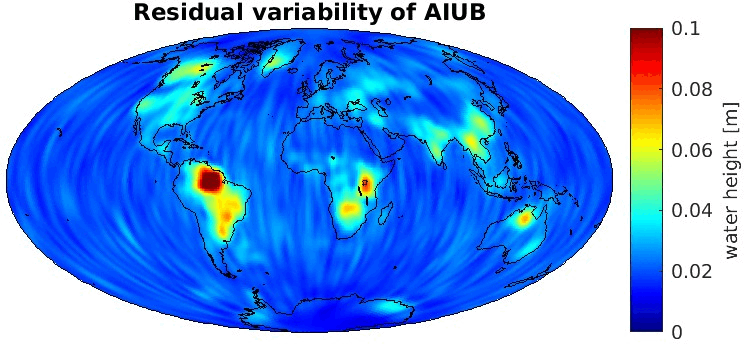
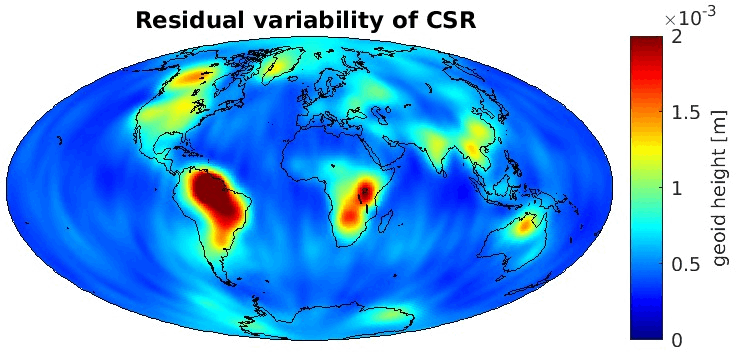
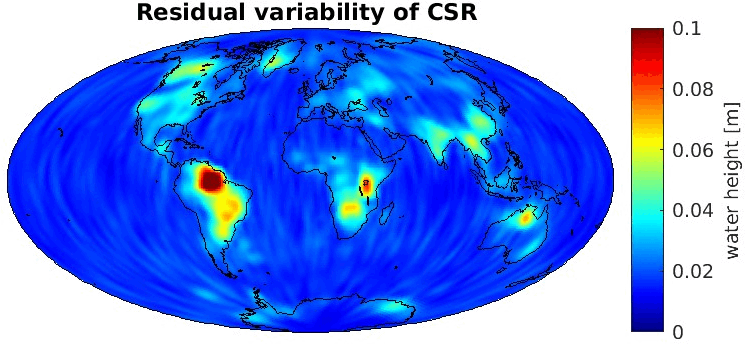
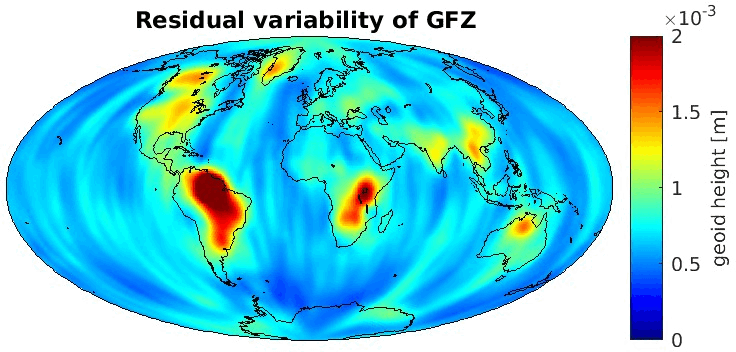
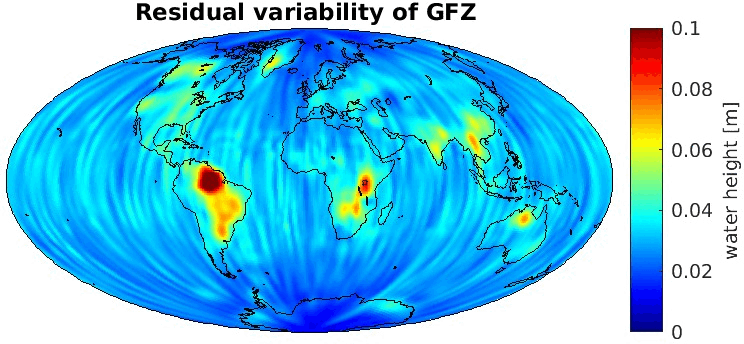
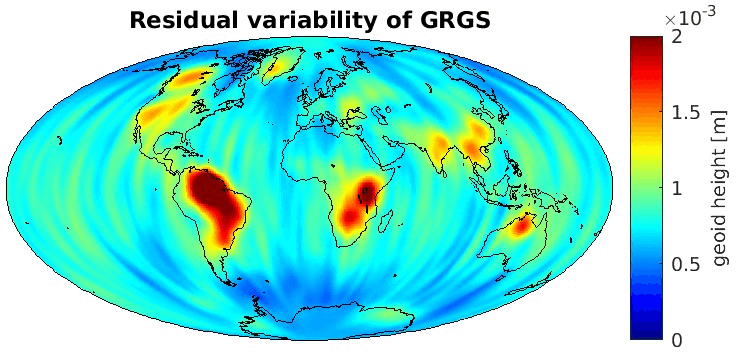
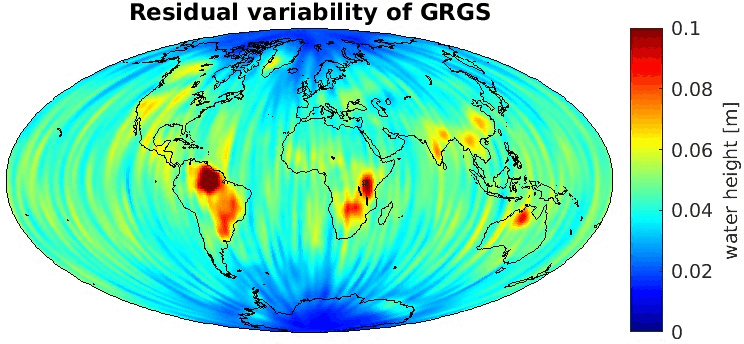
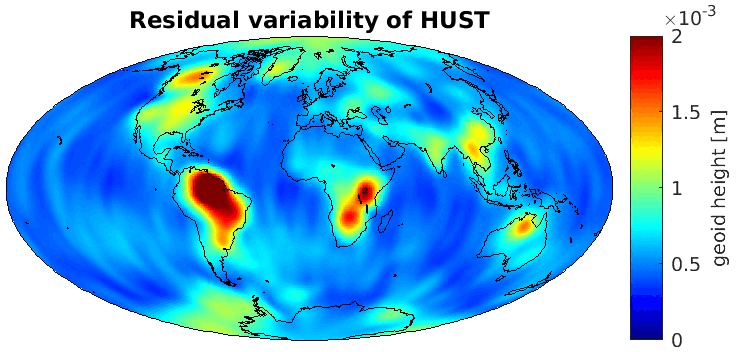
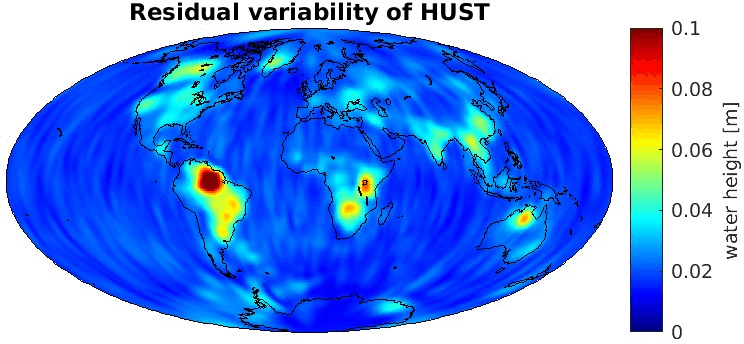
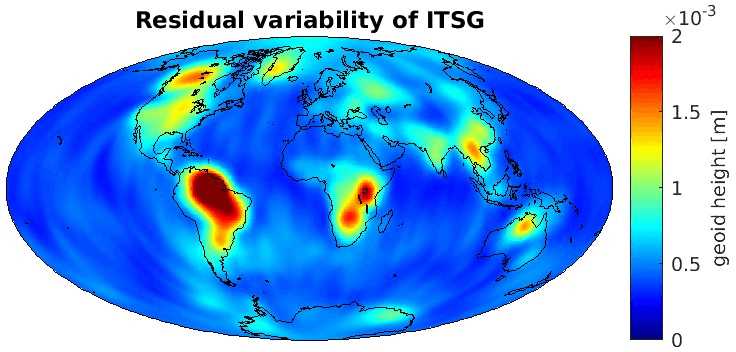
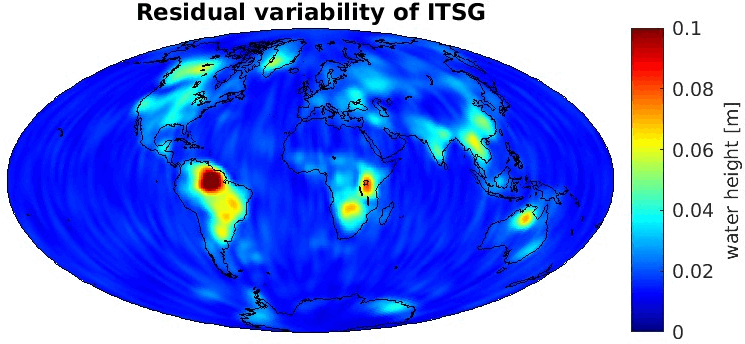
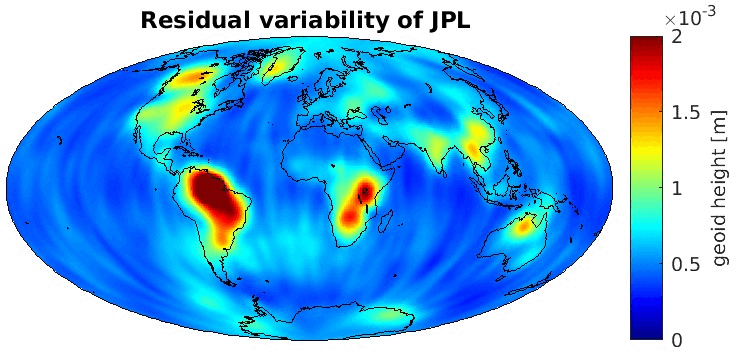
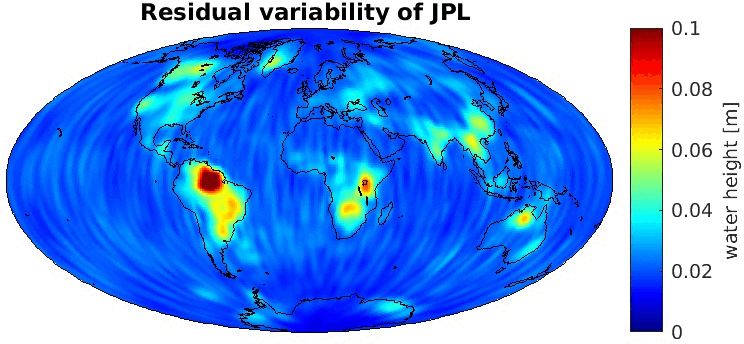
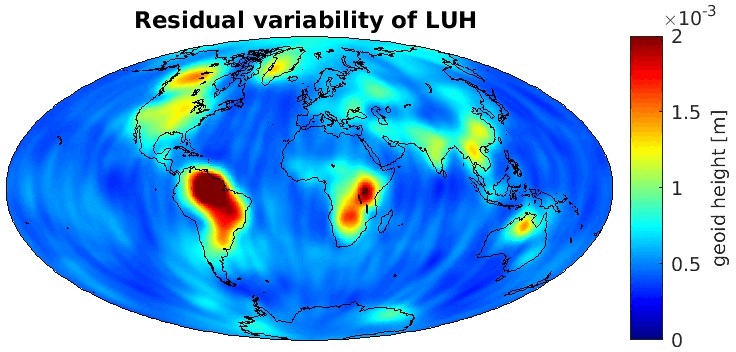
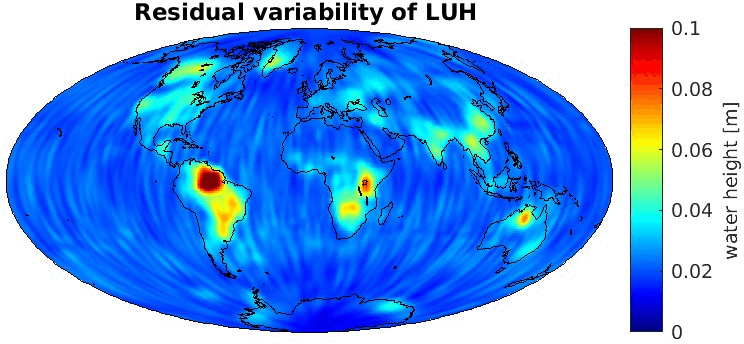
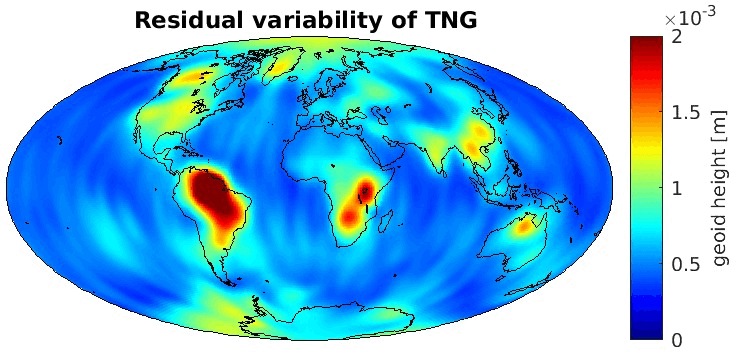
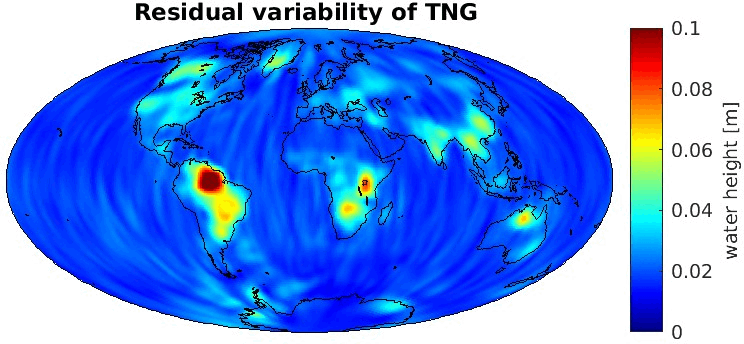
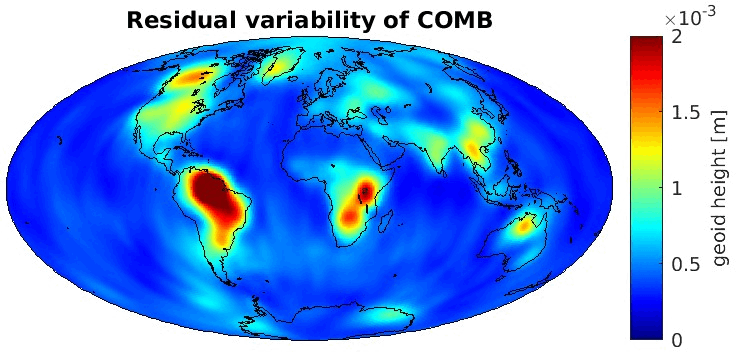
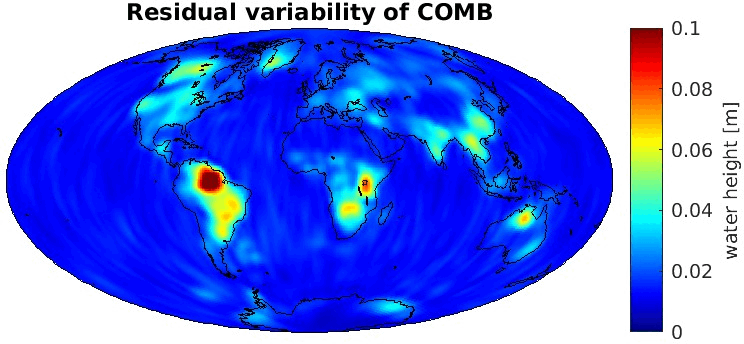
Grid-wise RMS of non-seasonal, non-secular variations. Over the oceans these variations serve to assess the noise content ot the time-series.
From all time-series a common signal model fitted to the monthly means of all time-series is subtracted.
All monthly gravity fields were filtered with a 400 km Gauss filter.
| AC |
Geoid |
EWH |
| AIUB |
|
|
| CSR |
|
|
| GFZ |
|
|
| GRGS |
|
|
| HUST |
|
|
| ITSG |
|
|
| JPL |
|
|
| LUH |
|
|
| TNG |
|
|
| COMB |
|
|
top
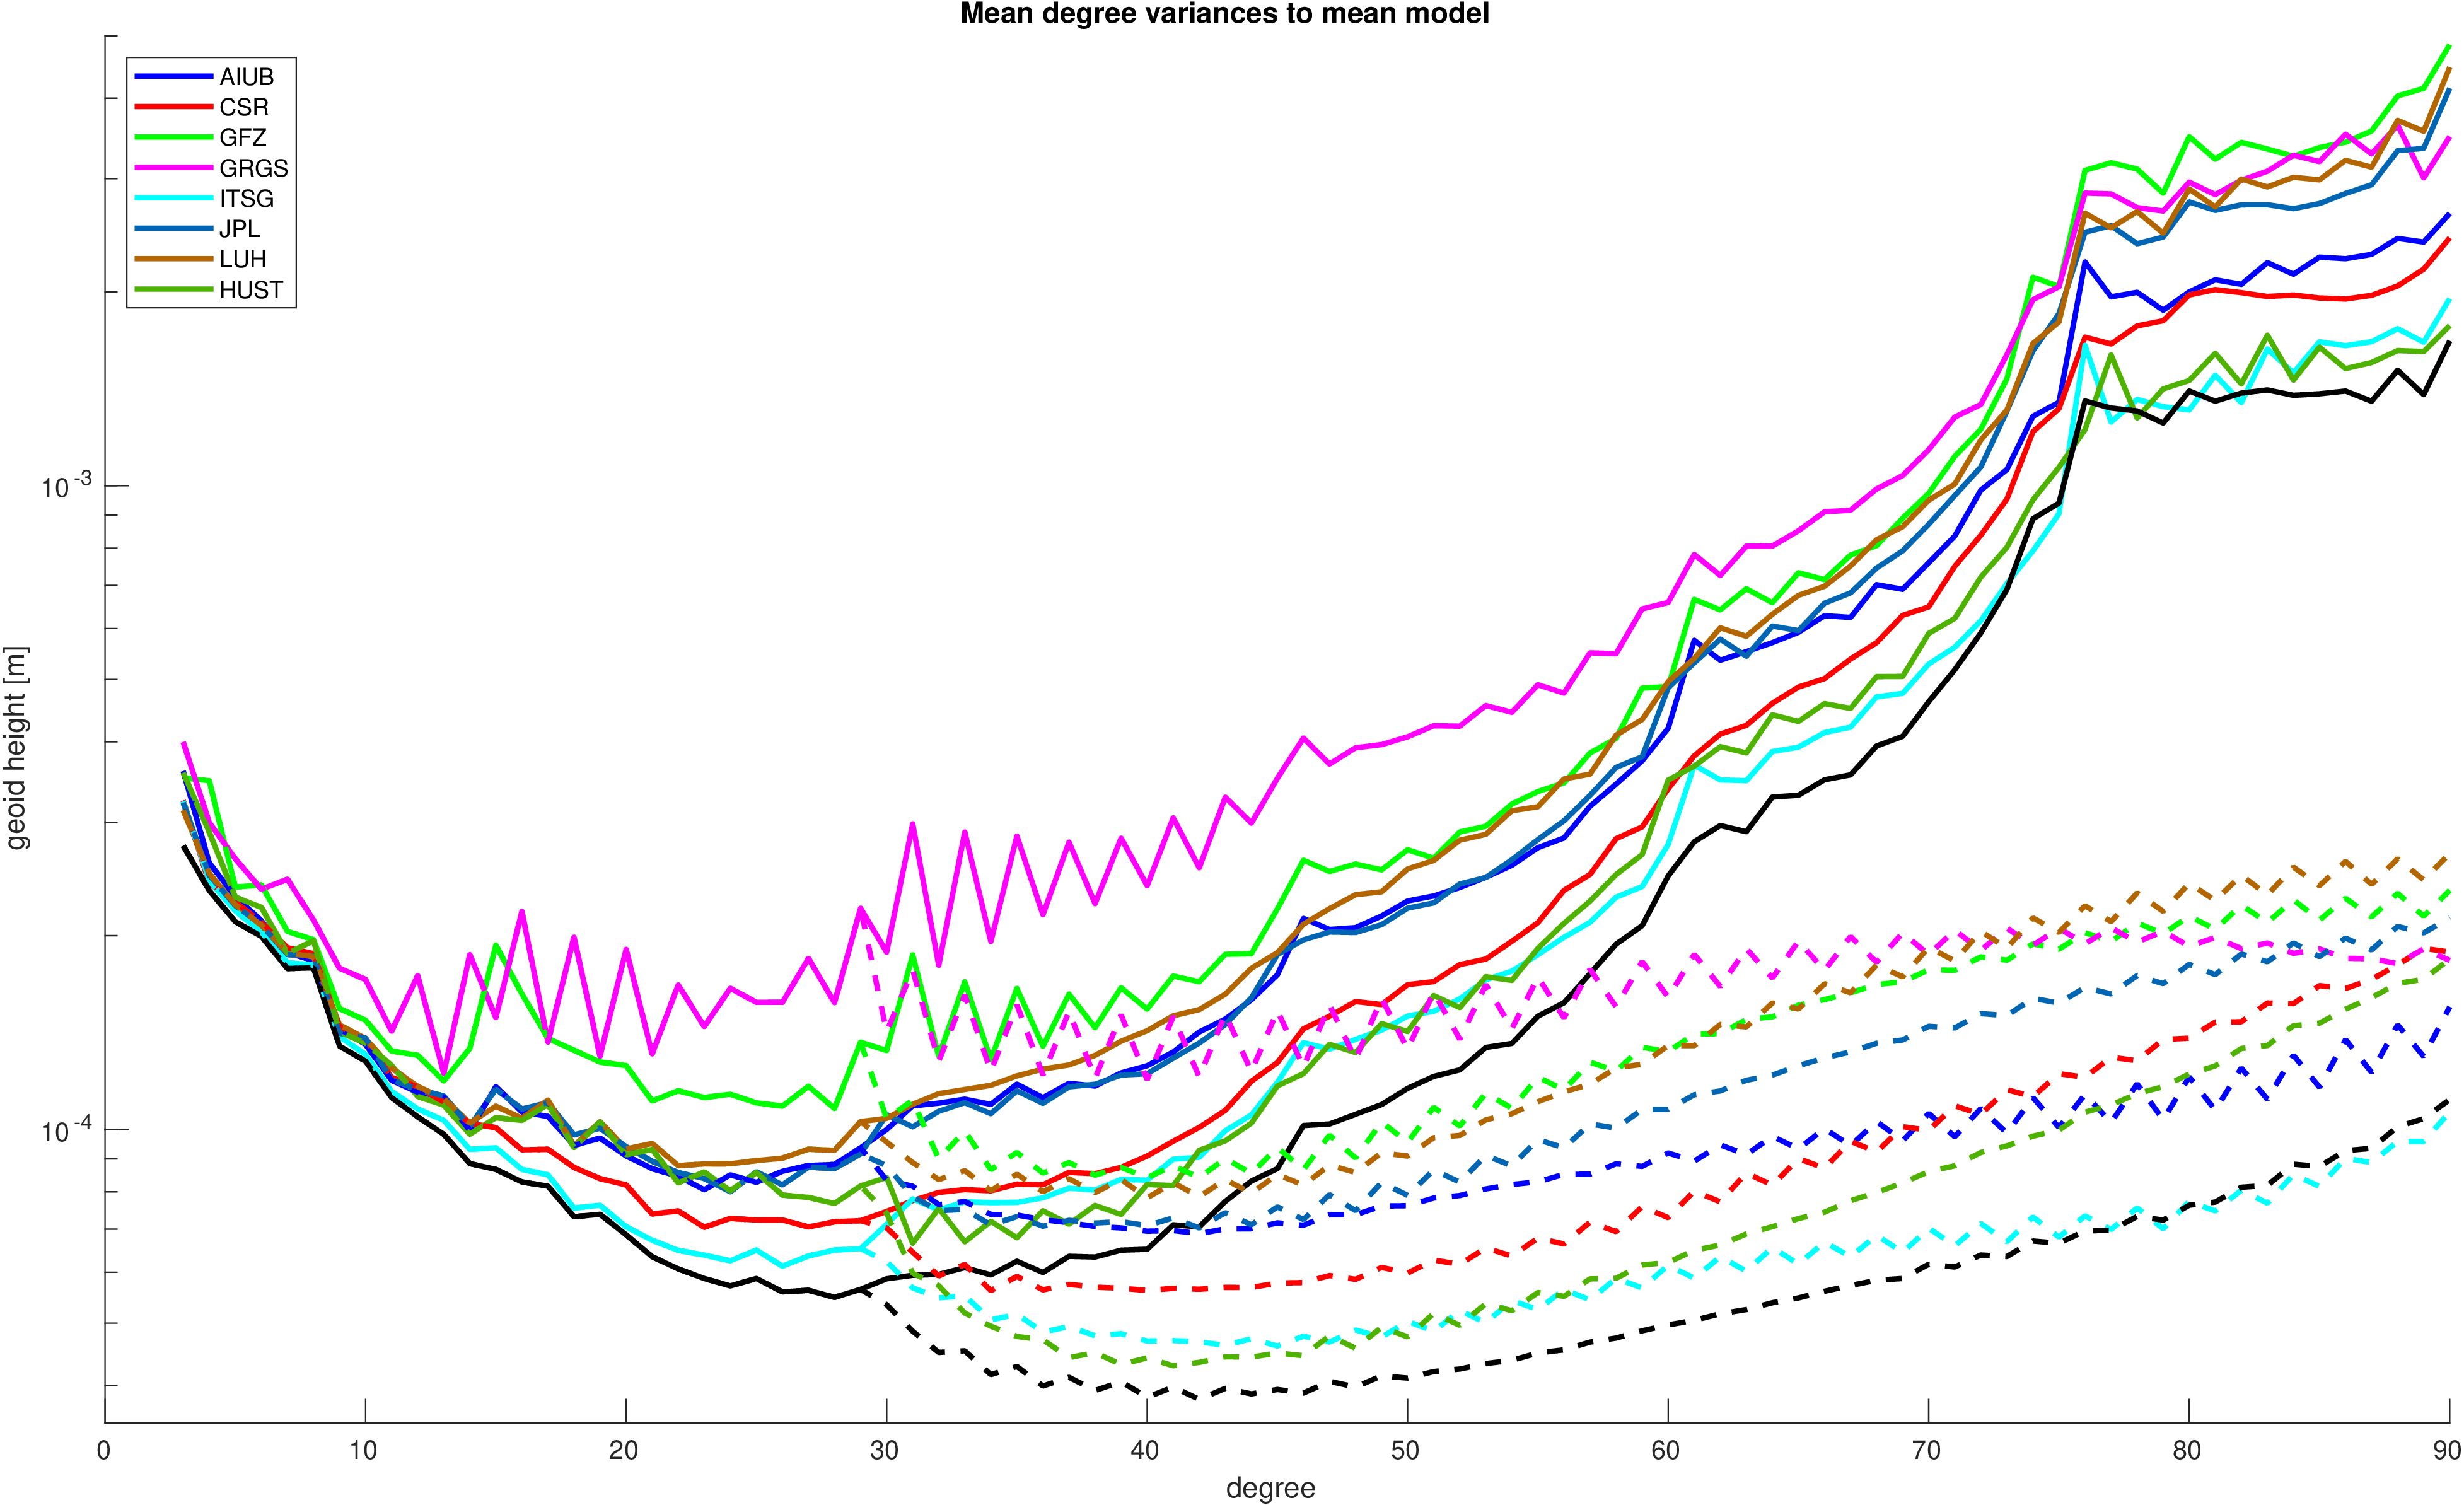
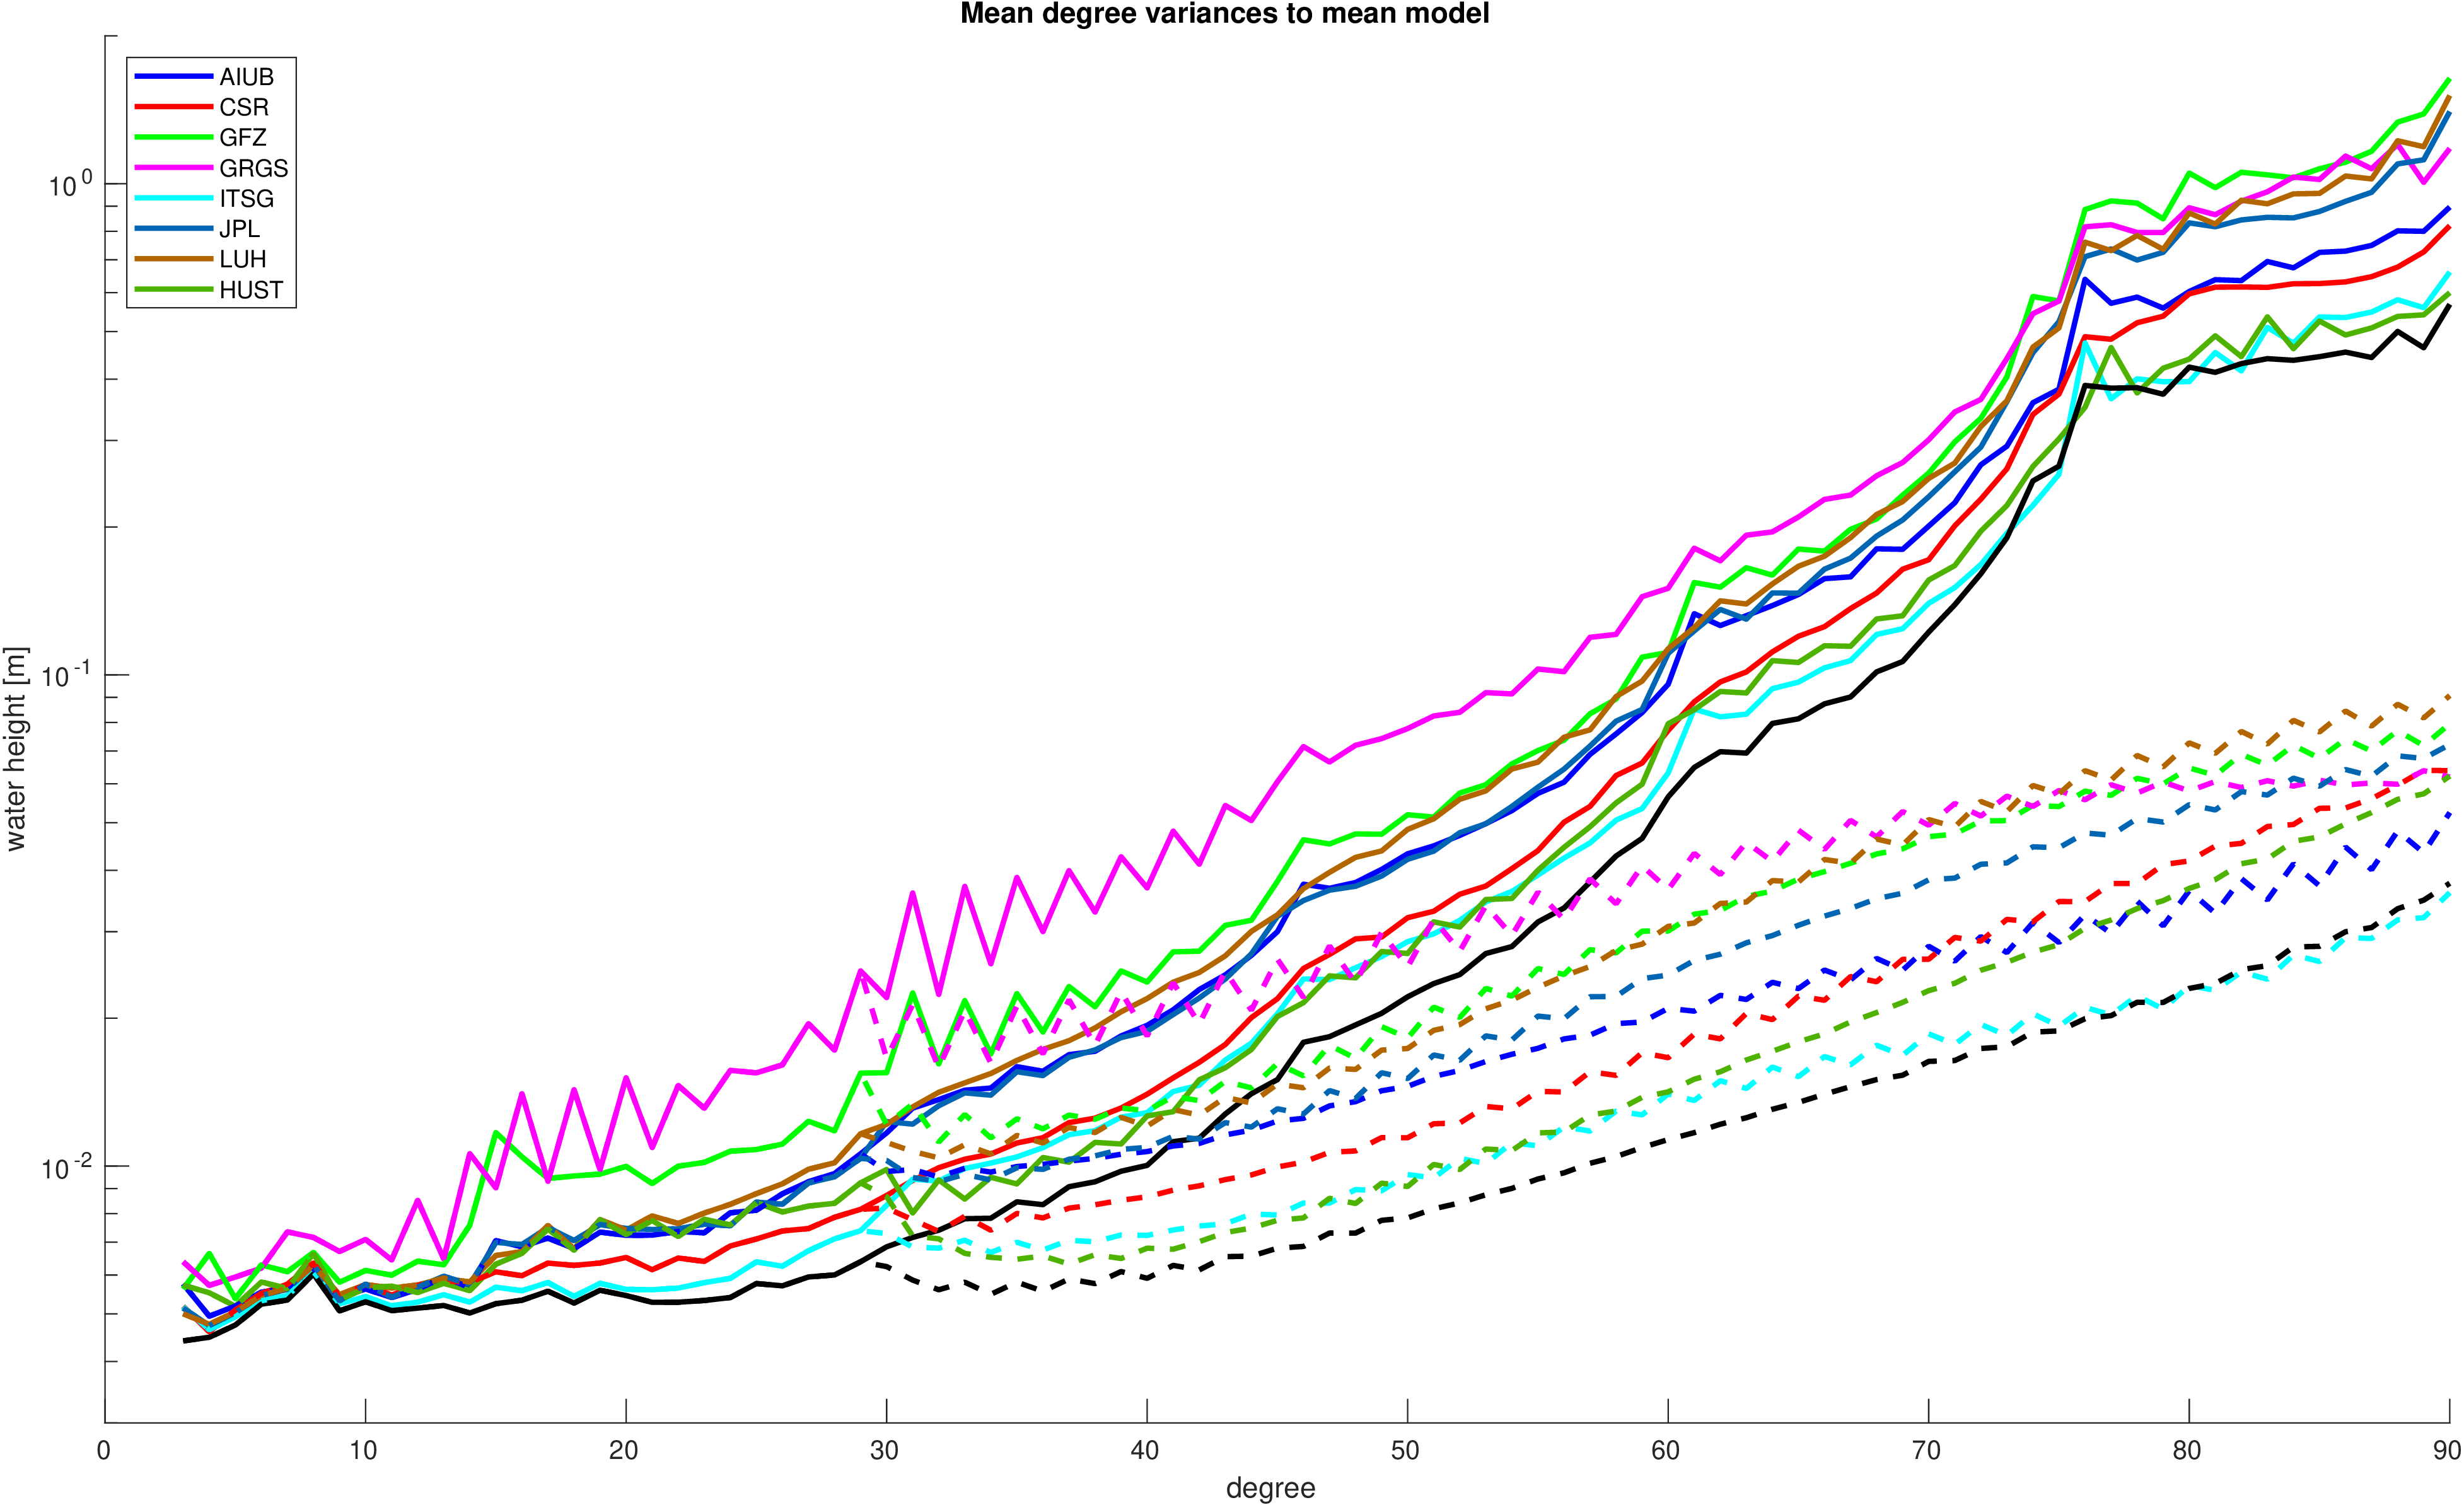
Mean degree variances with respect to a mean signal model. The deterministic signal model including trends, annual and semi-annual variations
has been fitted to all time-series contributing to the combination.
| geoid height |
equivalent water height |
|
|
top
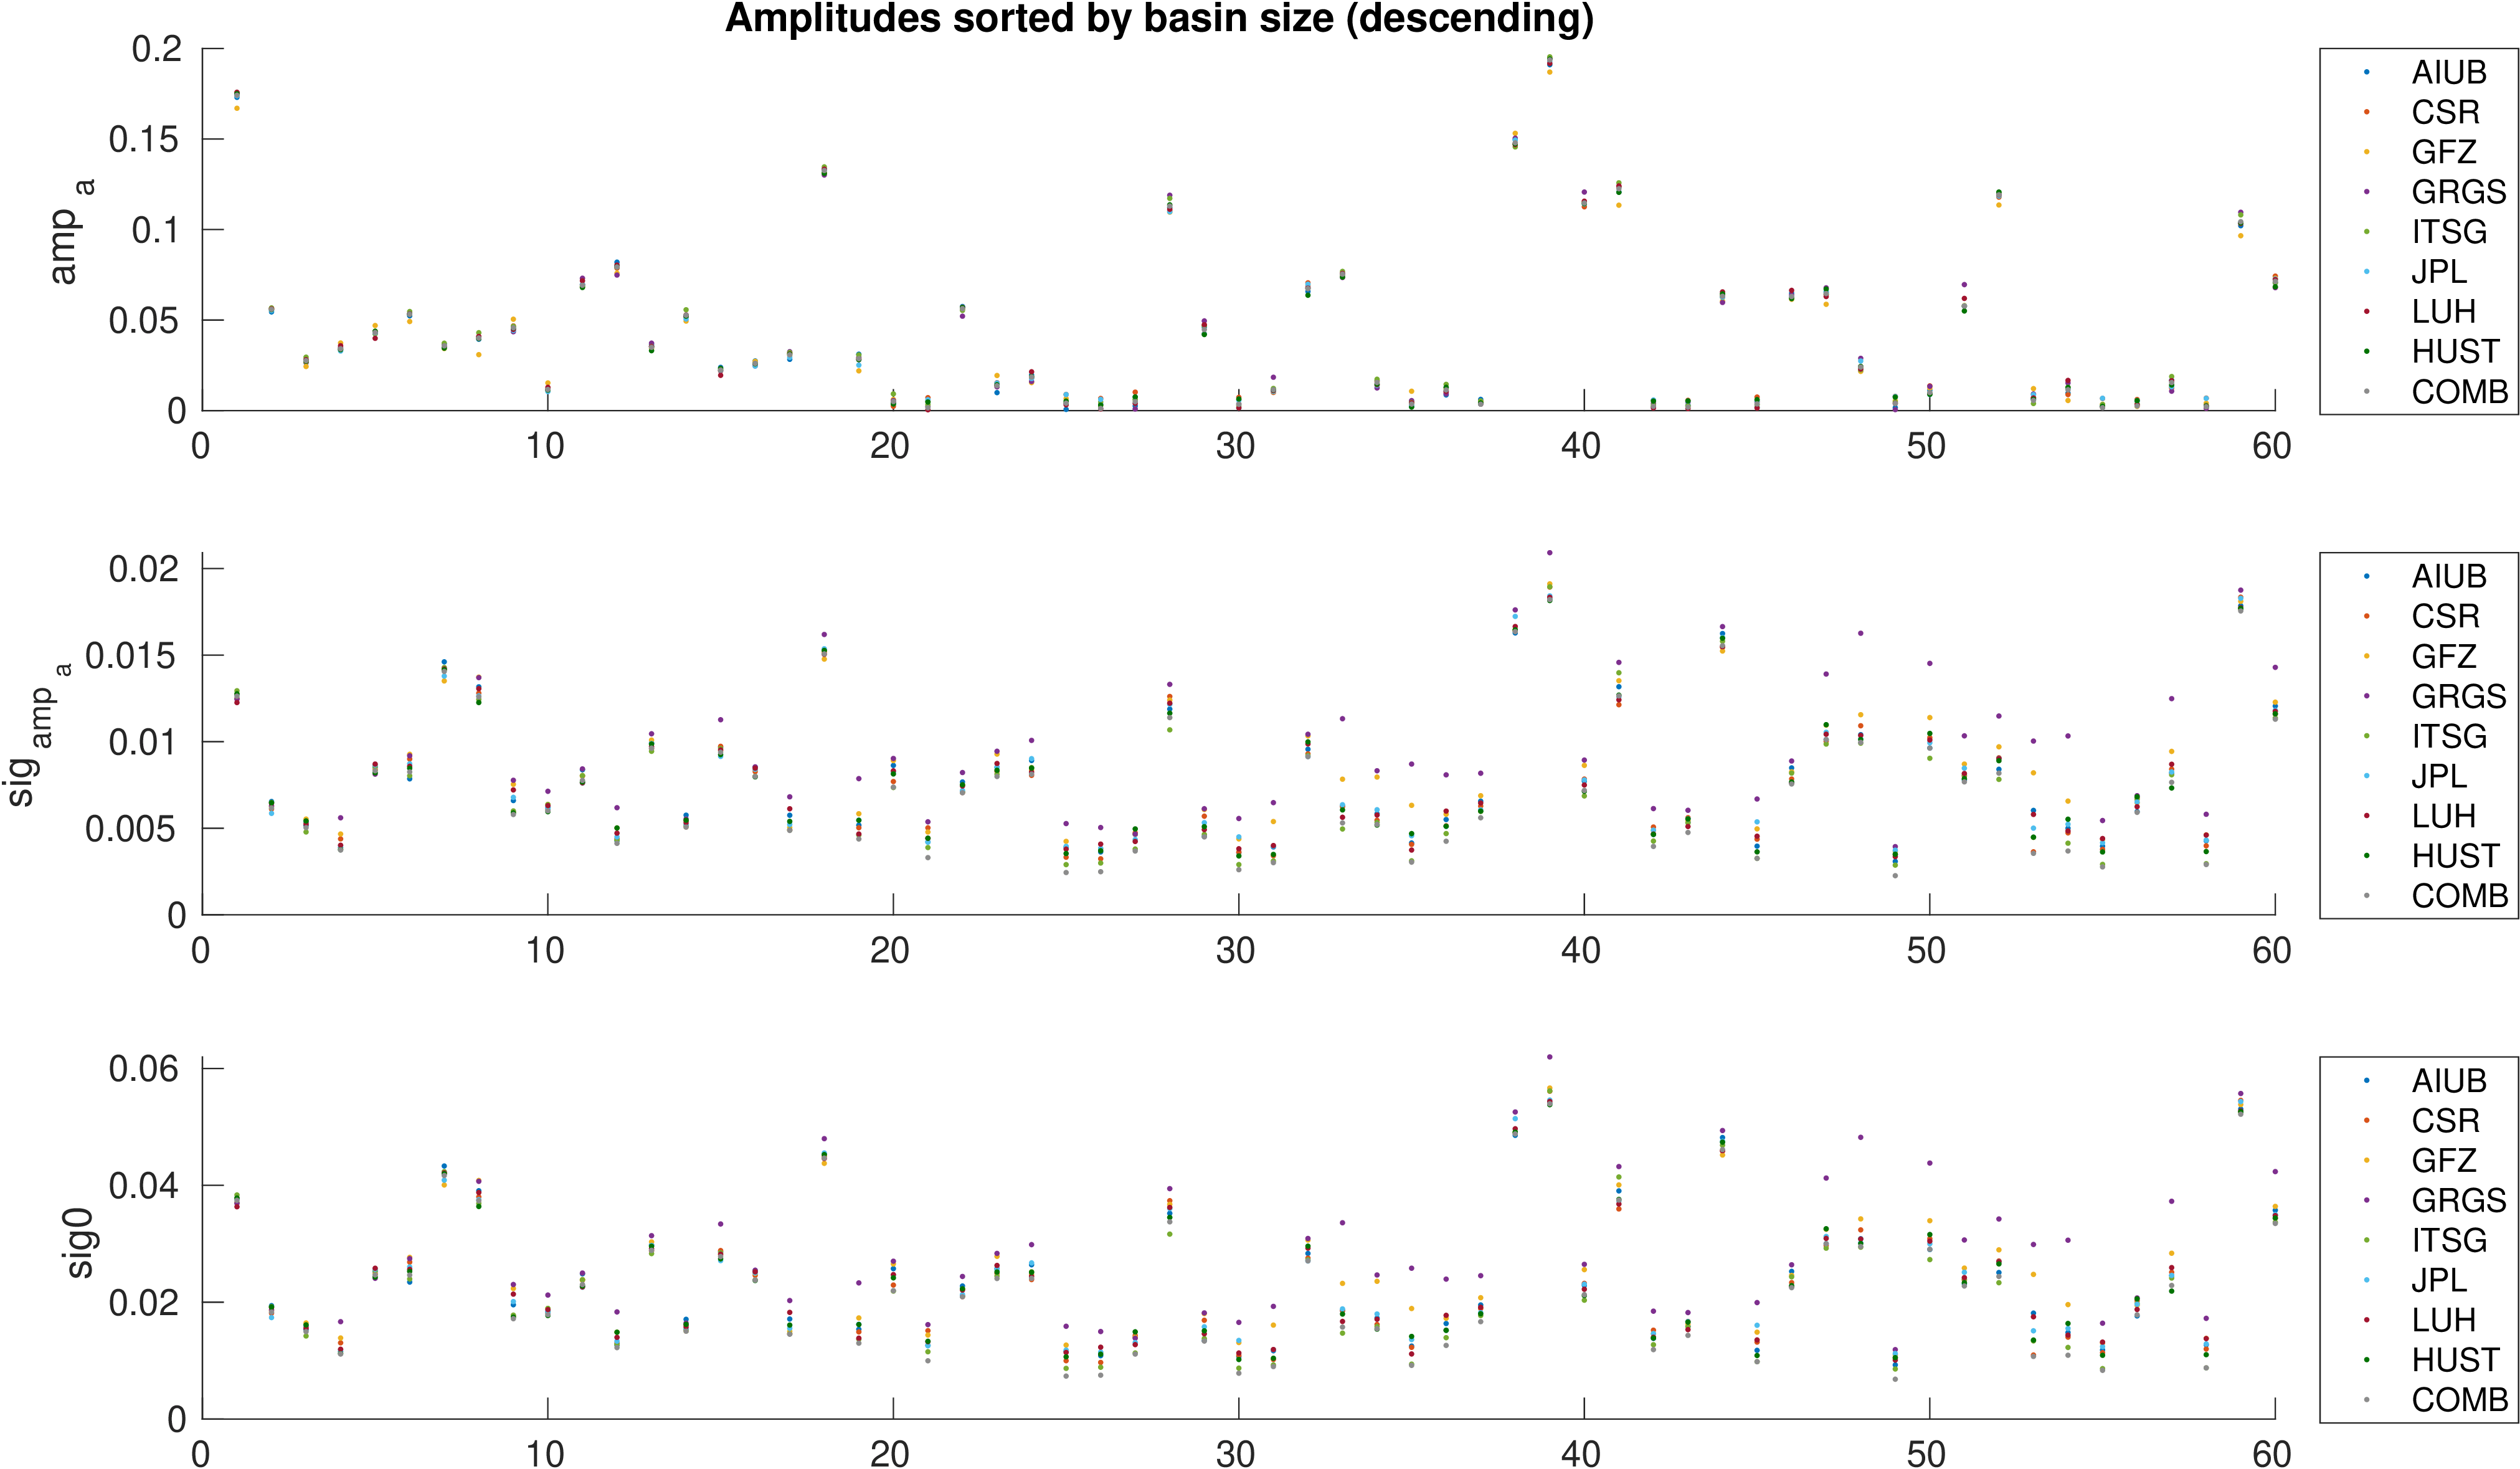
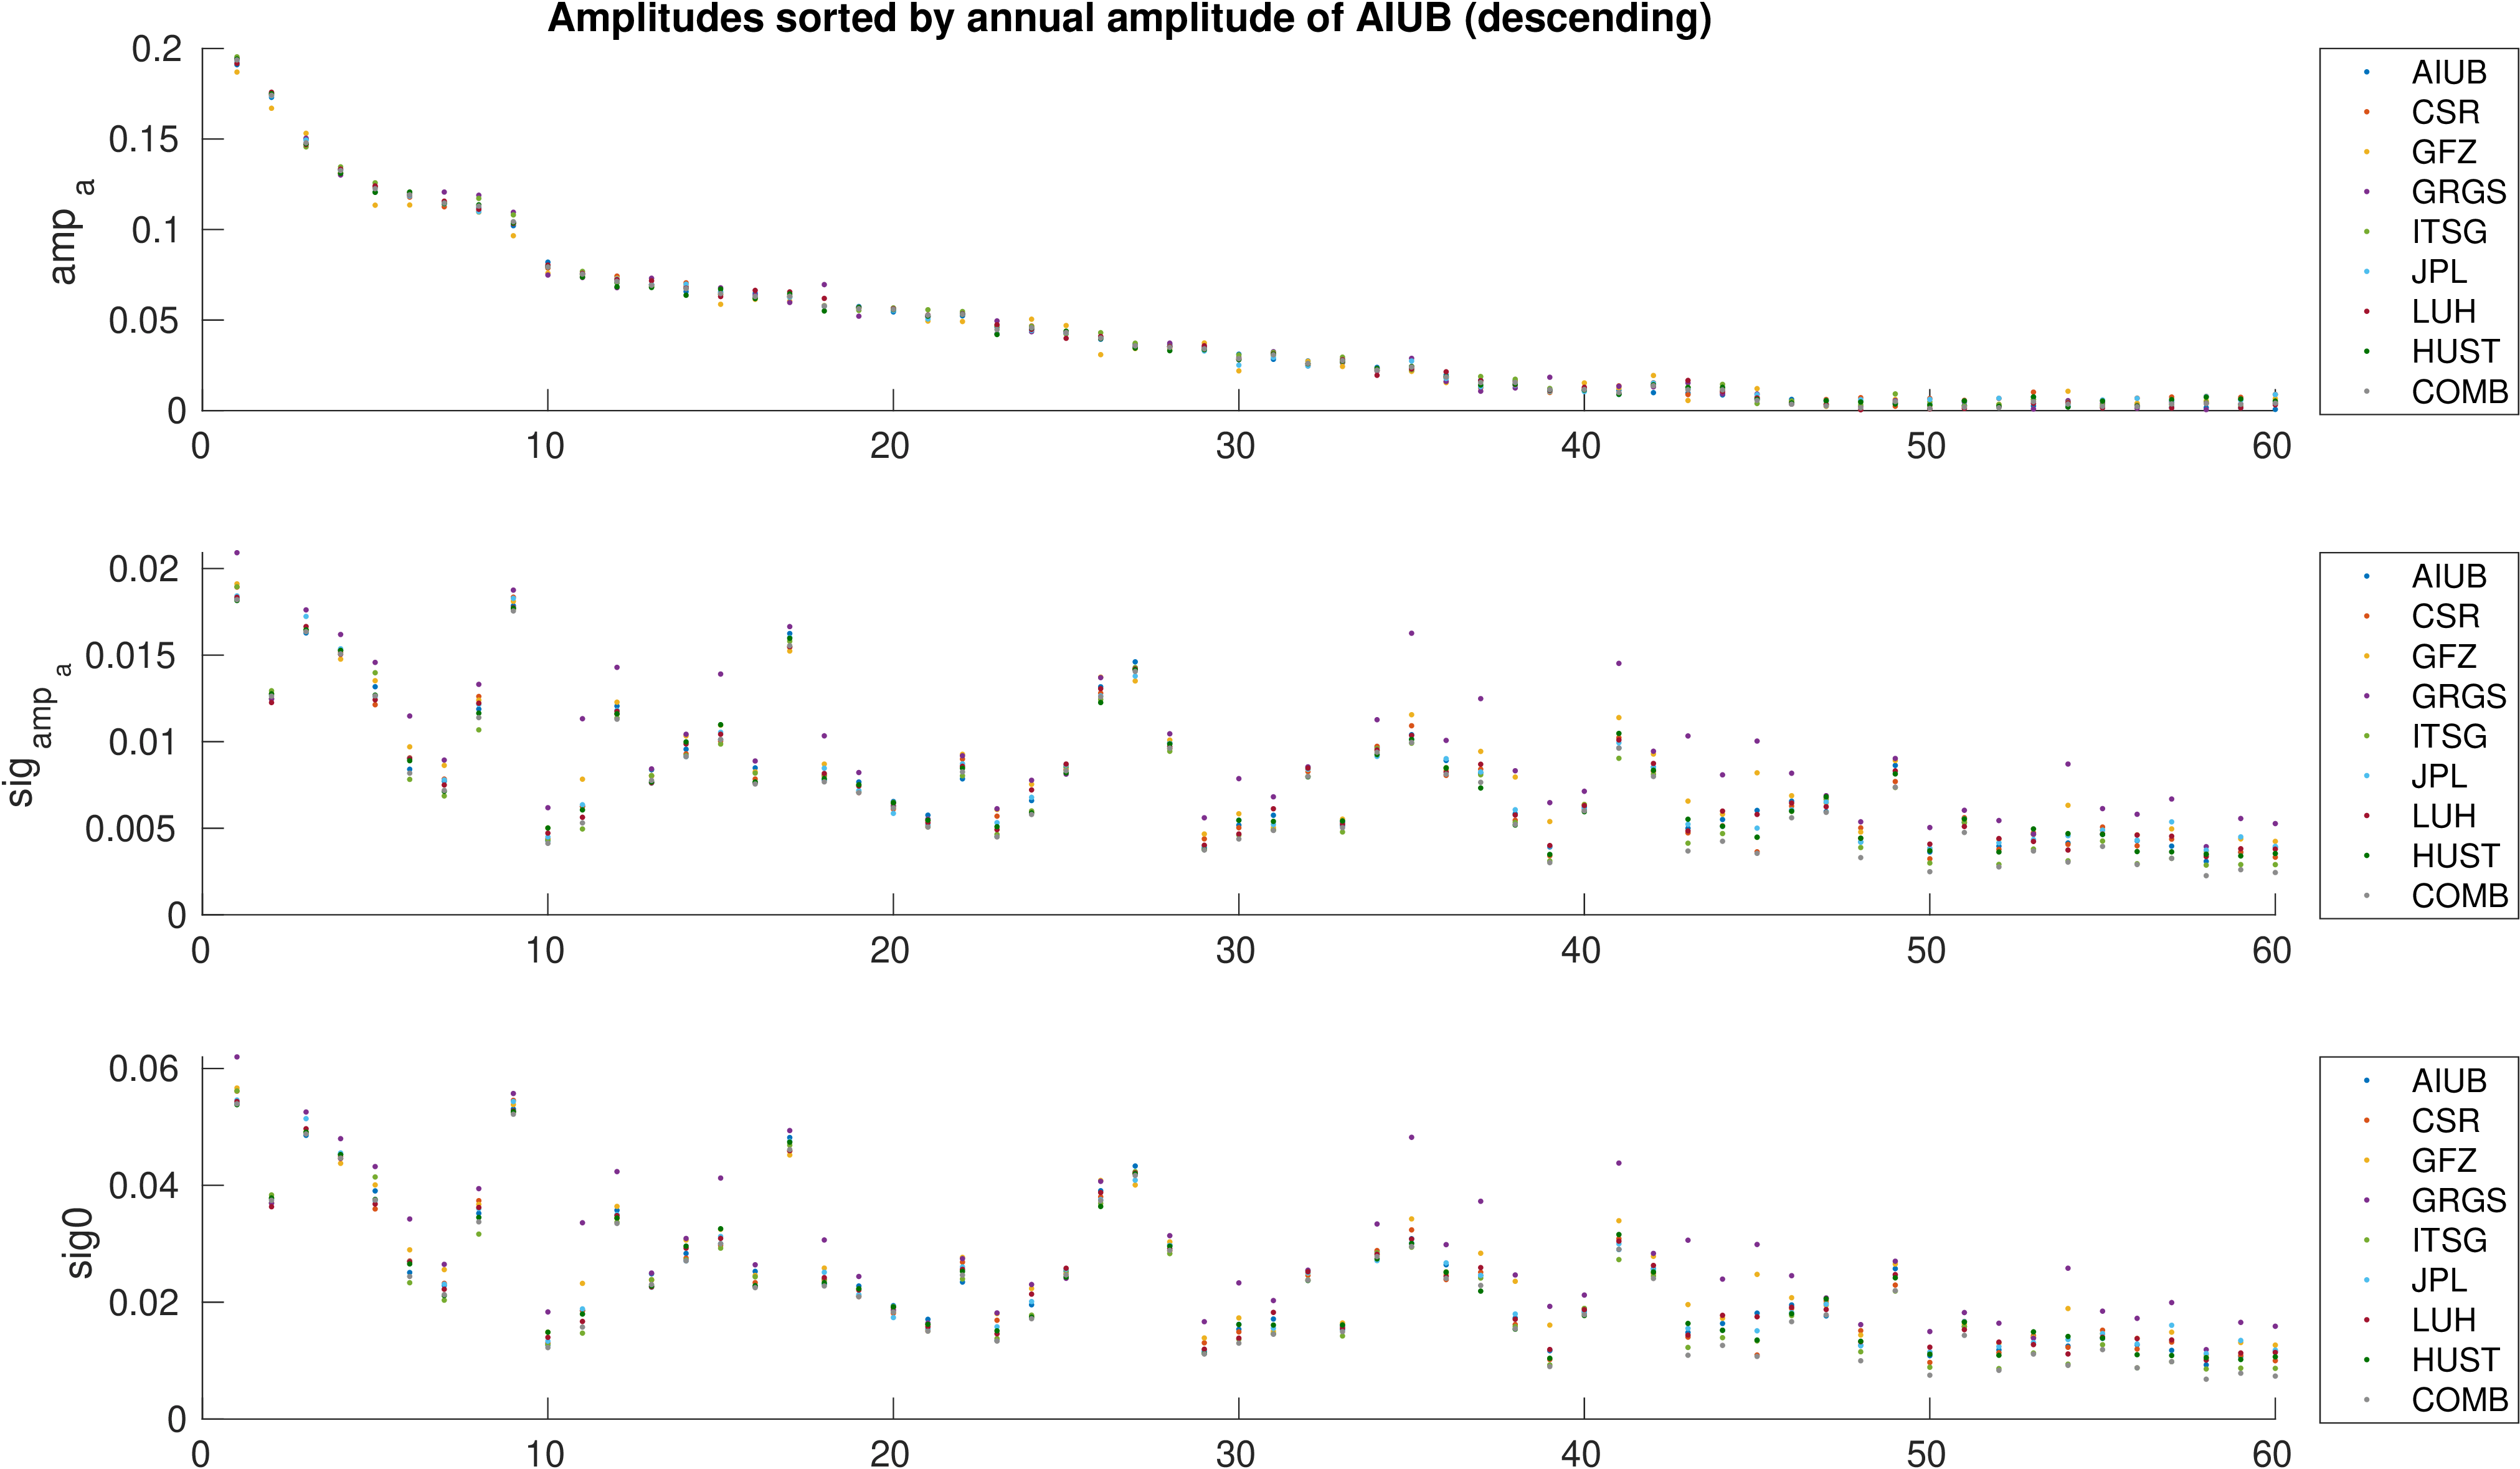
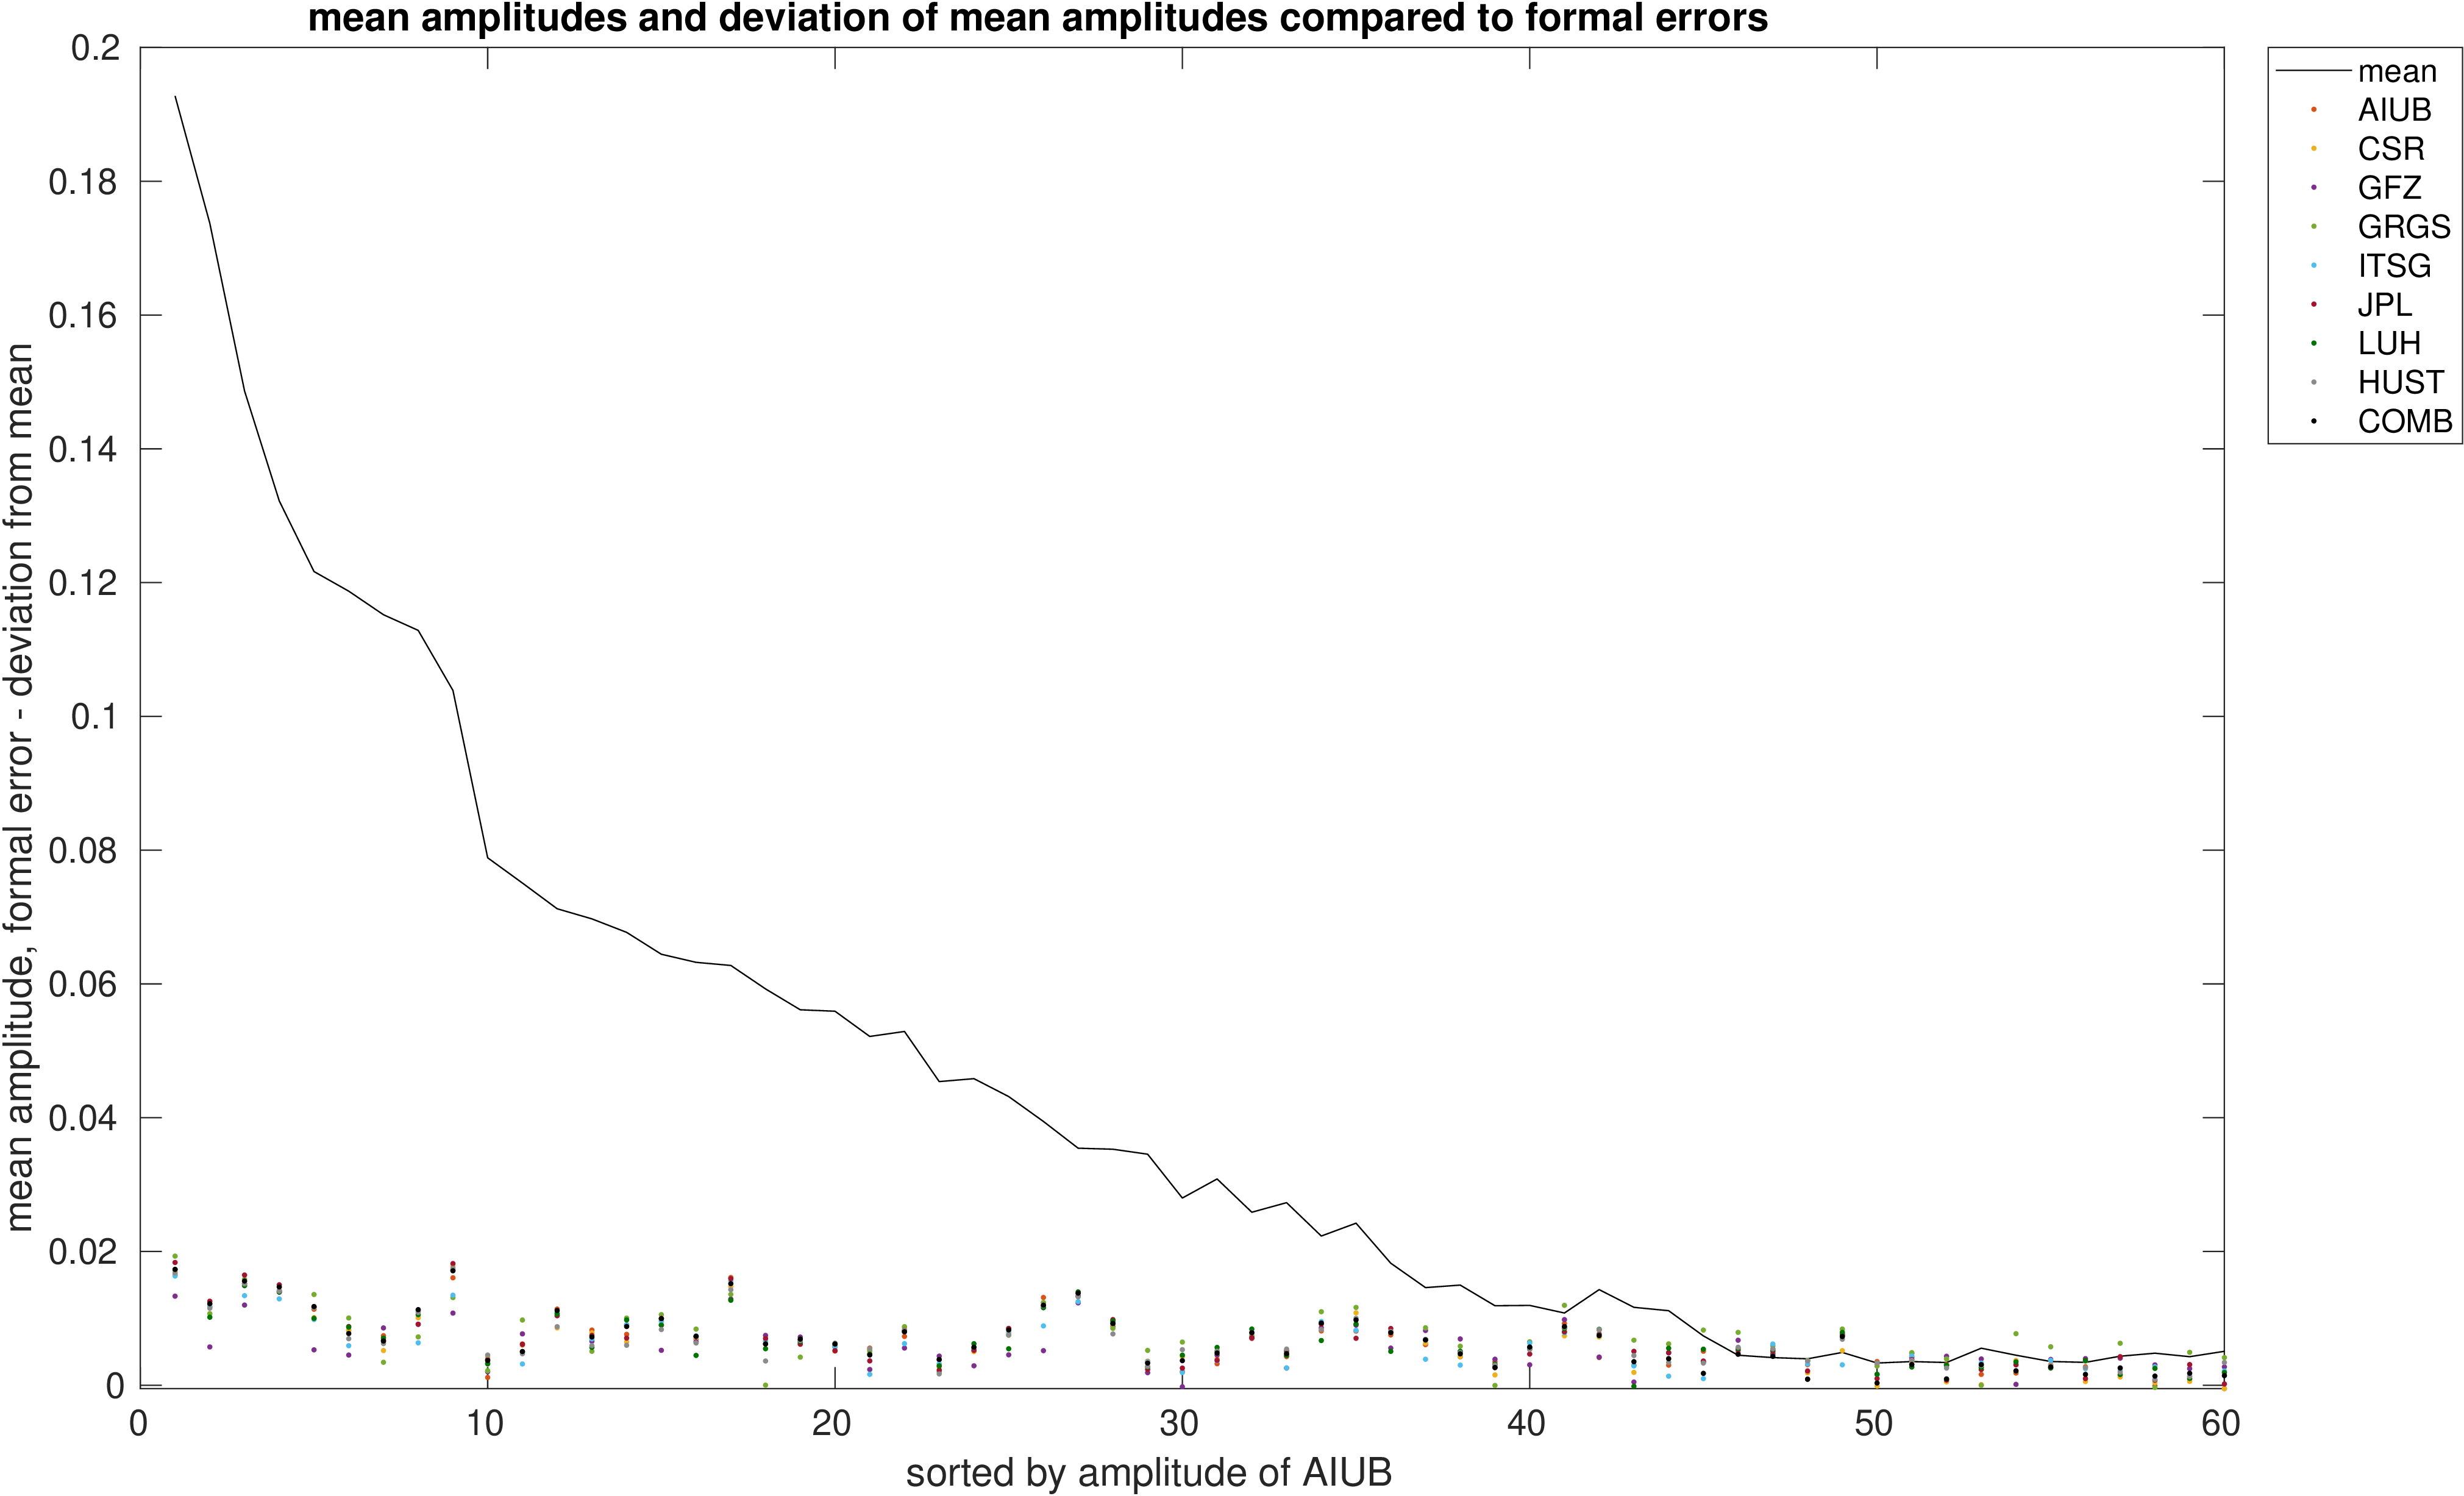
Assessment of hydrological signal content in selected river basins. A deterministic signal model including trends,
annual and semi-annual variations is fitted to the mean equivalent water height within the basin. All monthly gravity fields
were filtered with 400 km Gauss filter.
Comparison of estimated amplitudes of annual variations in 60 major river basins.
The formal errors of the trend estimates and the overall fit of the signal models are also provided.
Finaly the differences between the formal errors and the deviations from the mean amplitude per basin are determined to assess the
significance of the deviations.
| sorted by basin size |
sorted by annual amplitude |
assessment of significance |
|
|
|
top
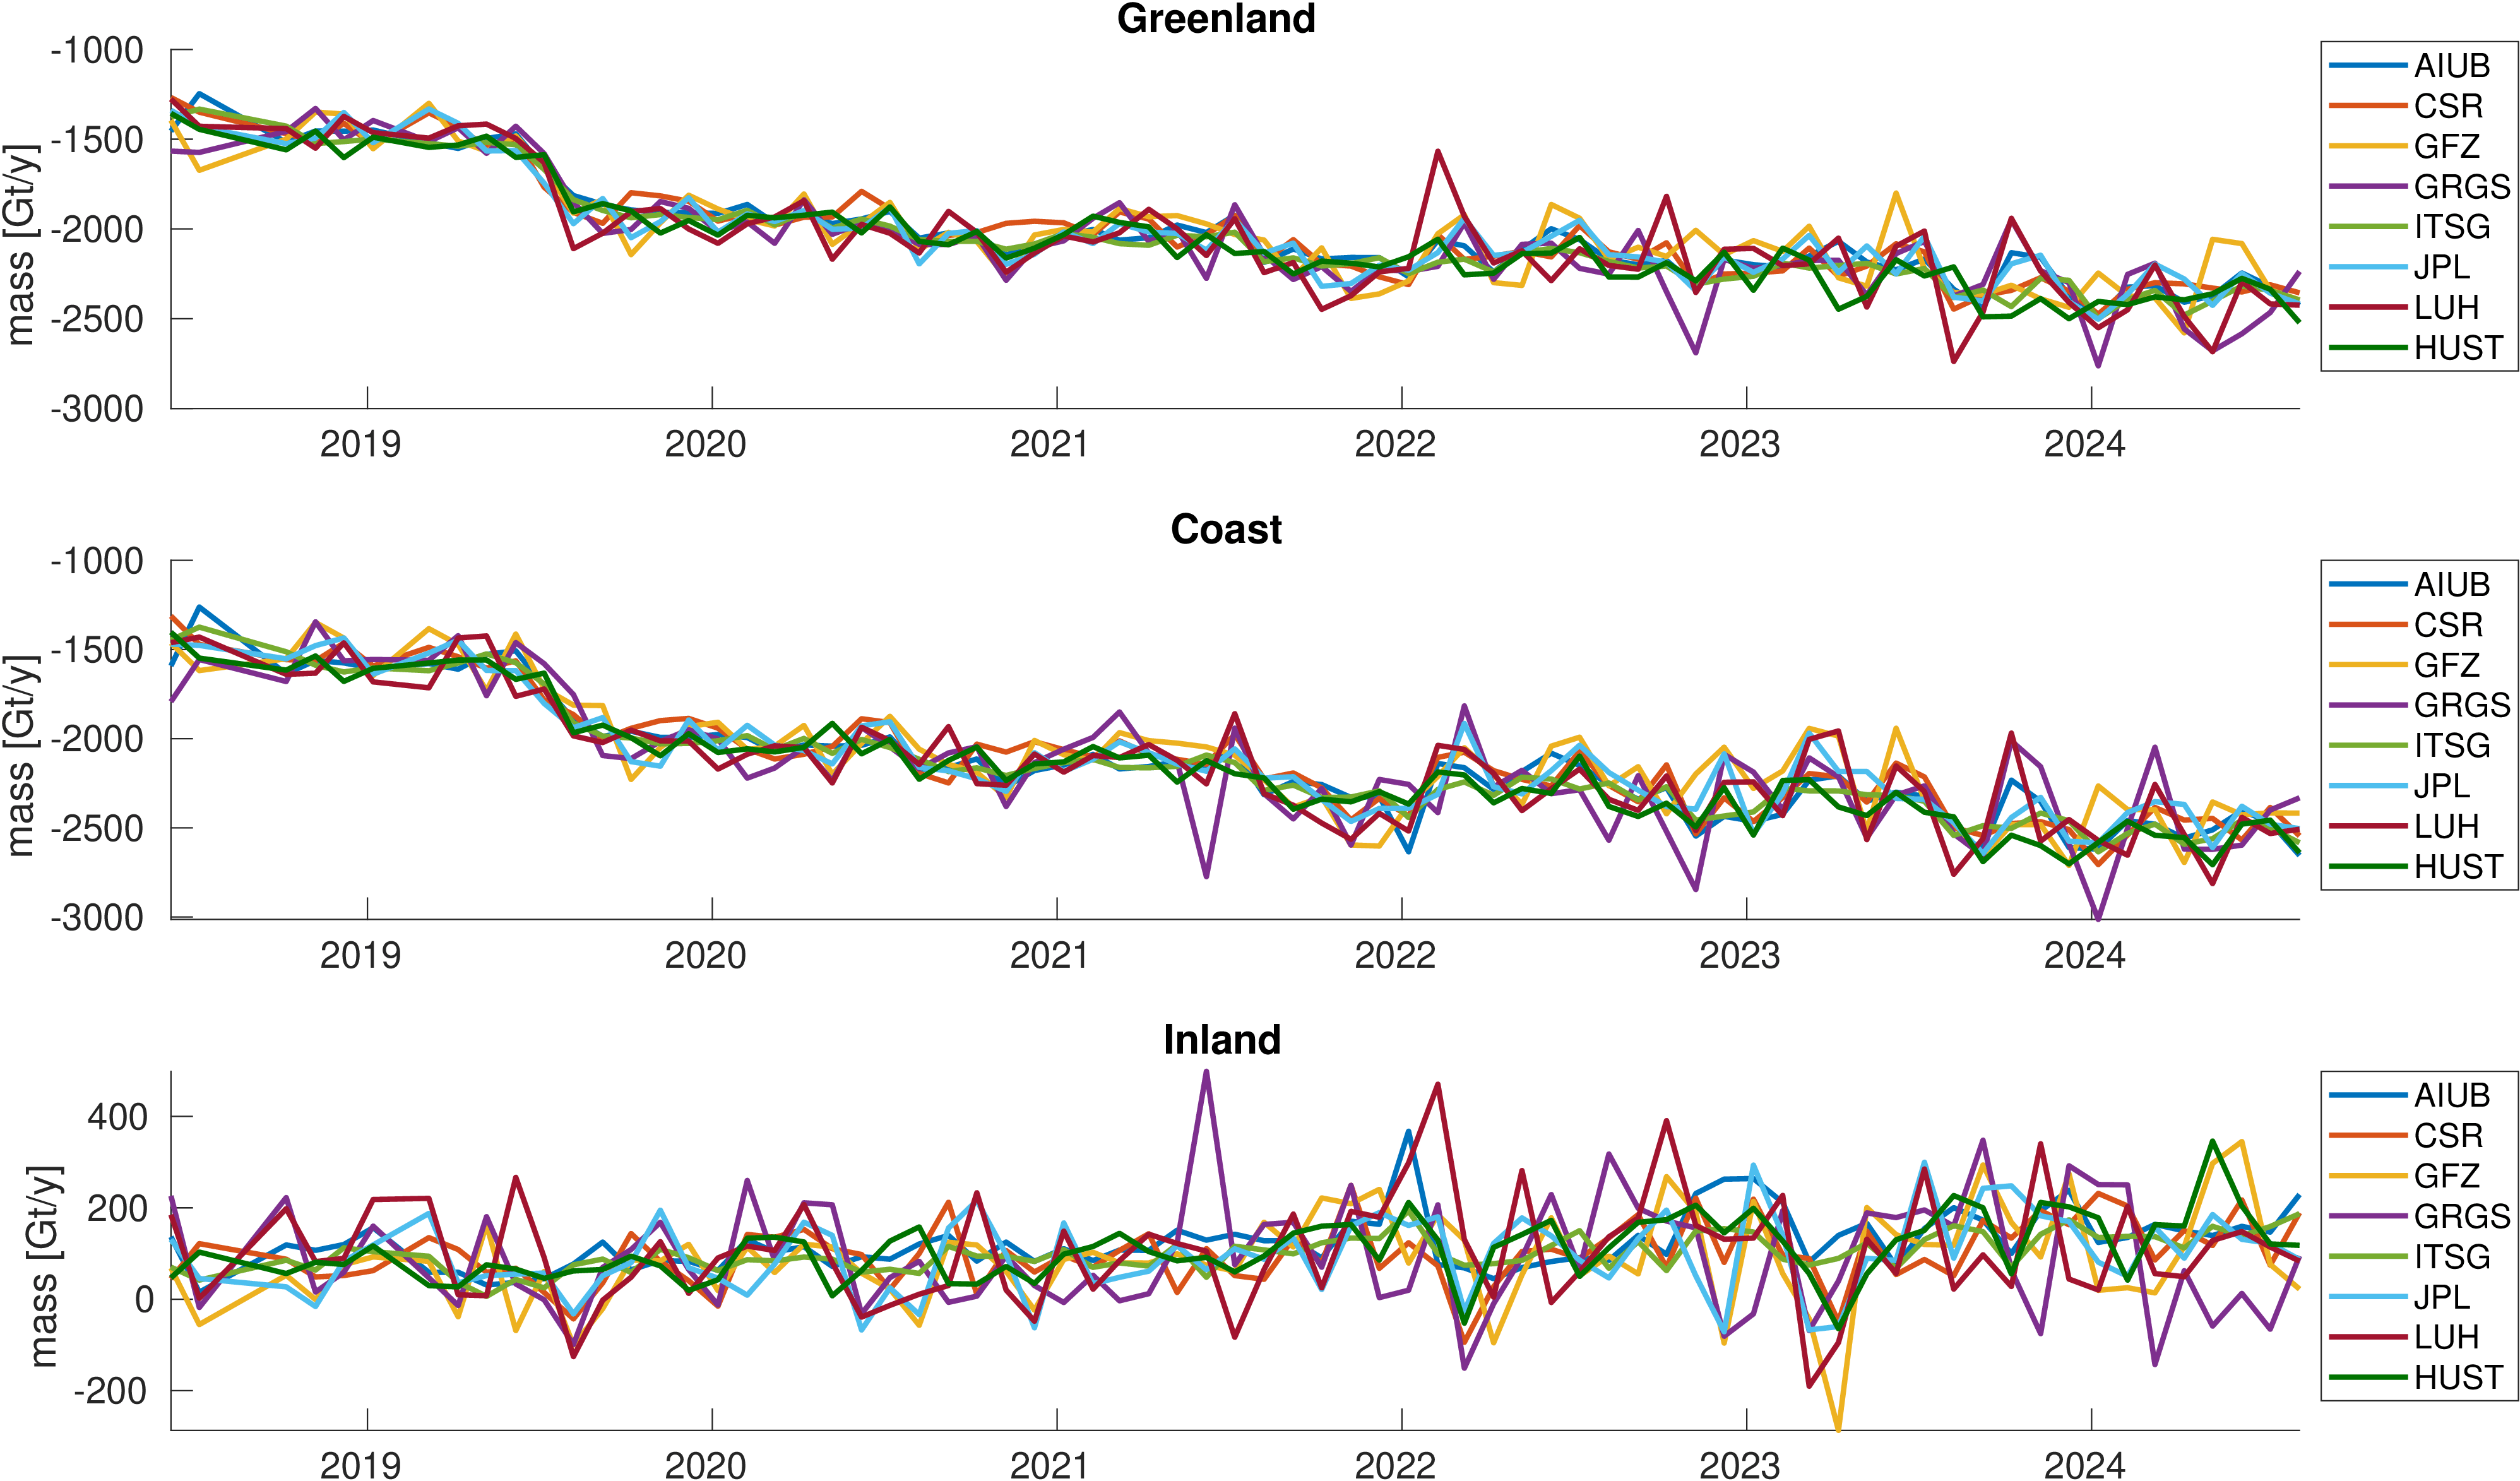
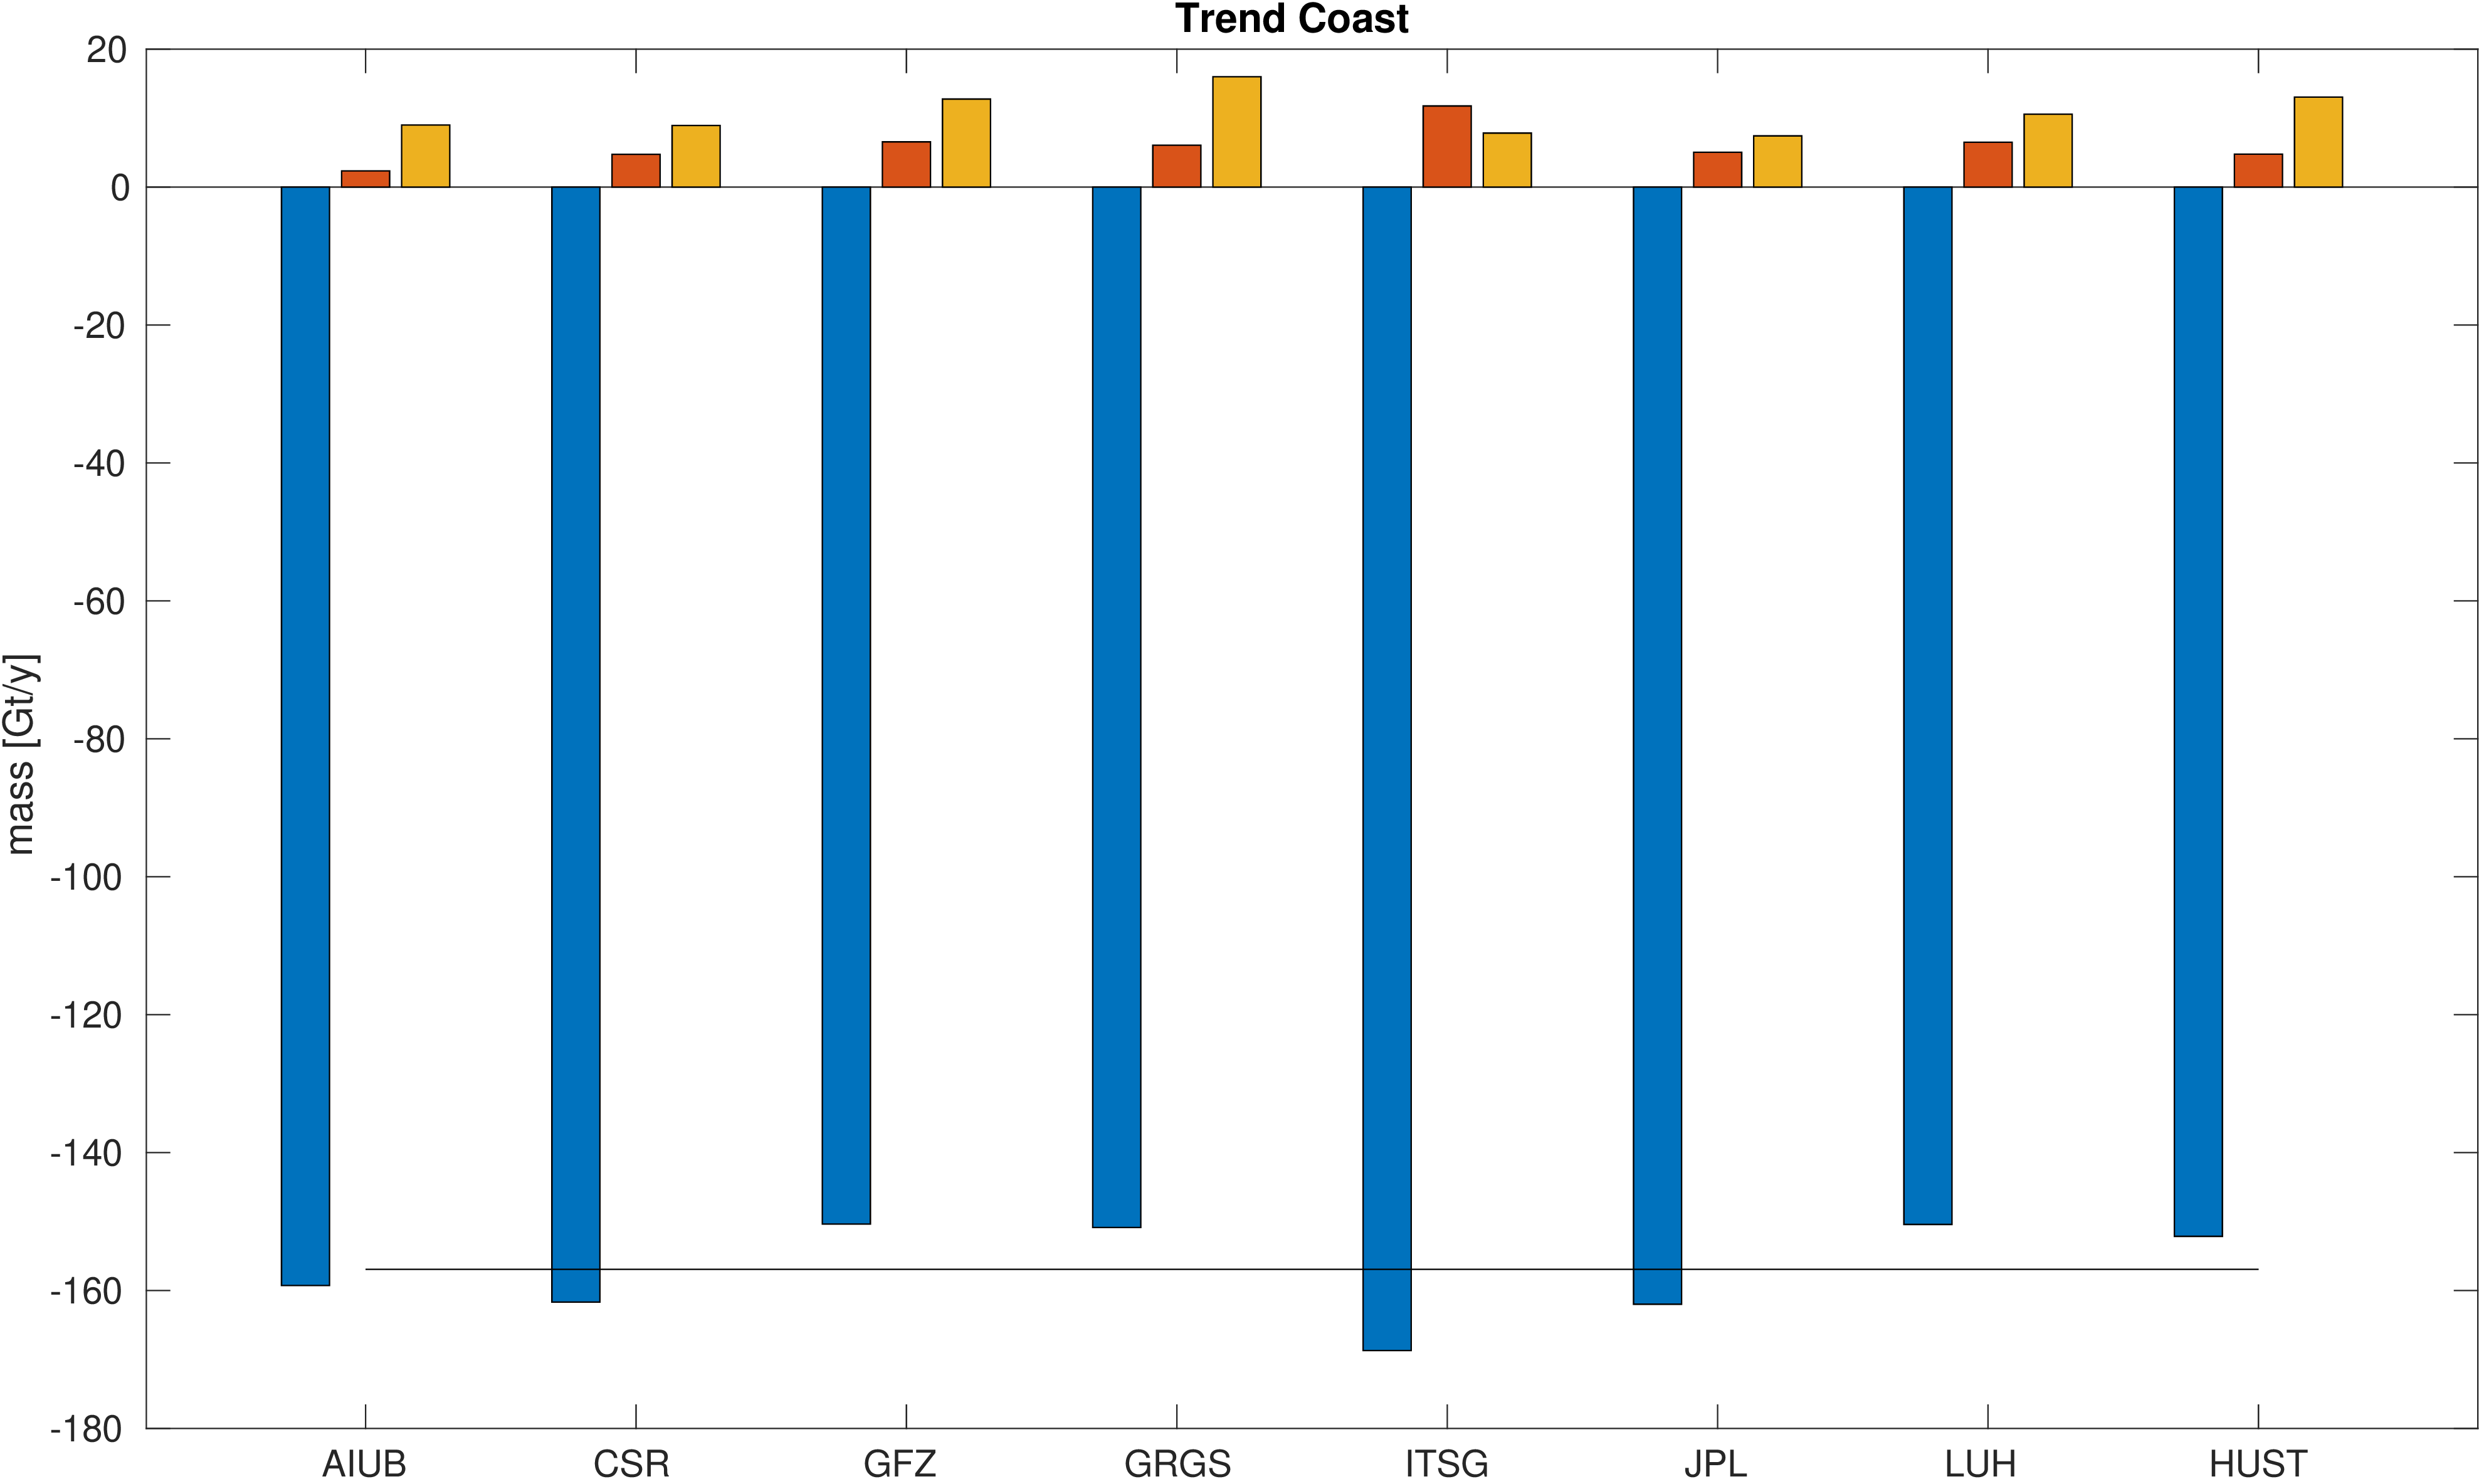
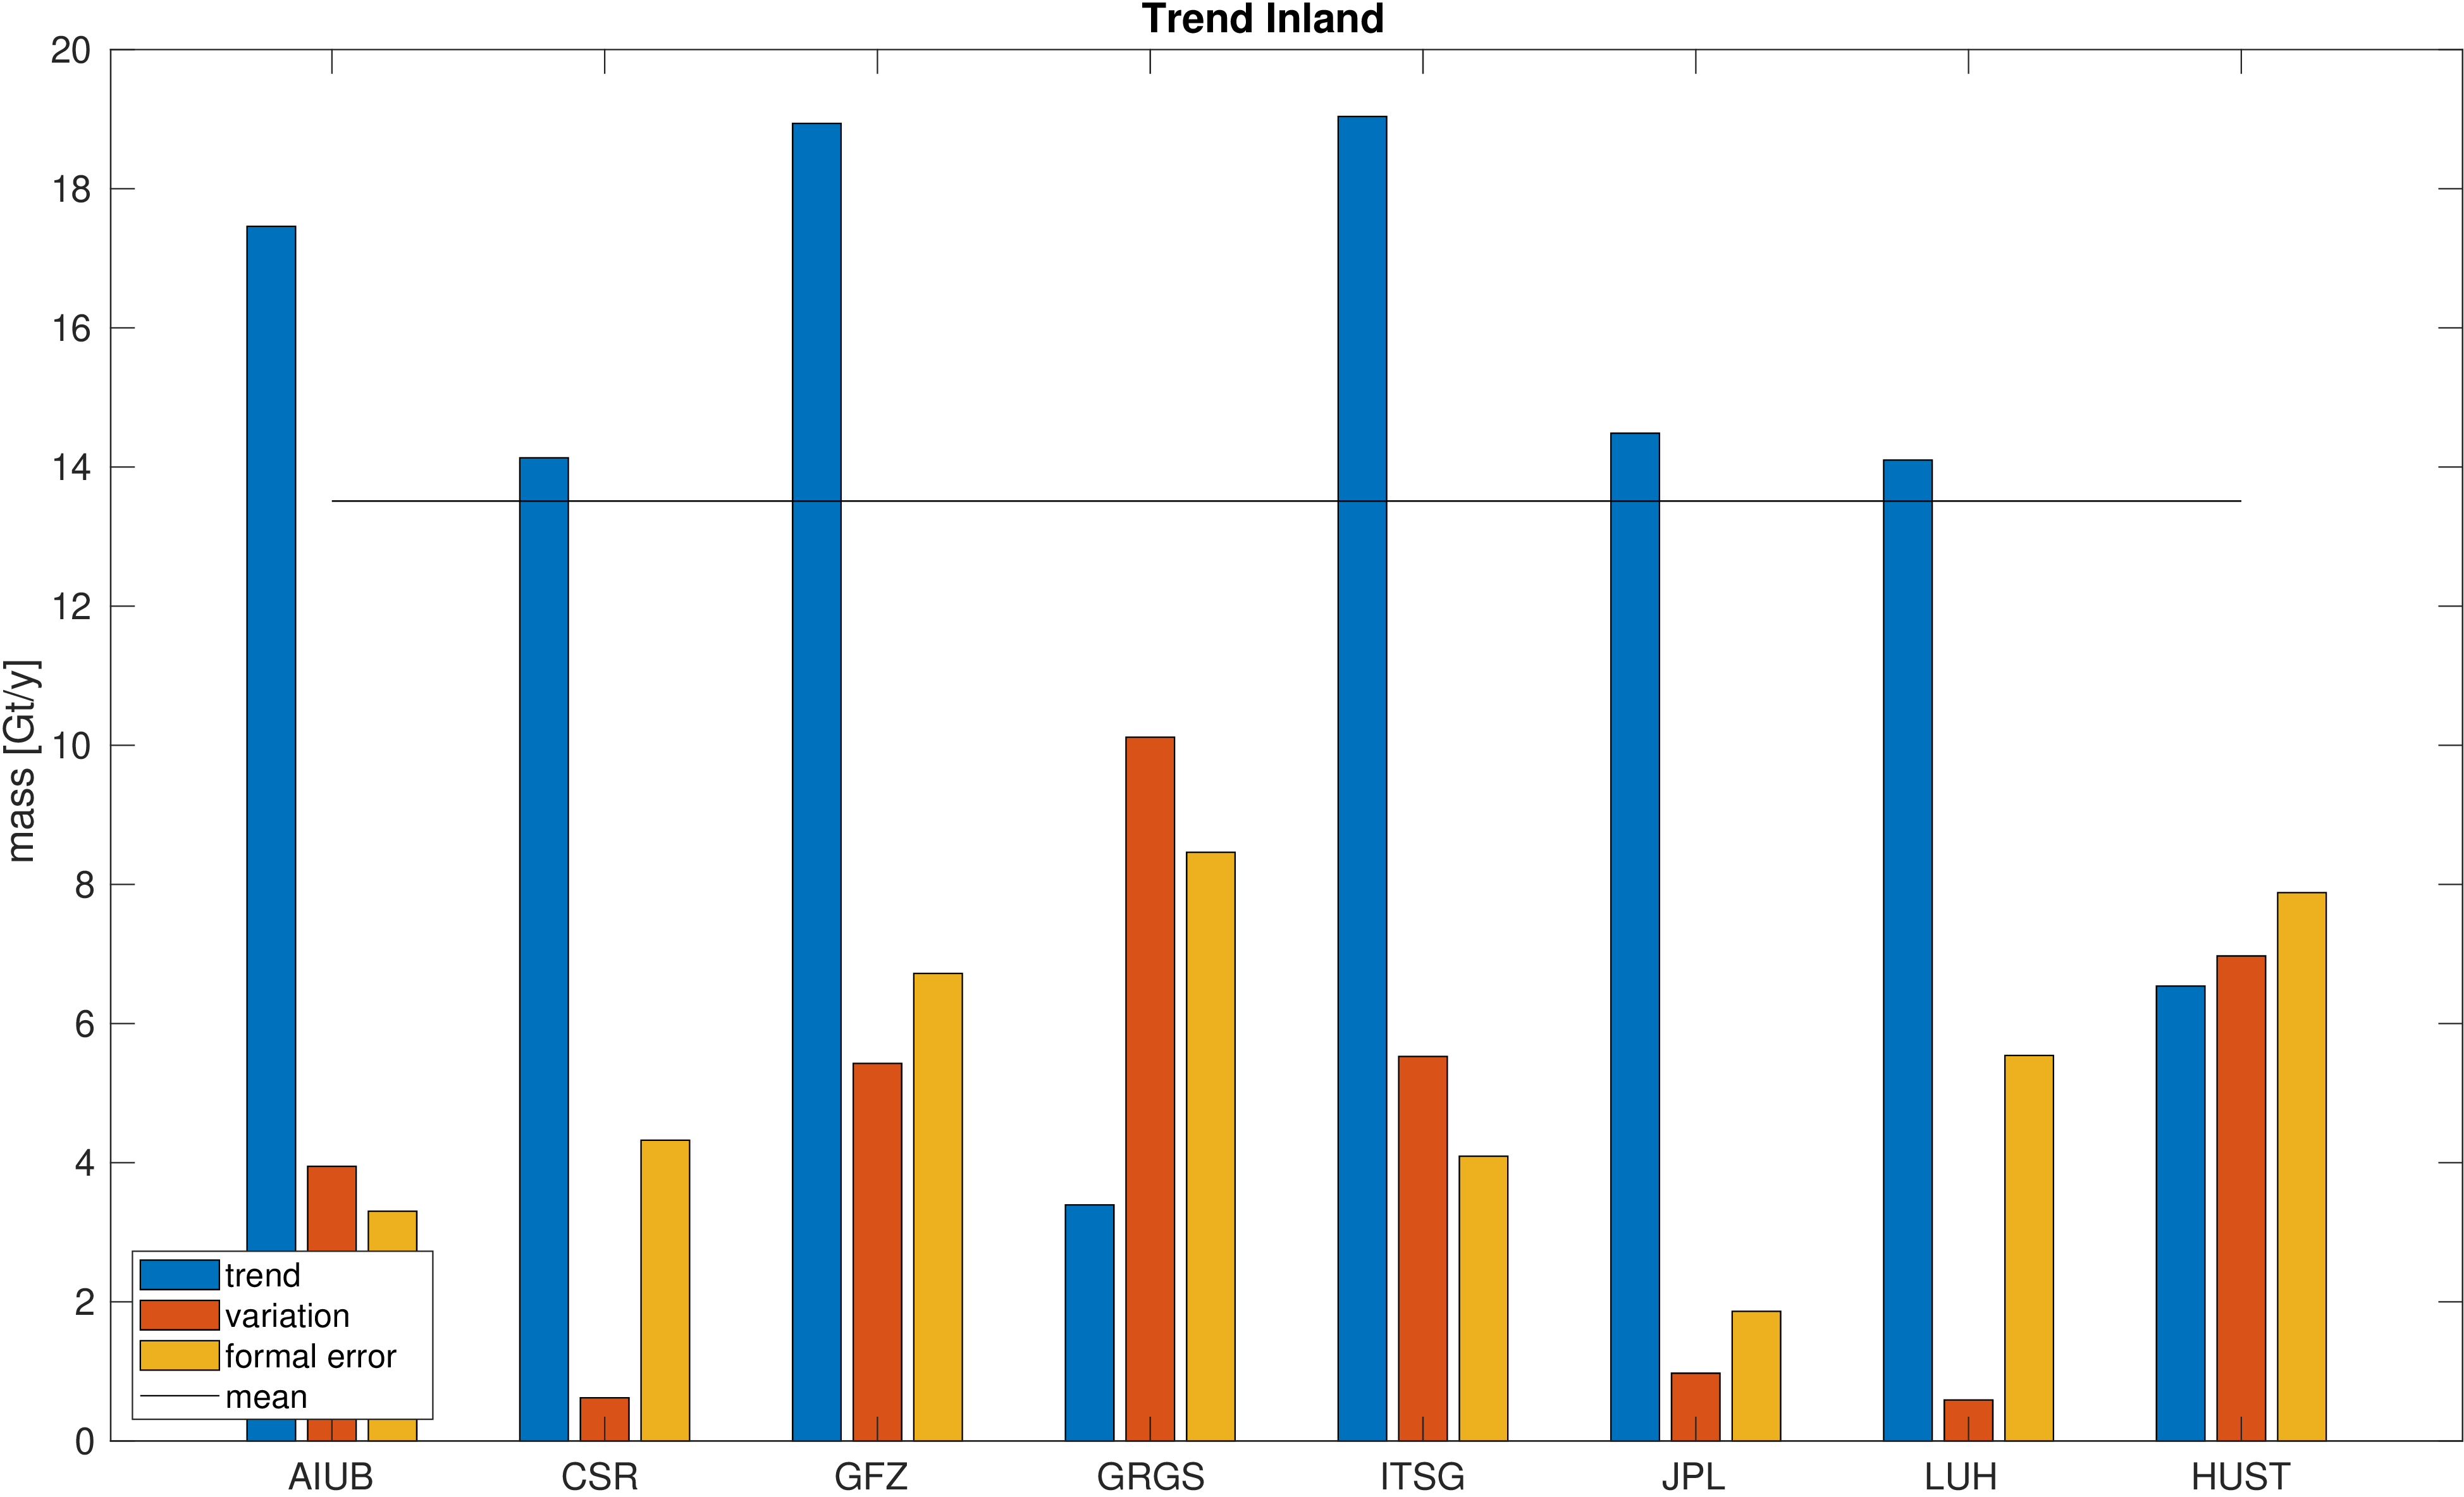
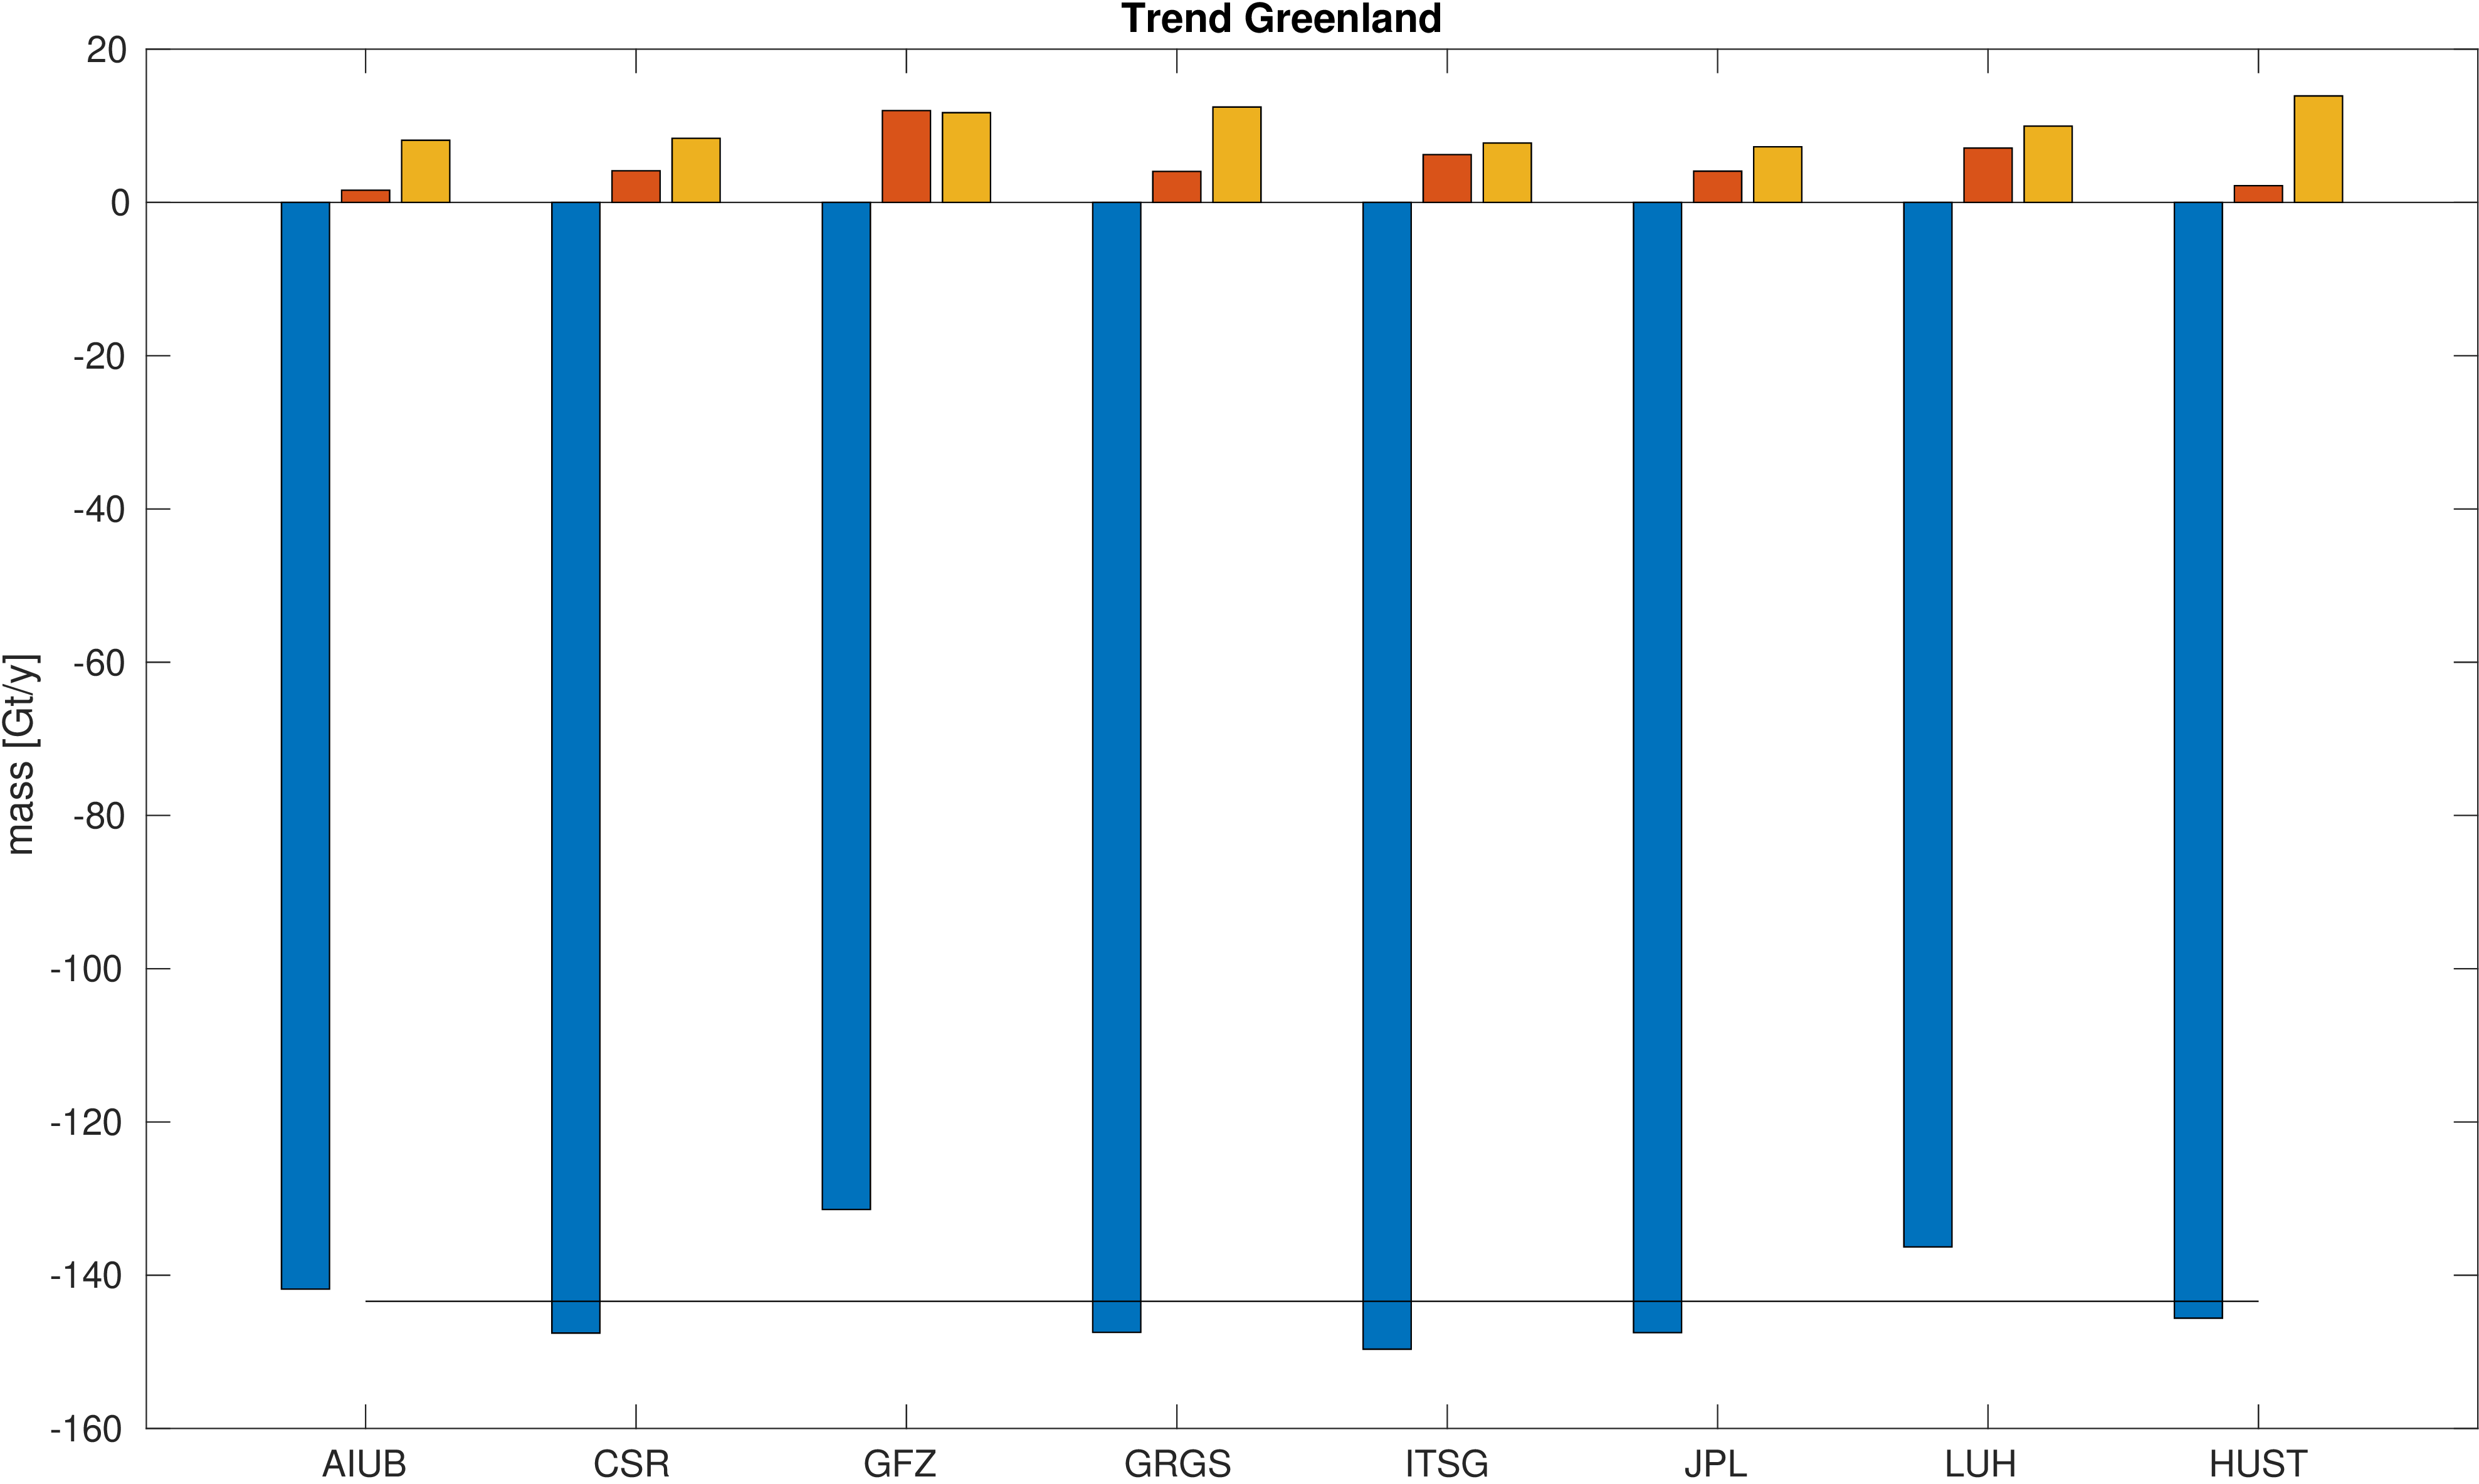
Assessment of ice mass change along the coast and on the inland ice sheet of Greenland.
Mass is derived from mean equivalent water height within the regions. A deterministic signal model including linear trend,
annual and semi-annual variations is fitted to the mass changes within the regions.
No filter was applied to avoid leakage caused by the filter. The mean trend value is indicated by a black line.
Differences with respect to the mean trend and formal errors of the estimated trends are also given to assess the significance of the differences.
| Mass trends |
Coast |
Inland |
Greenland |
|
|
|
|
top
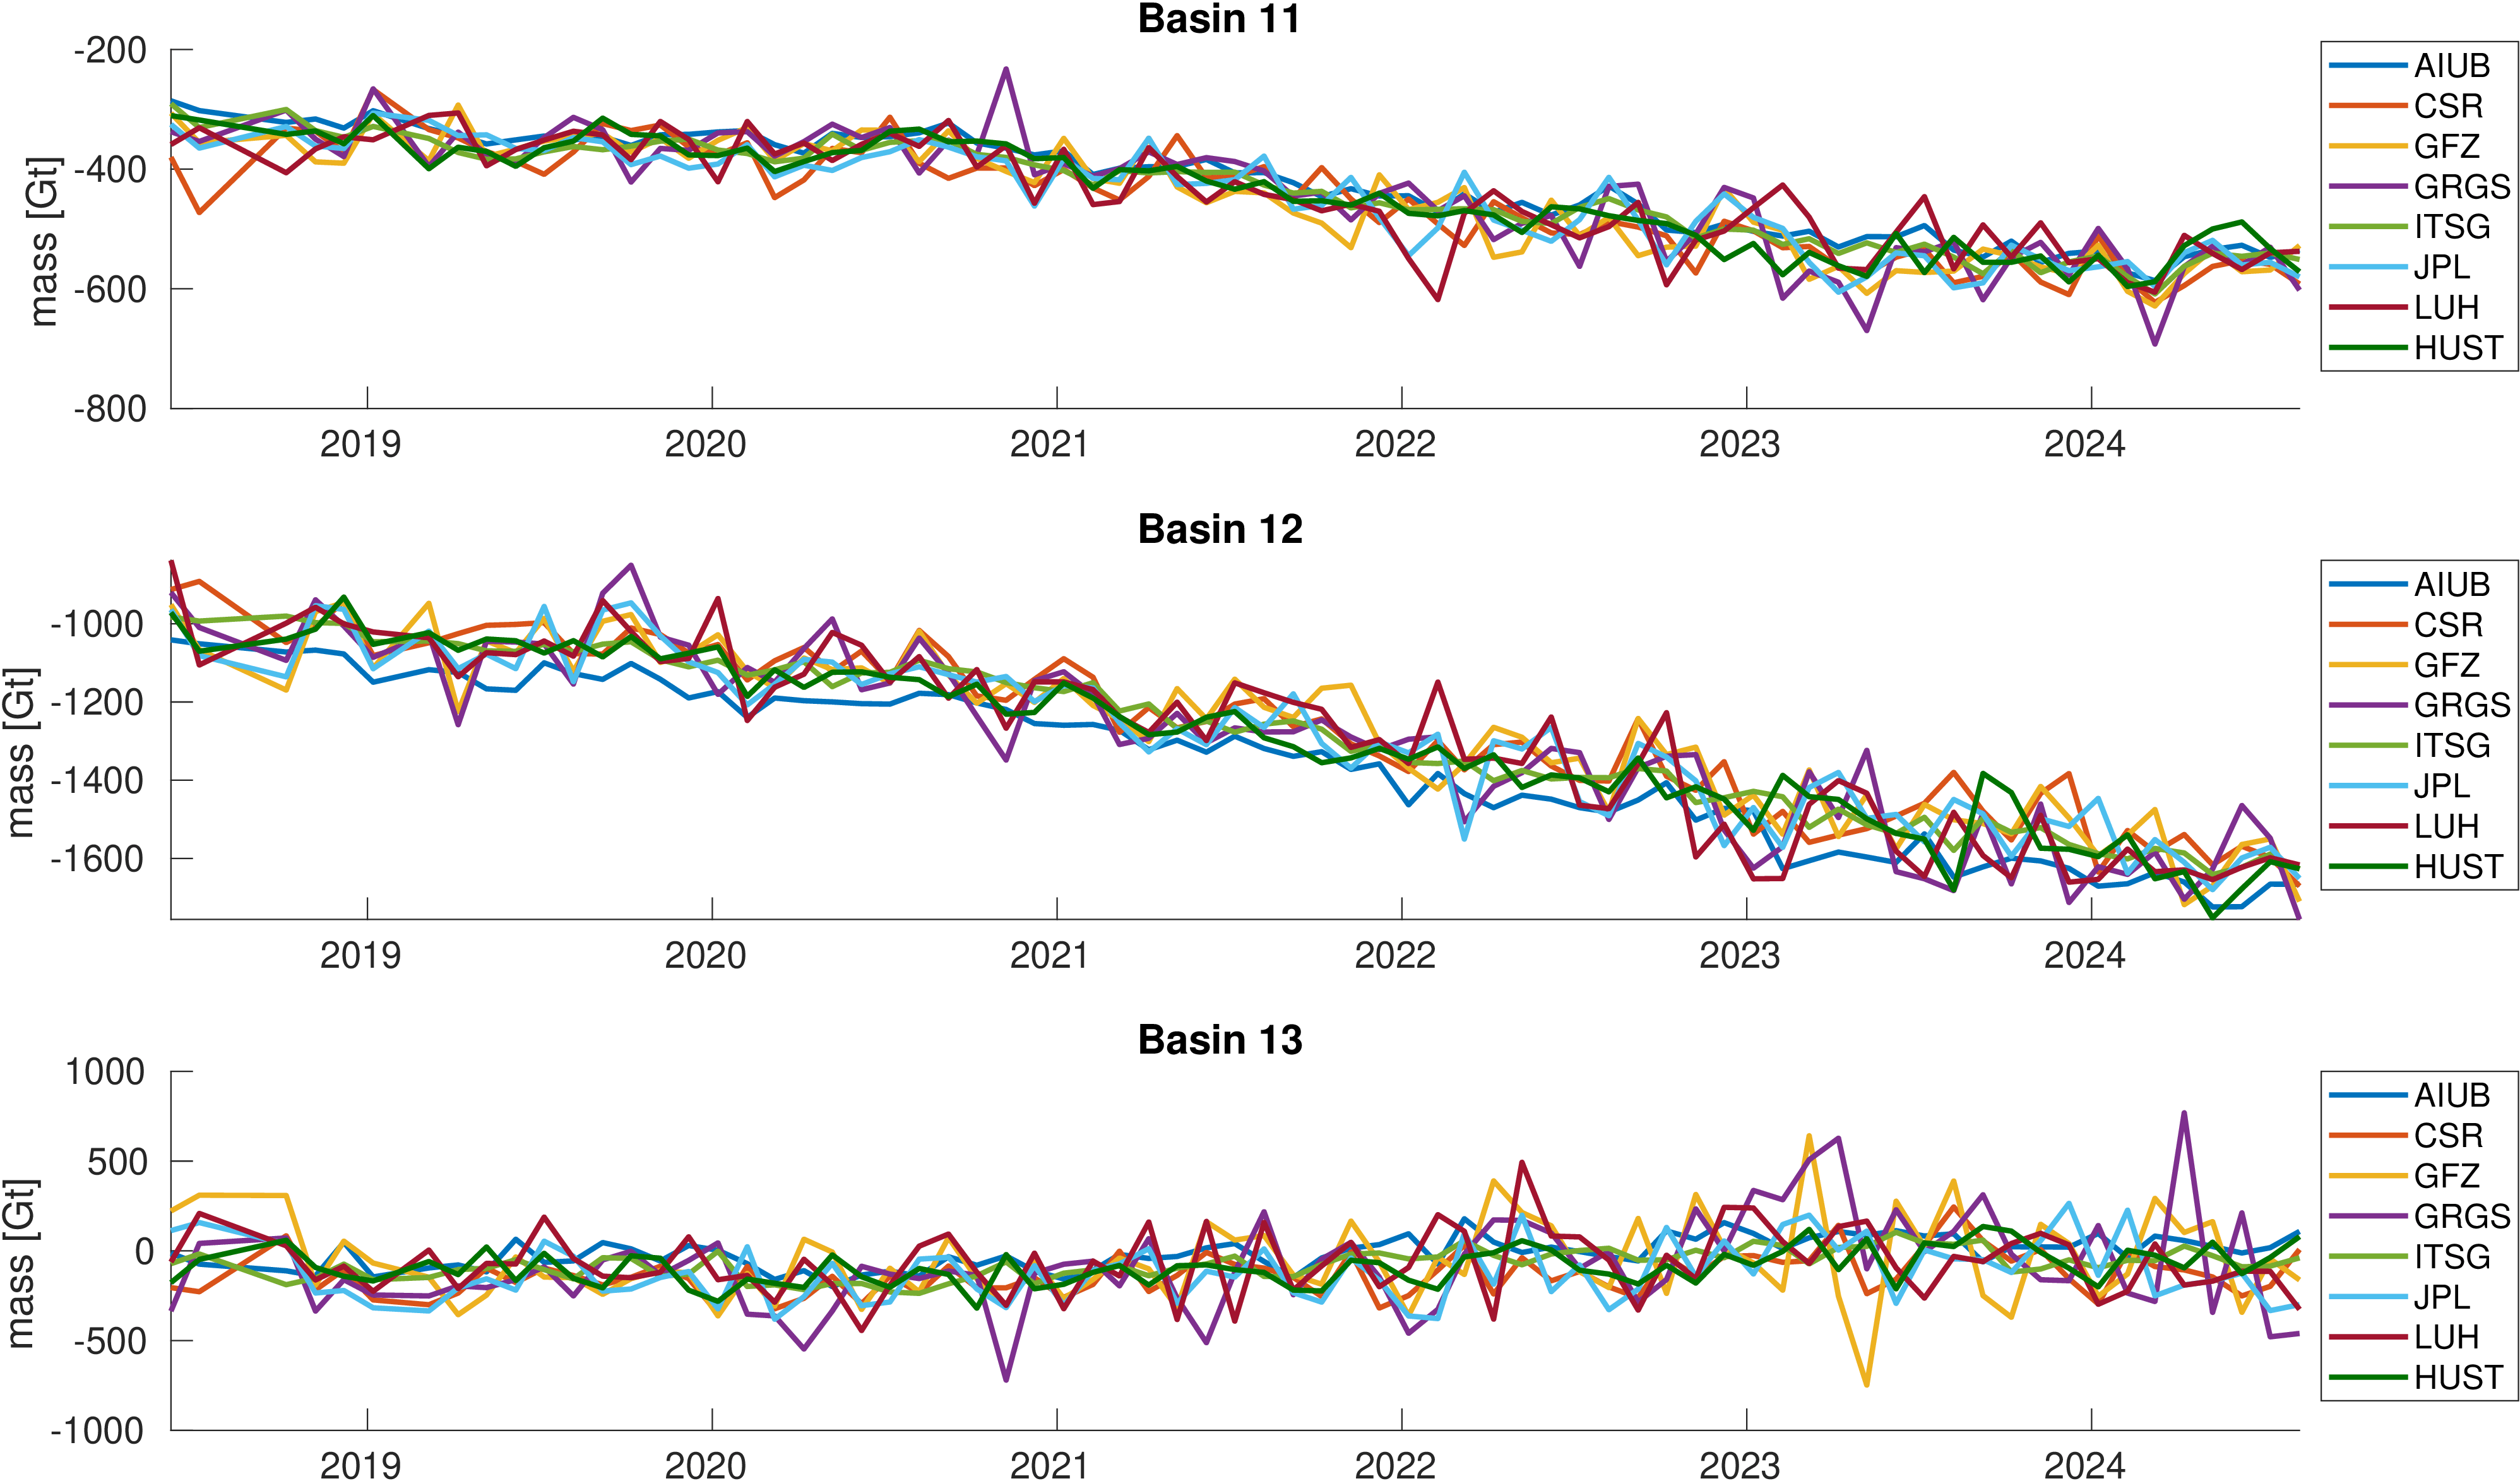
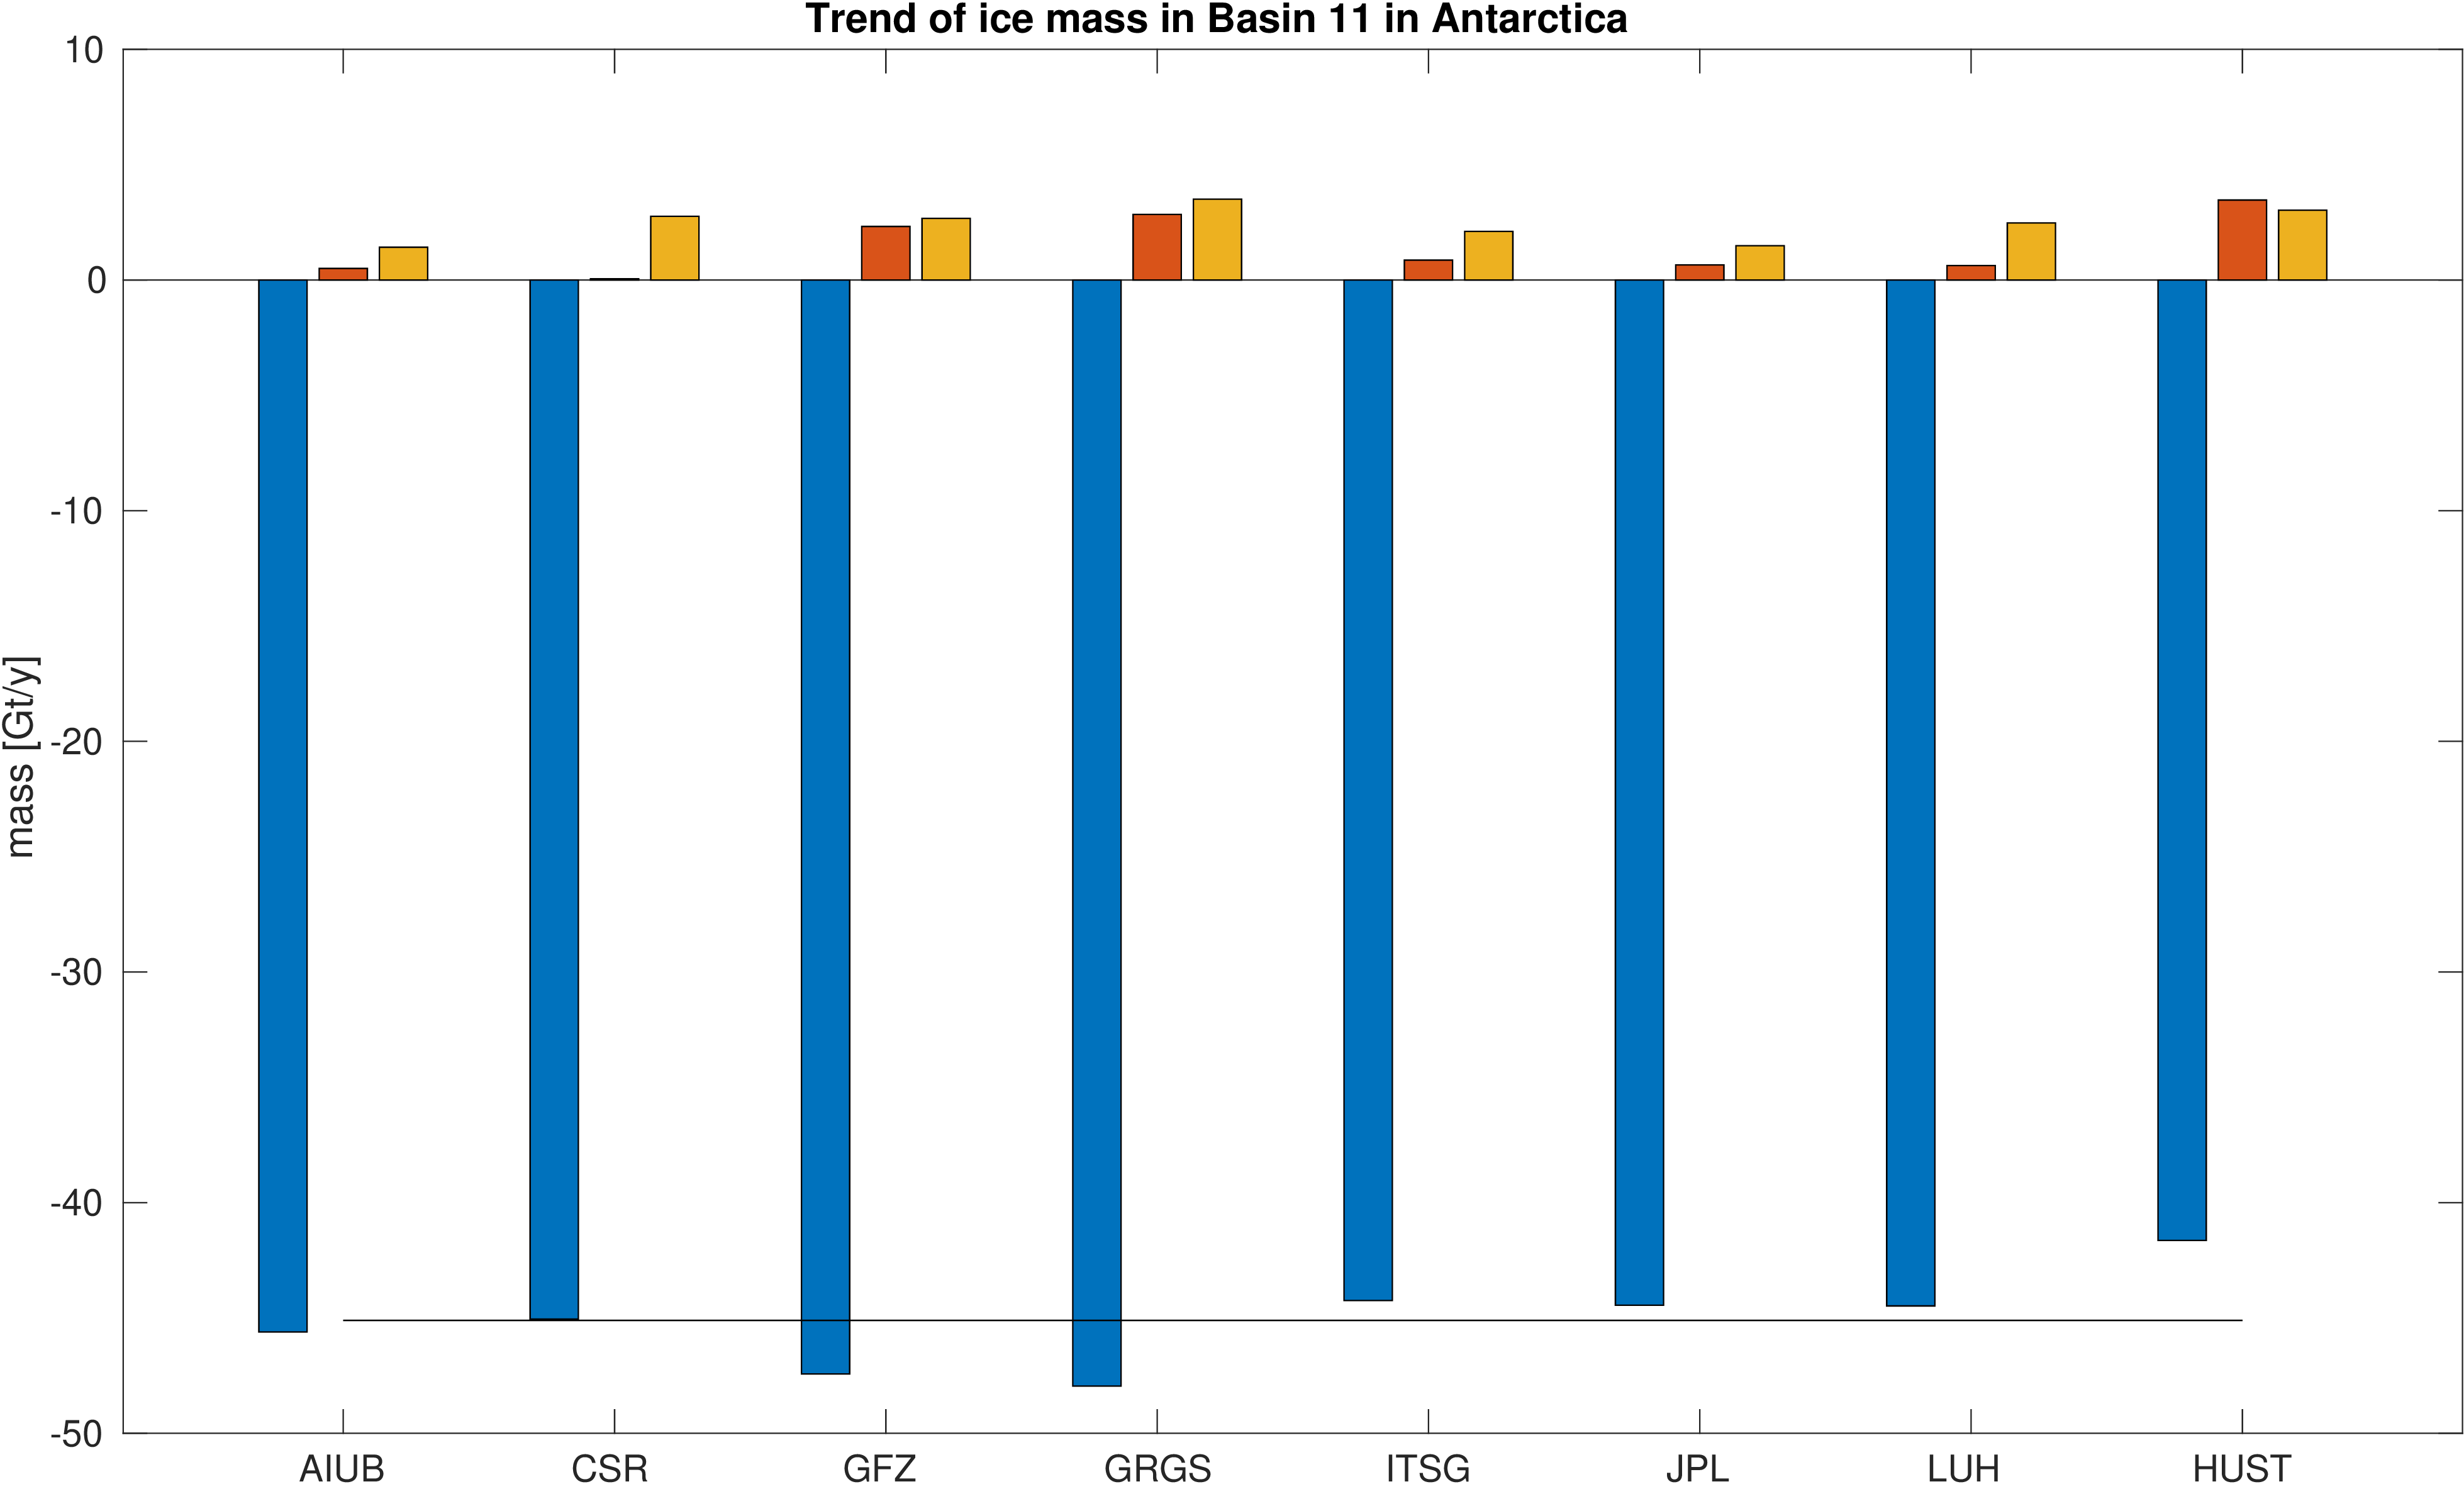
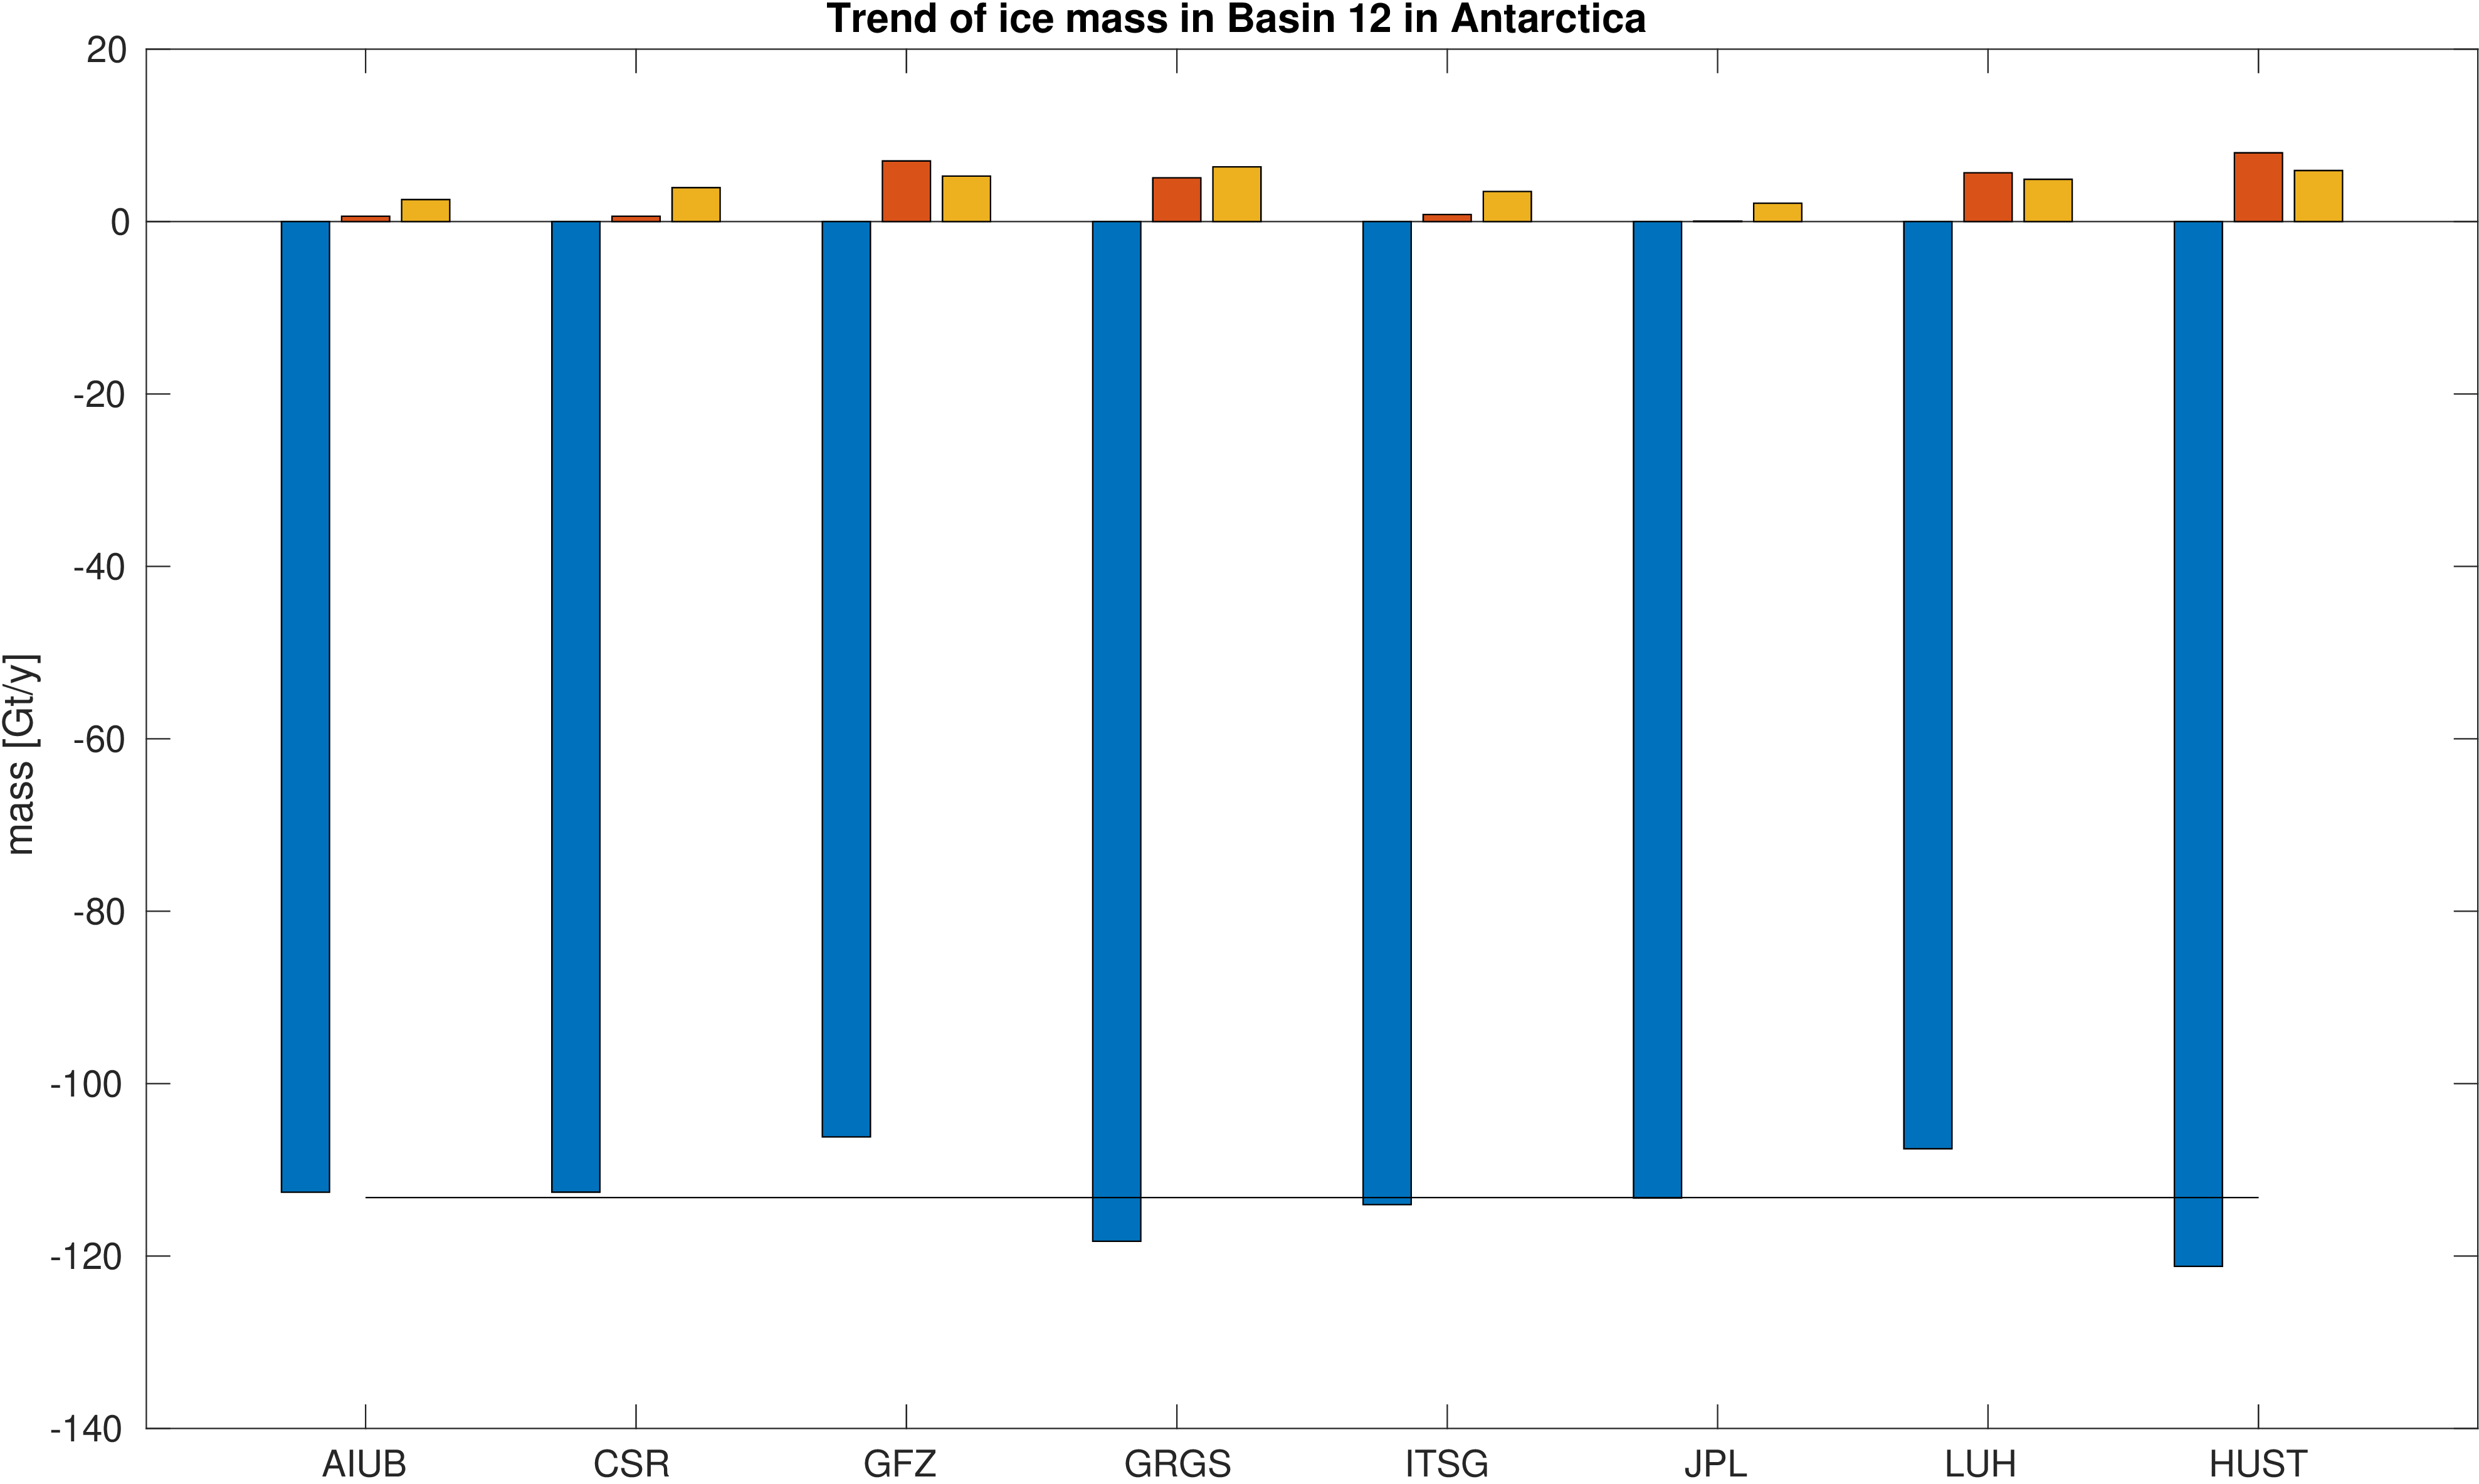
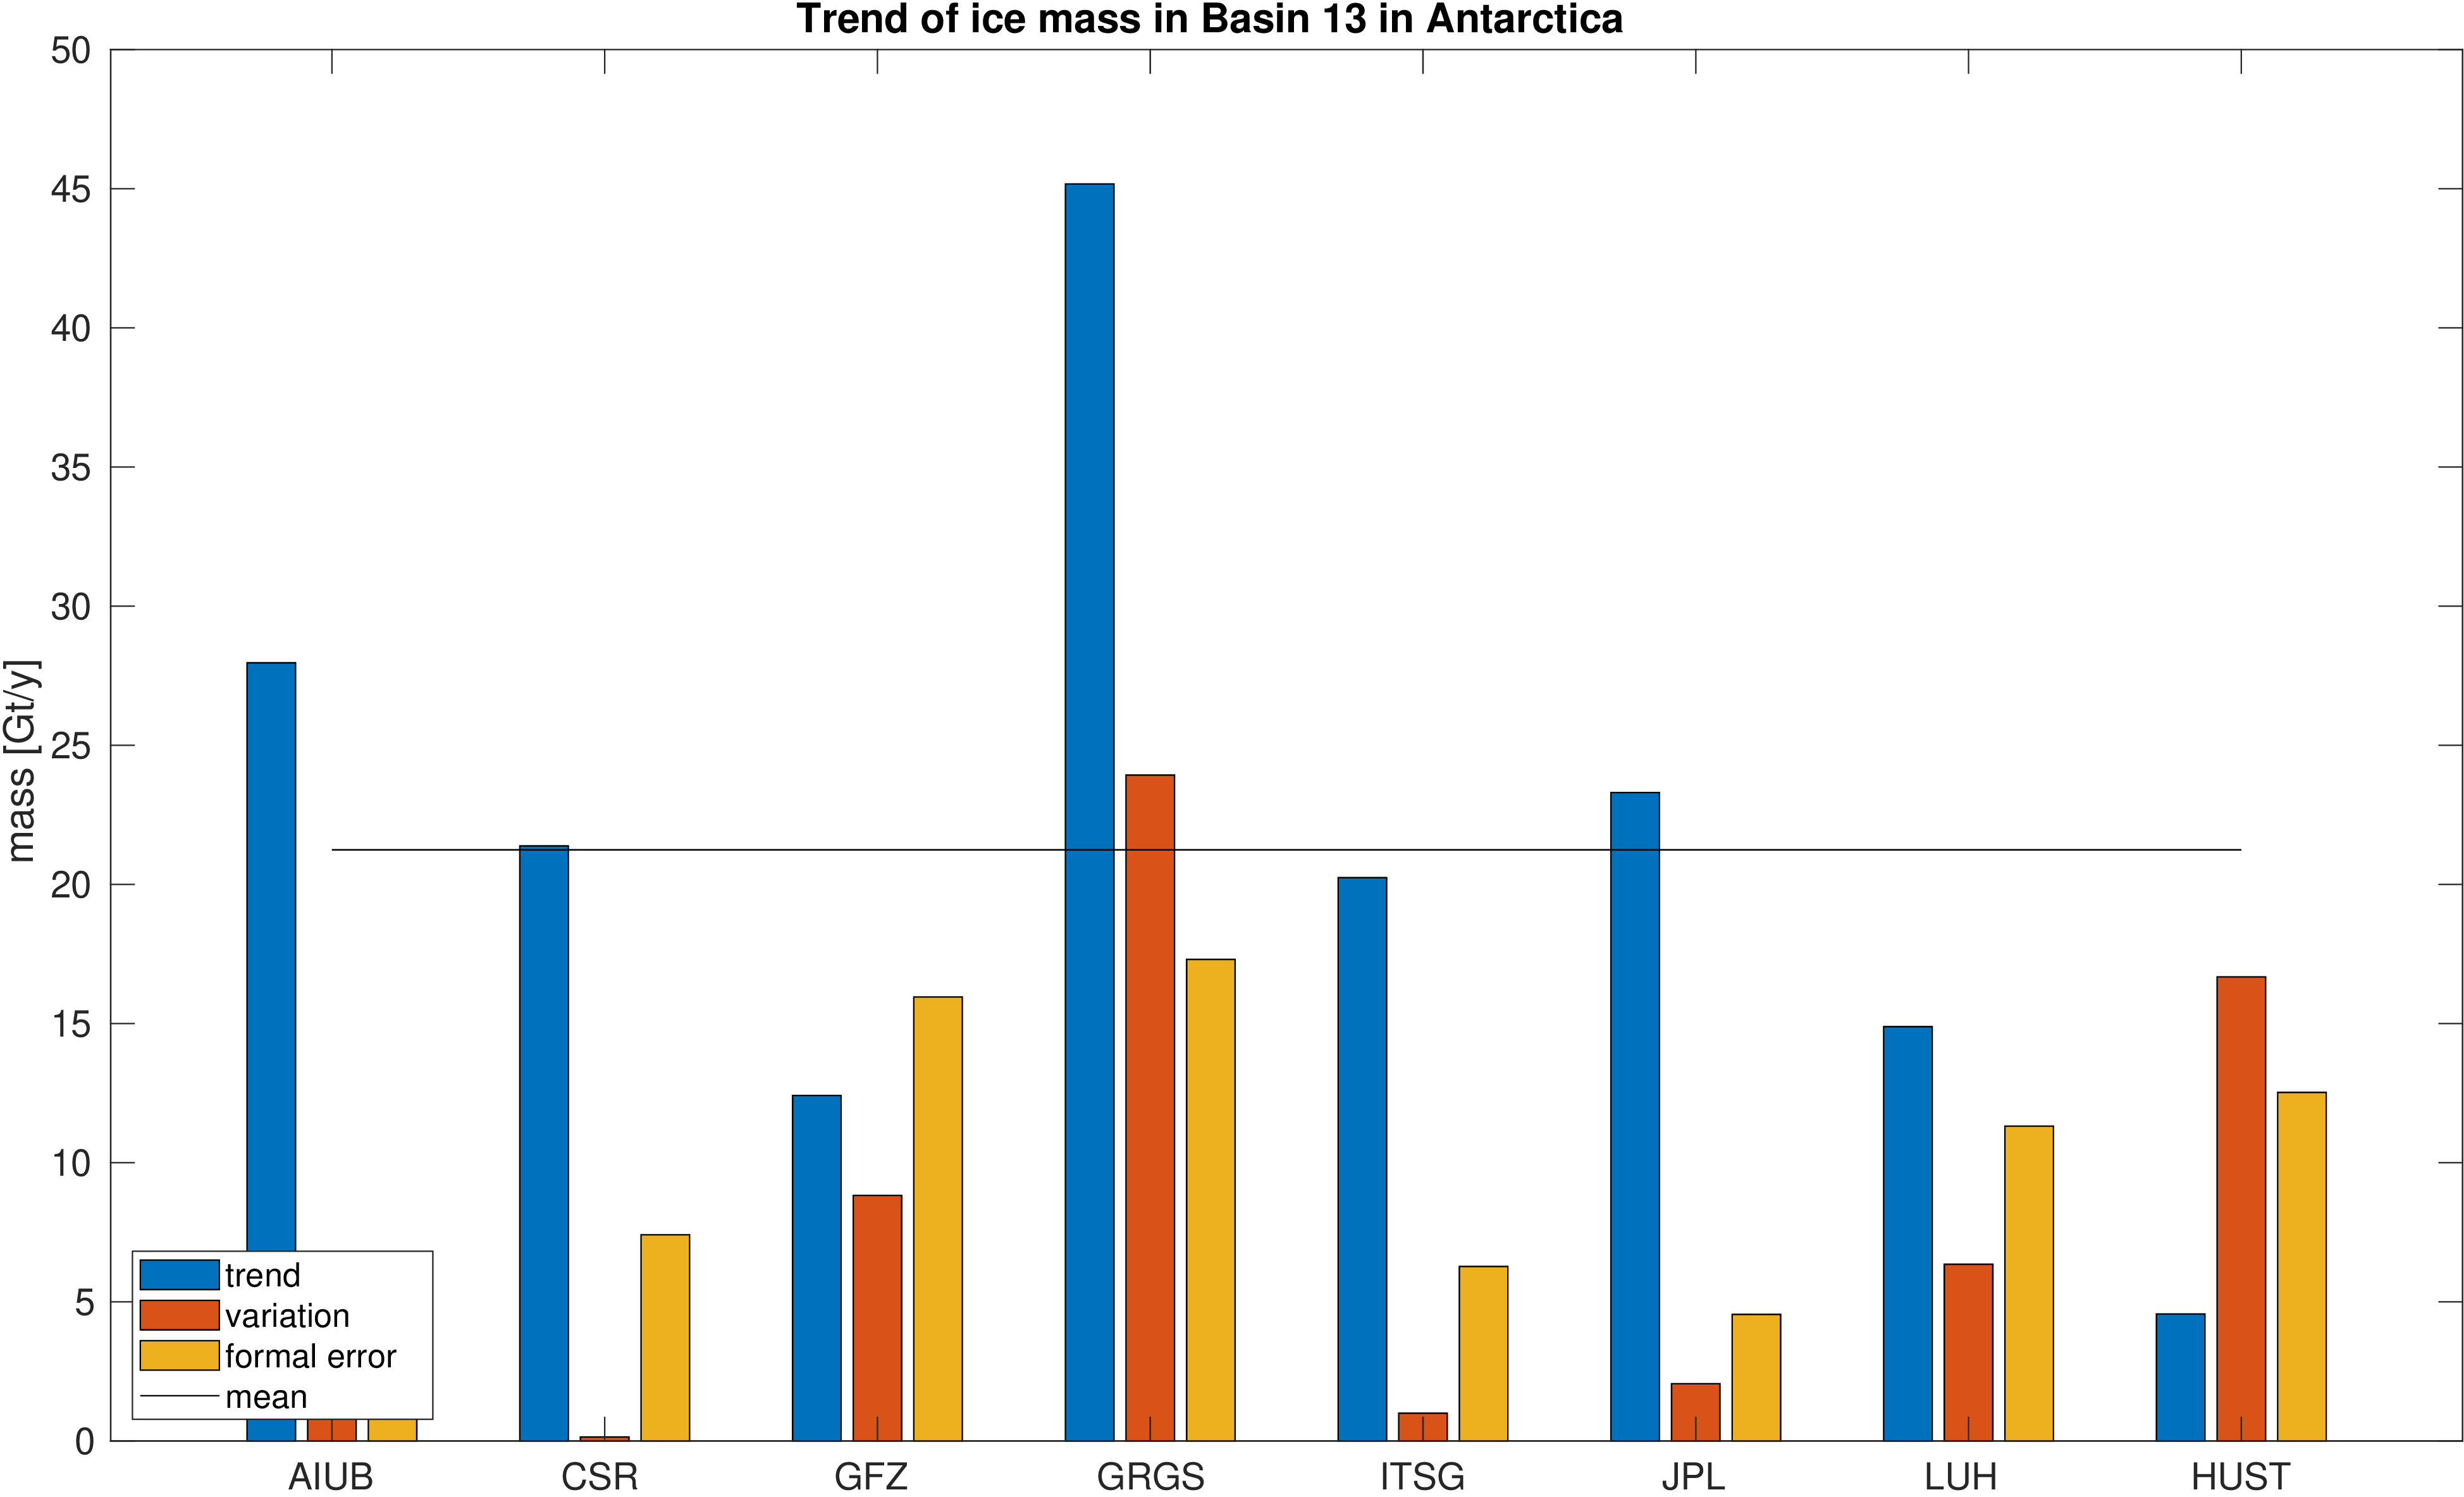
Assessment of ice mass change in selected glacial basins along the west coast of Antarctica.
Mass is derived from mean equivalent water height within the basins. A deterministic signal model including linear trend,
annual and semi-annual variations is fitted to the mass changes within the basins. No filter was applied to avoid leakage caused by the filter.
The mean trend value is indicated by a black line. Differences with respect to the mean trend and formal errors
of the estimated trends are also given to assess the significance of the differences.
| Mass trends |
Basin 11 |
Basin 12 |
Basin 13 |
|
|
|
|
top


