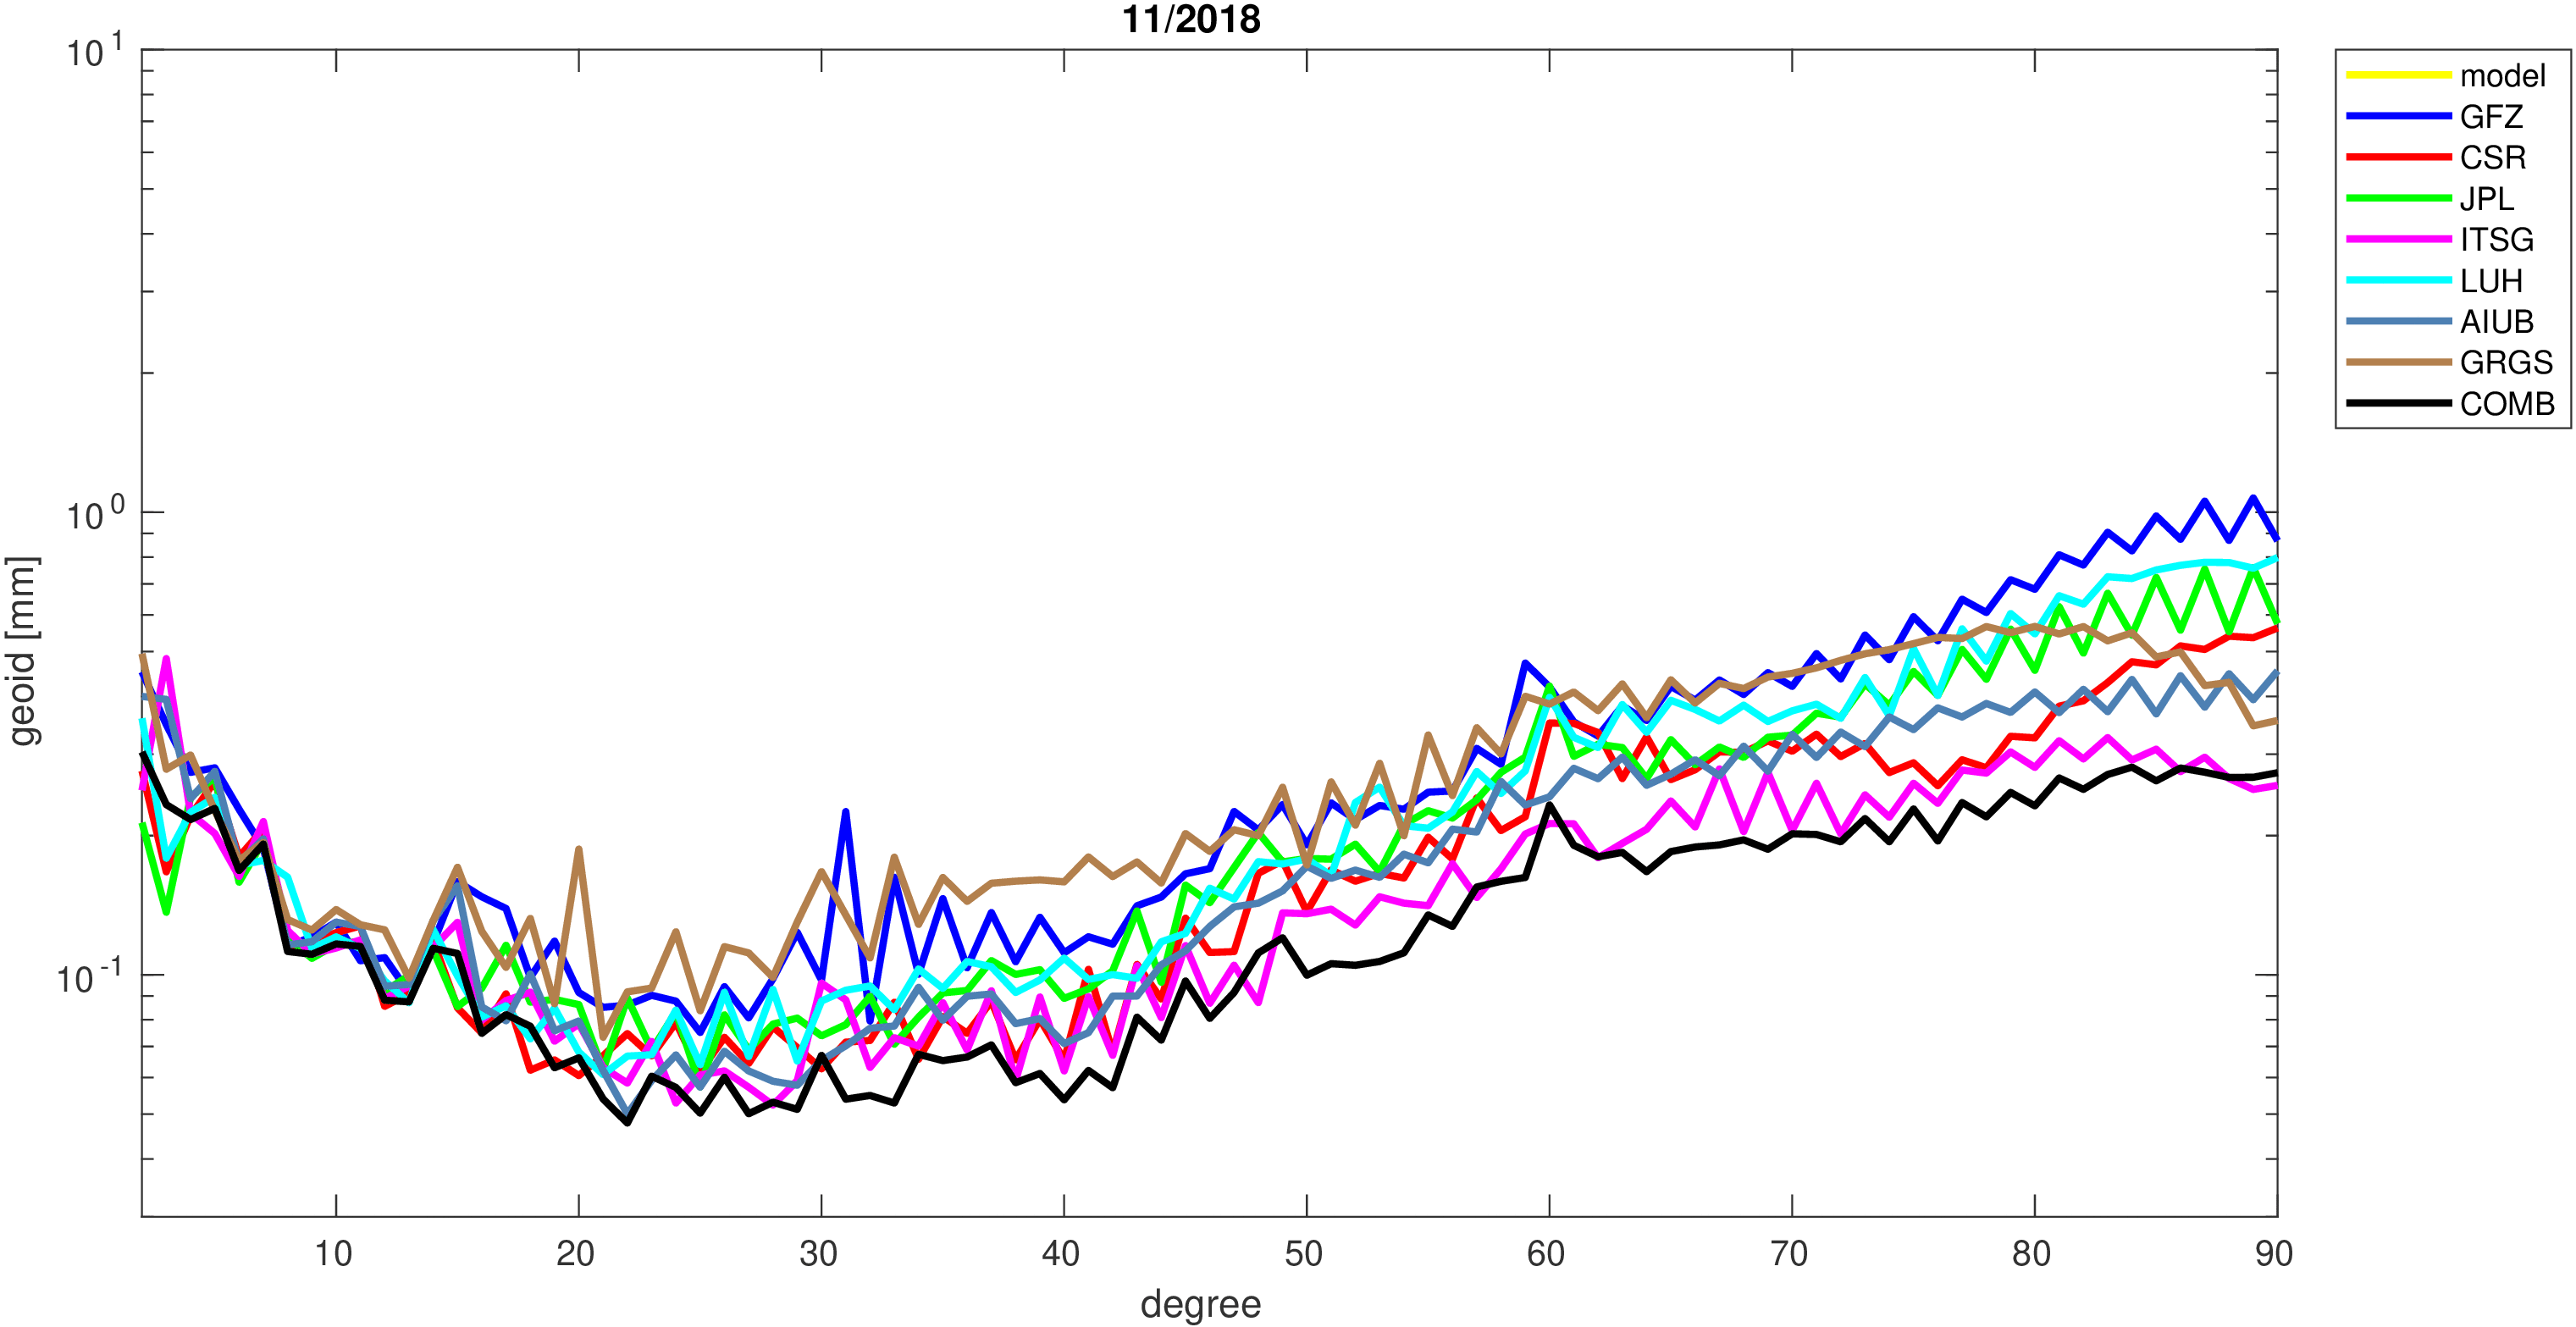
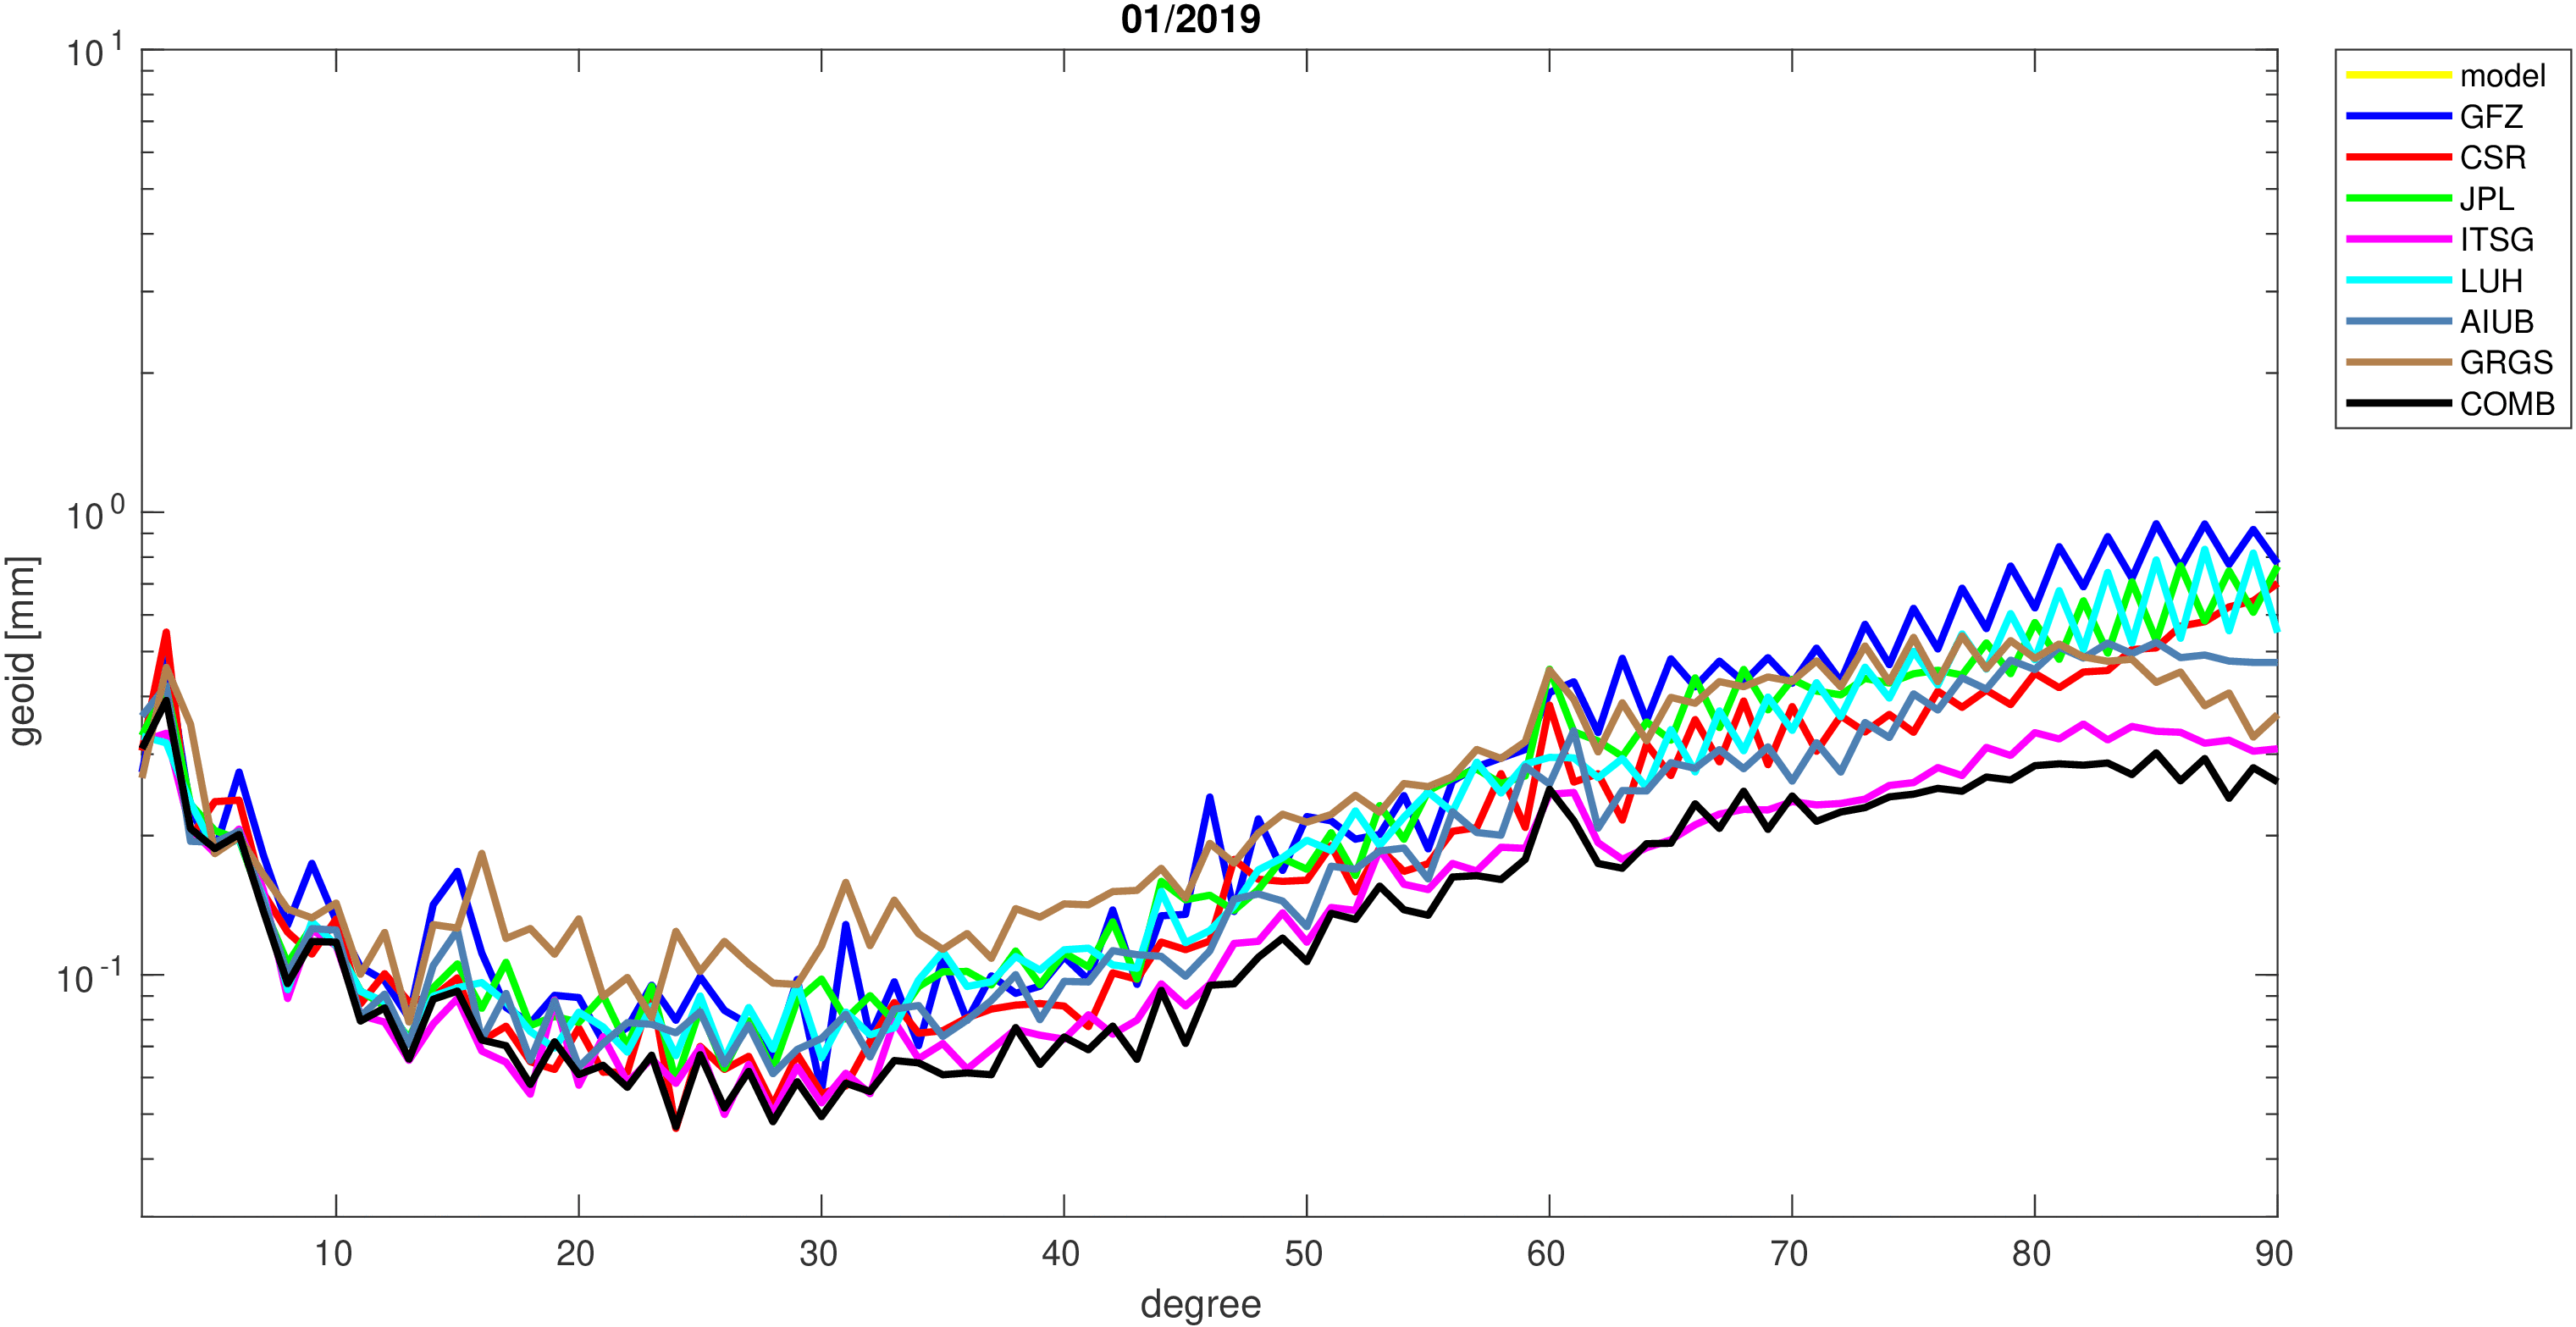
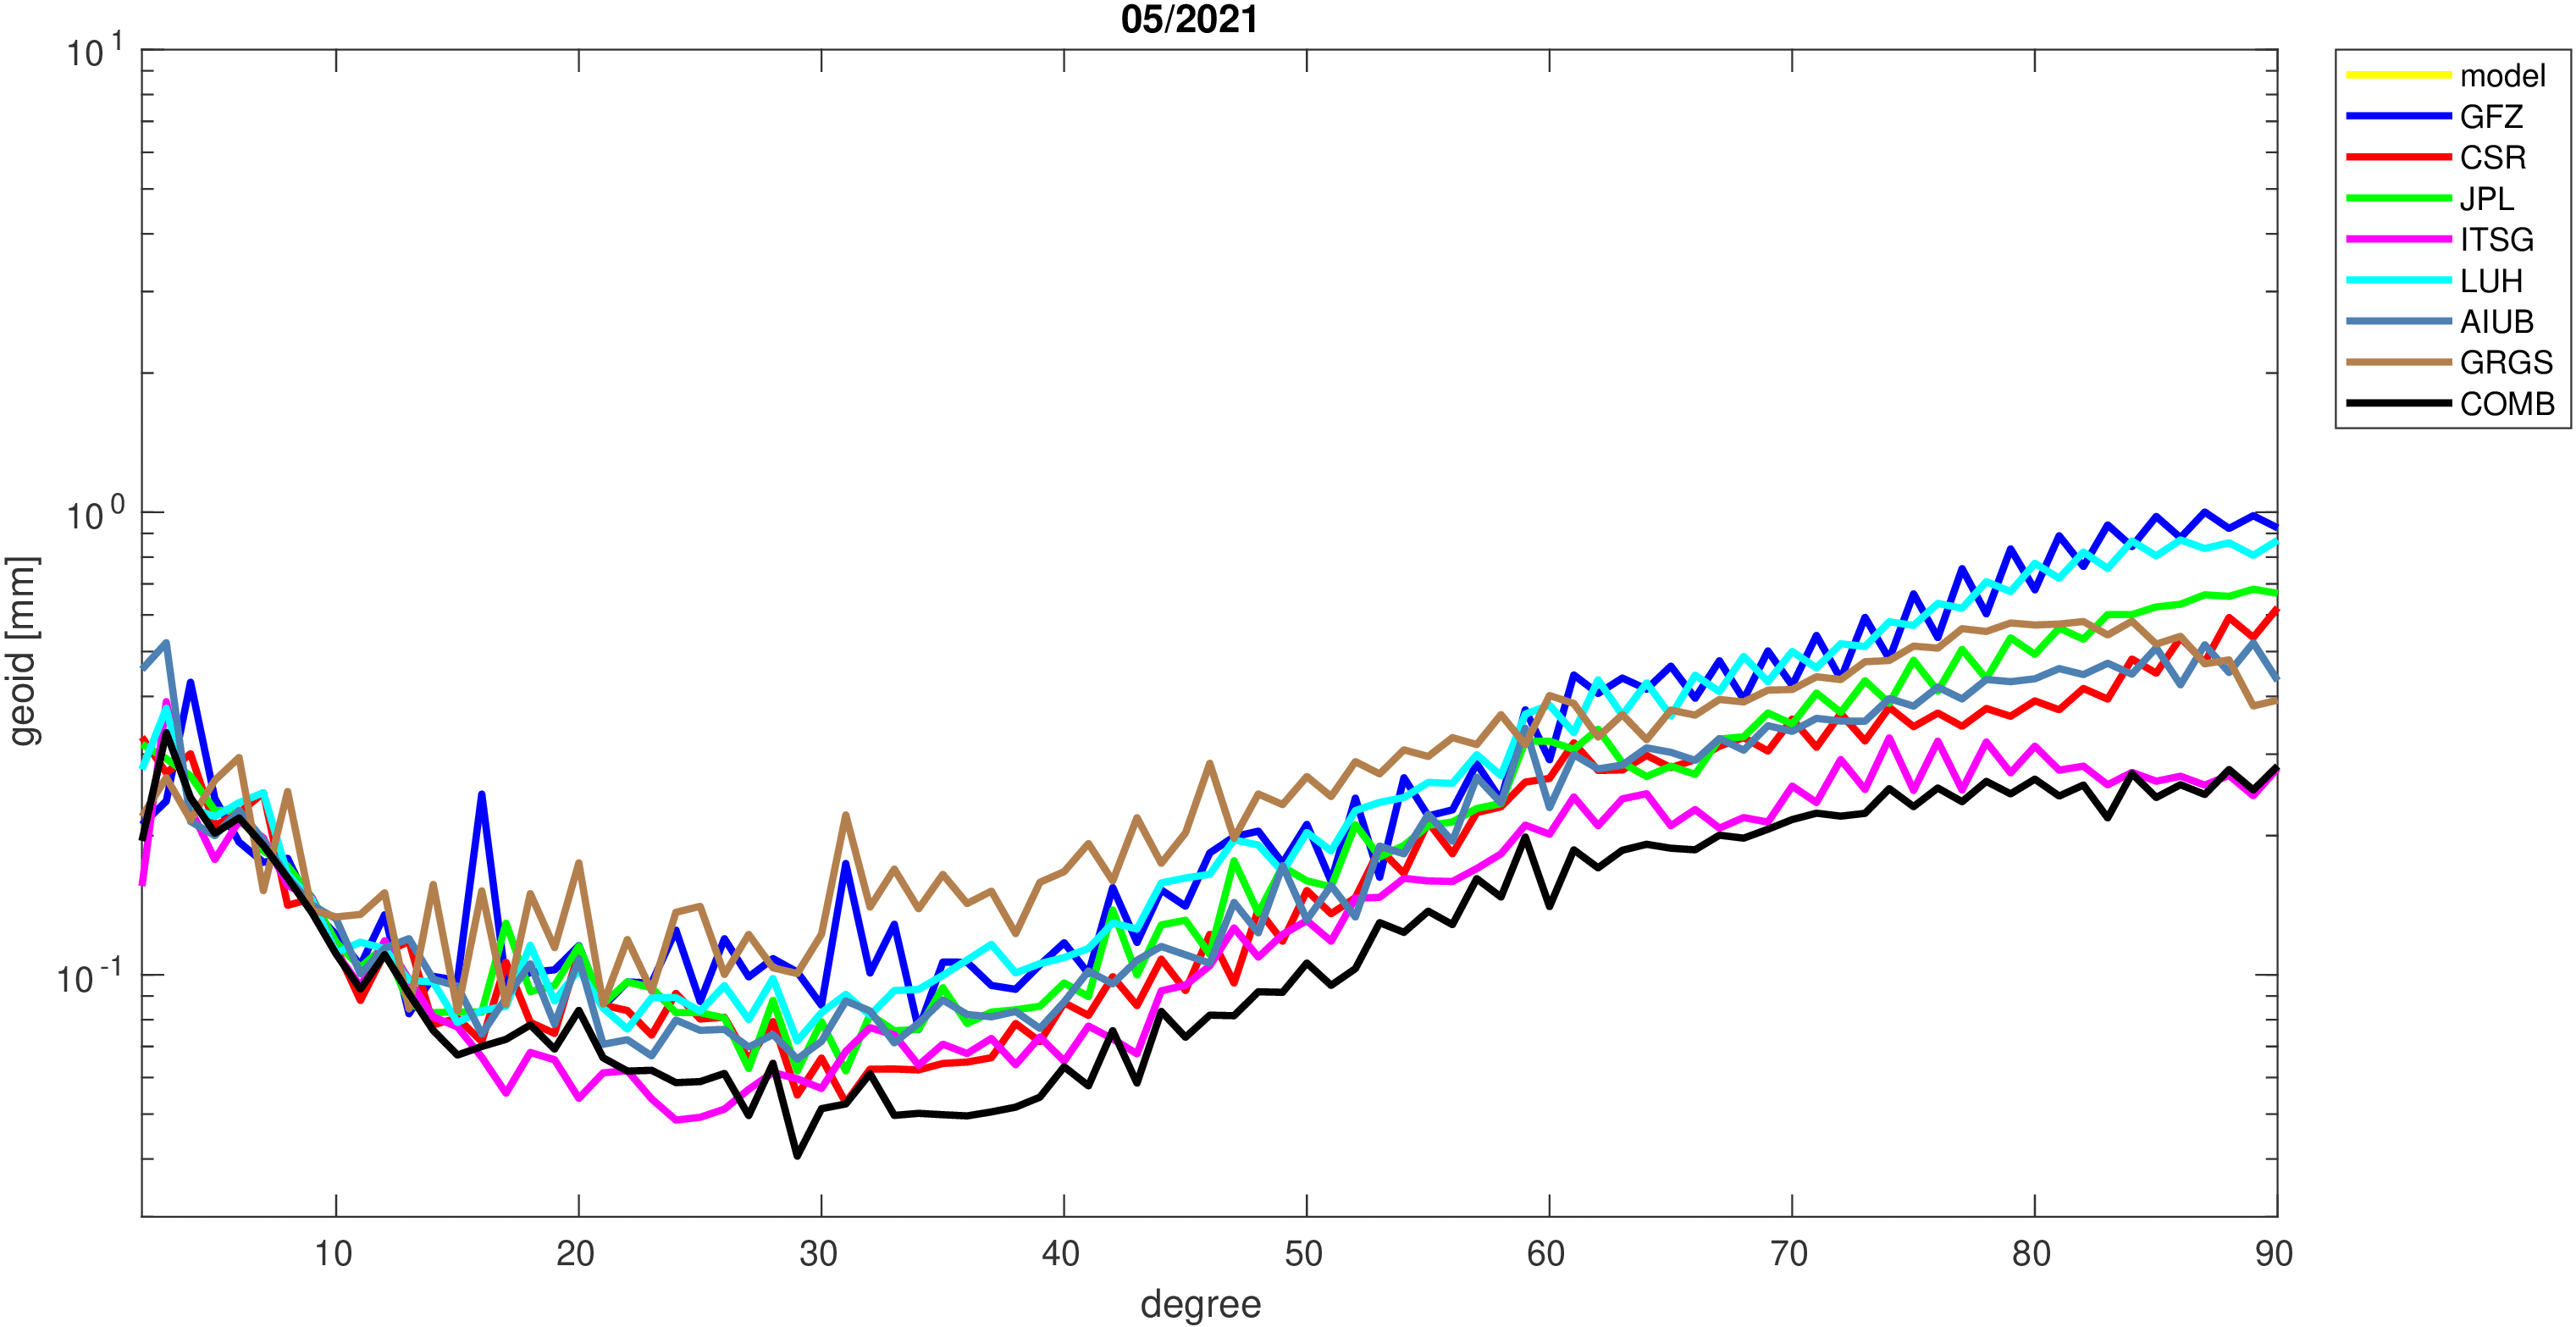
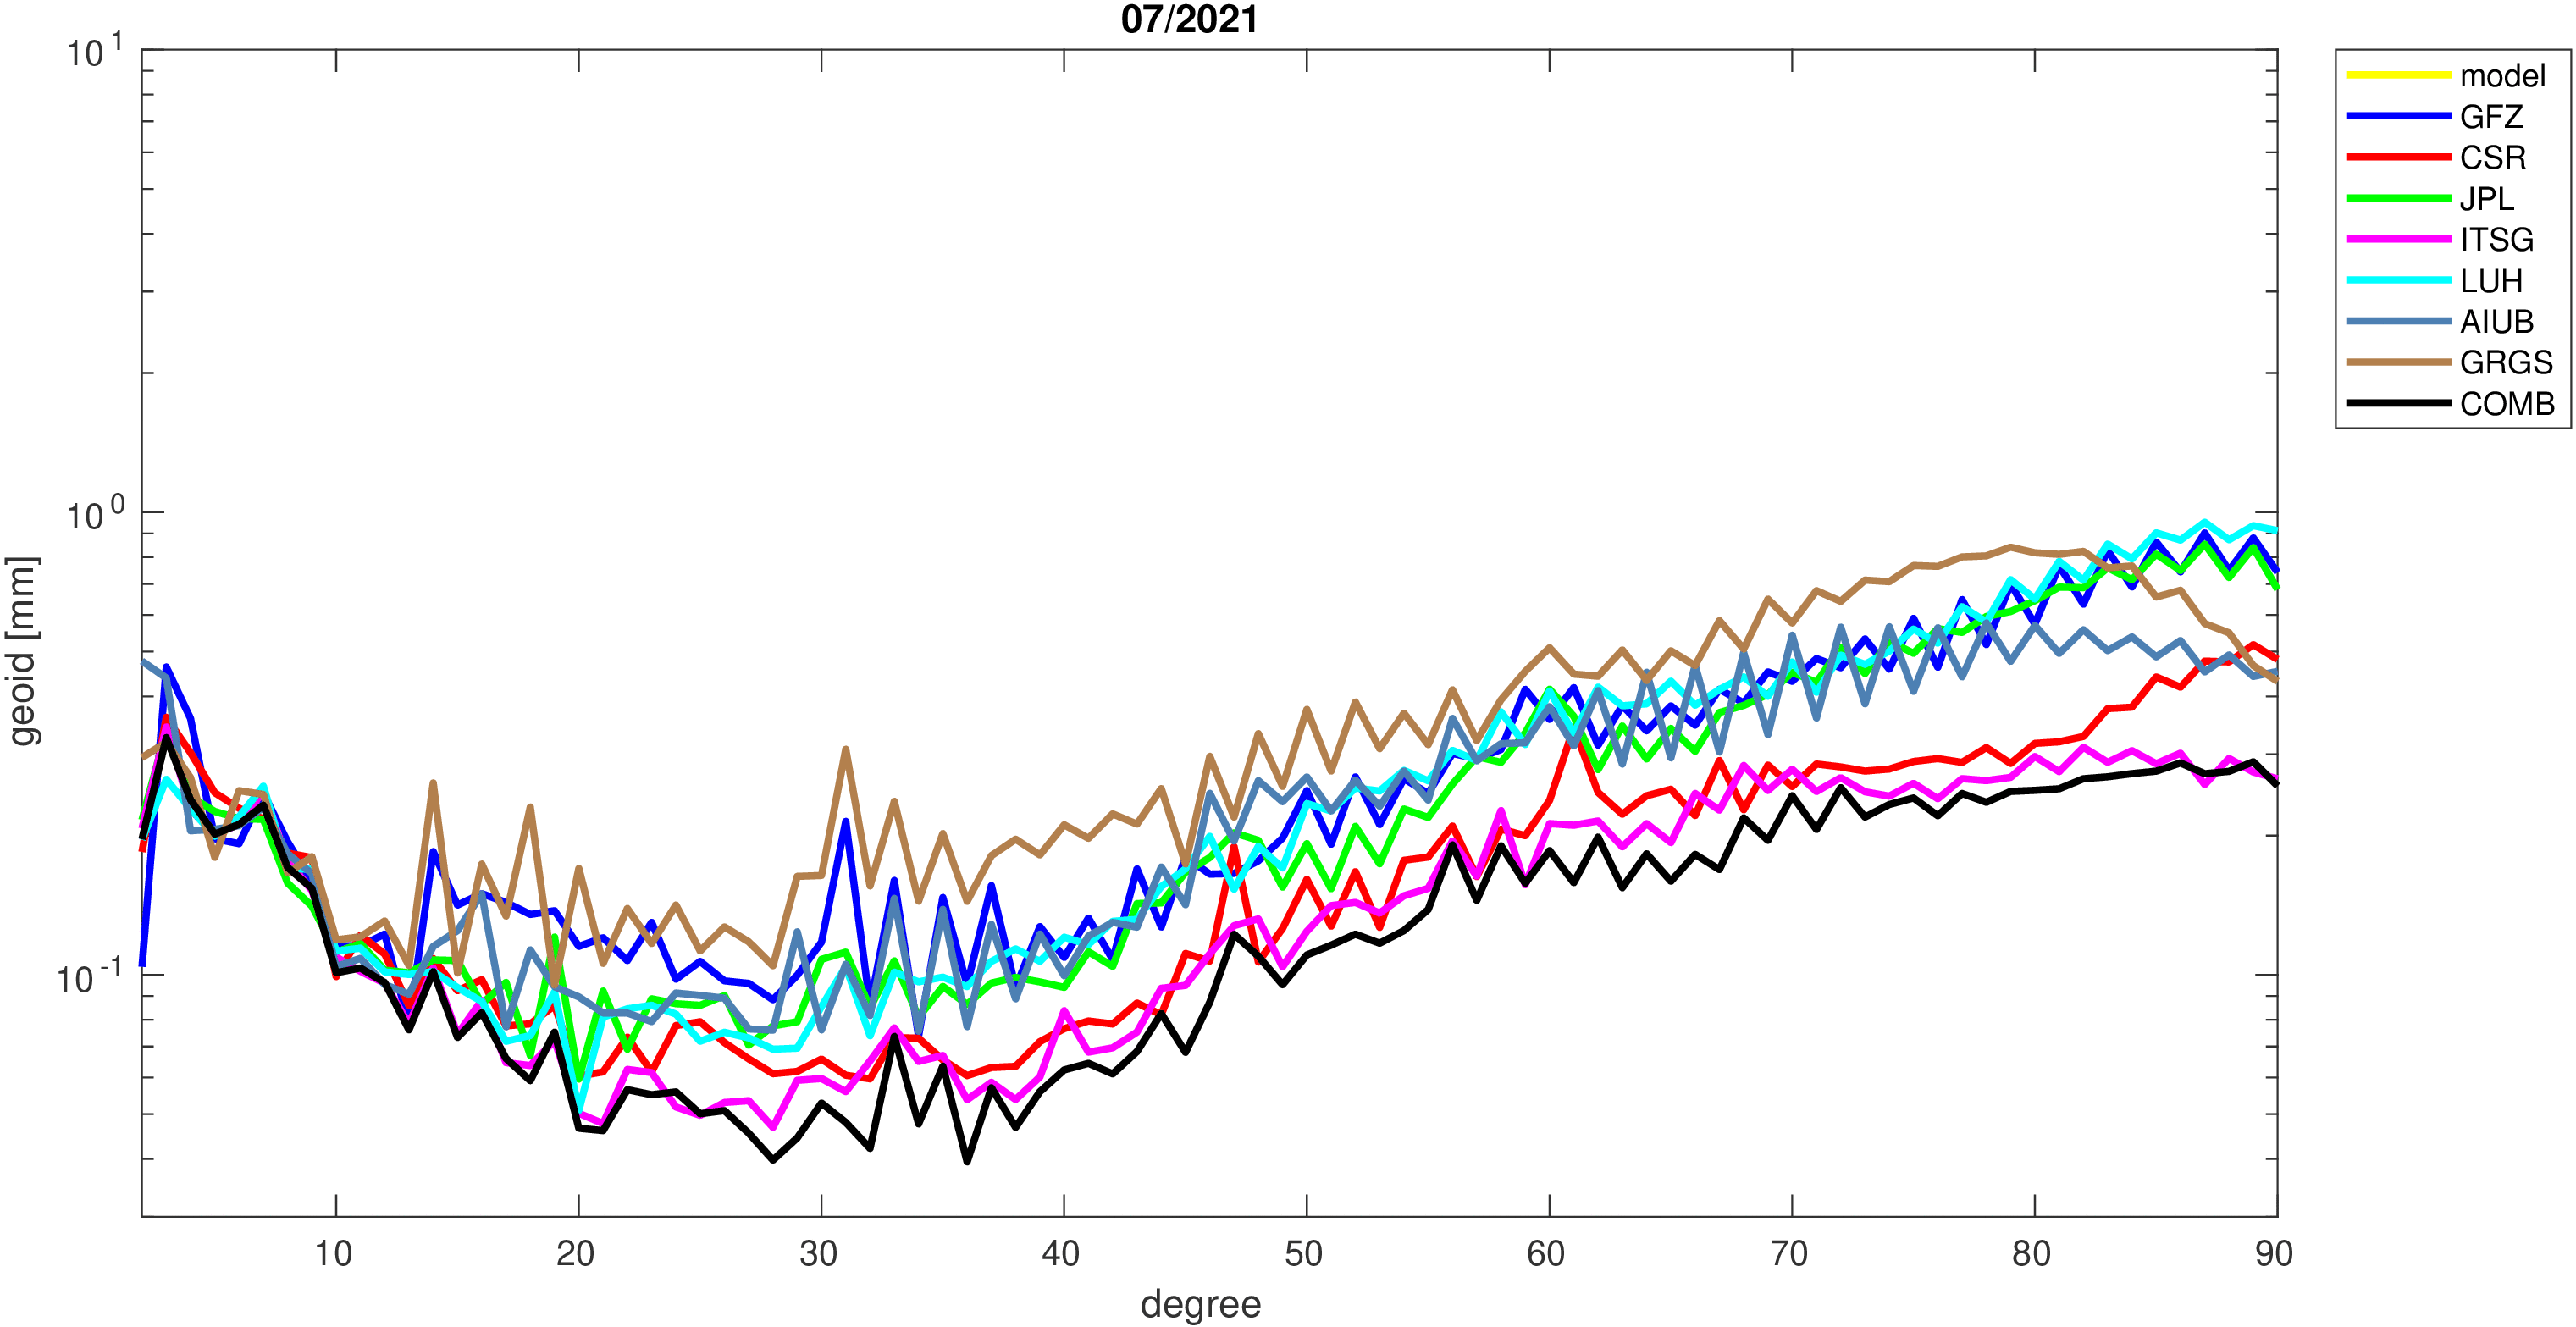
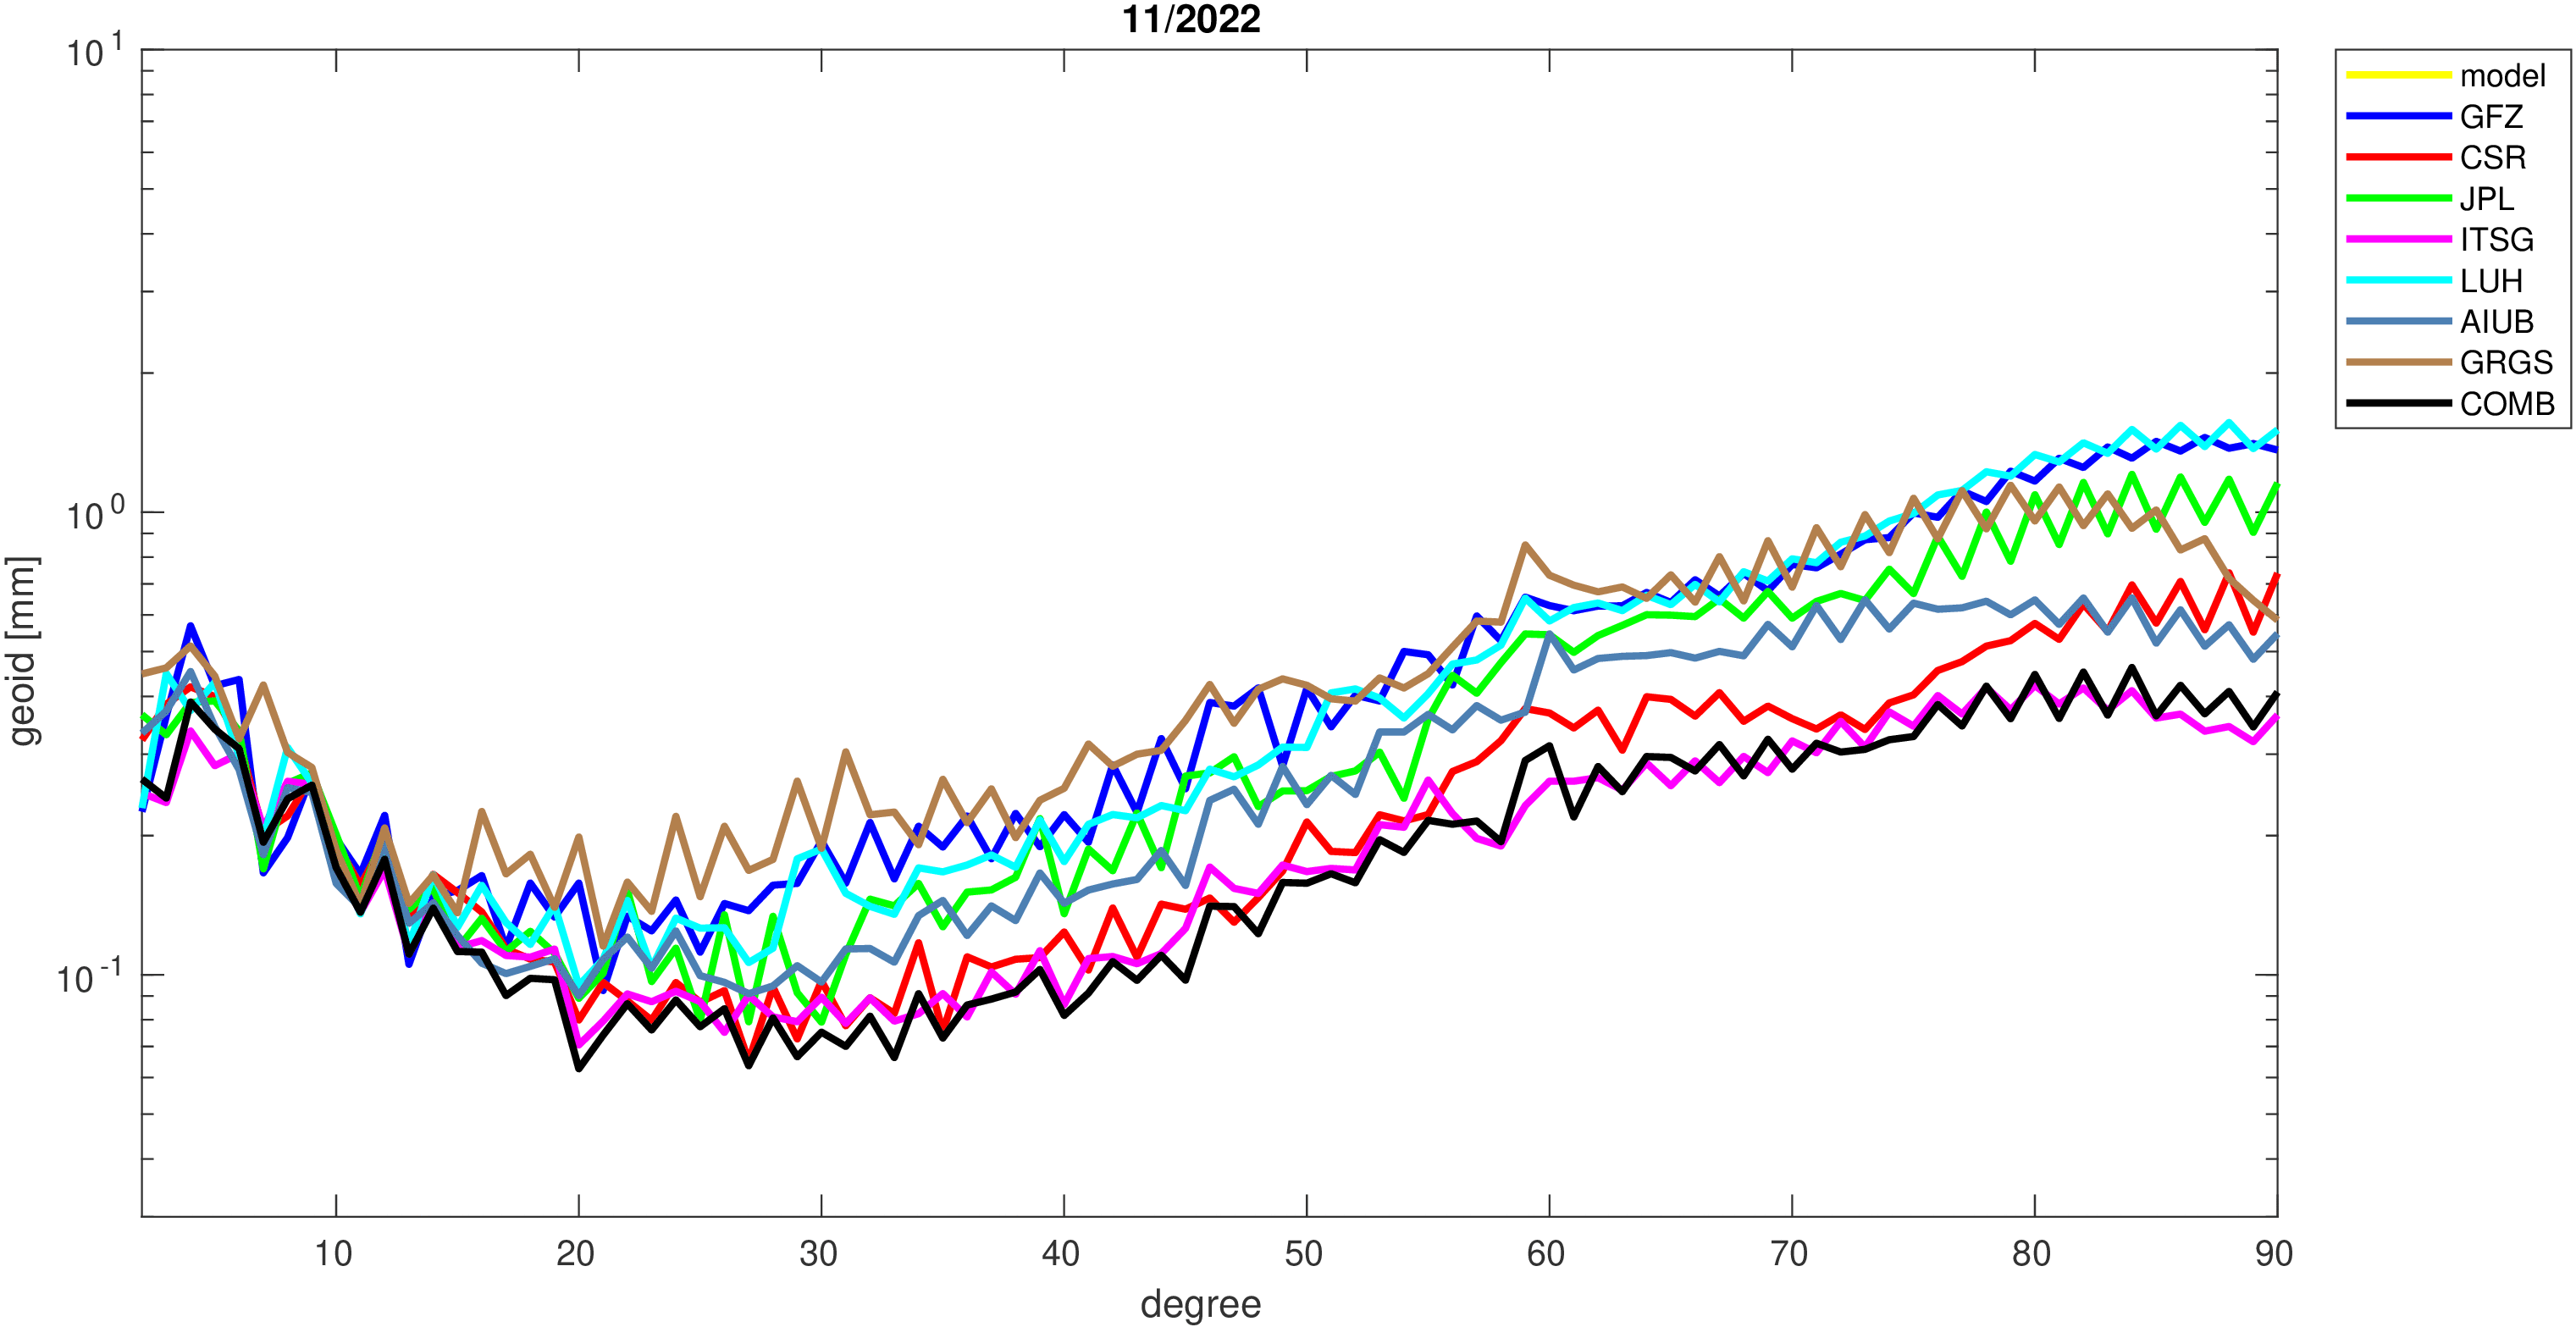
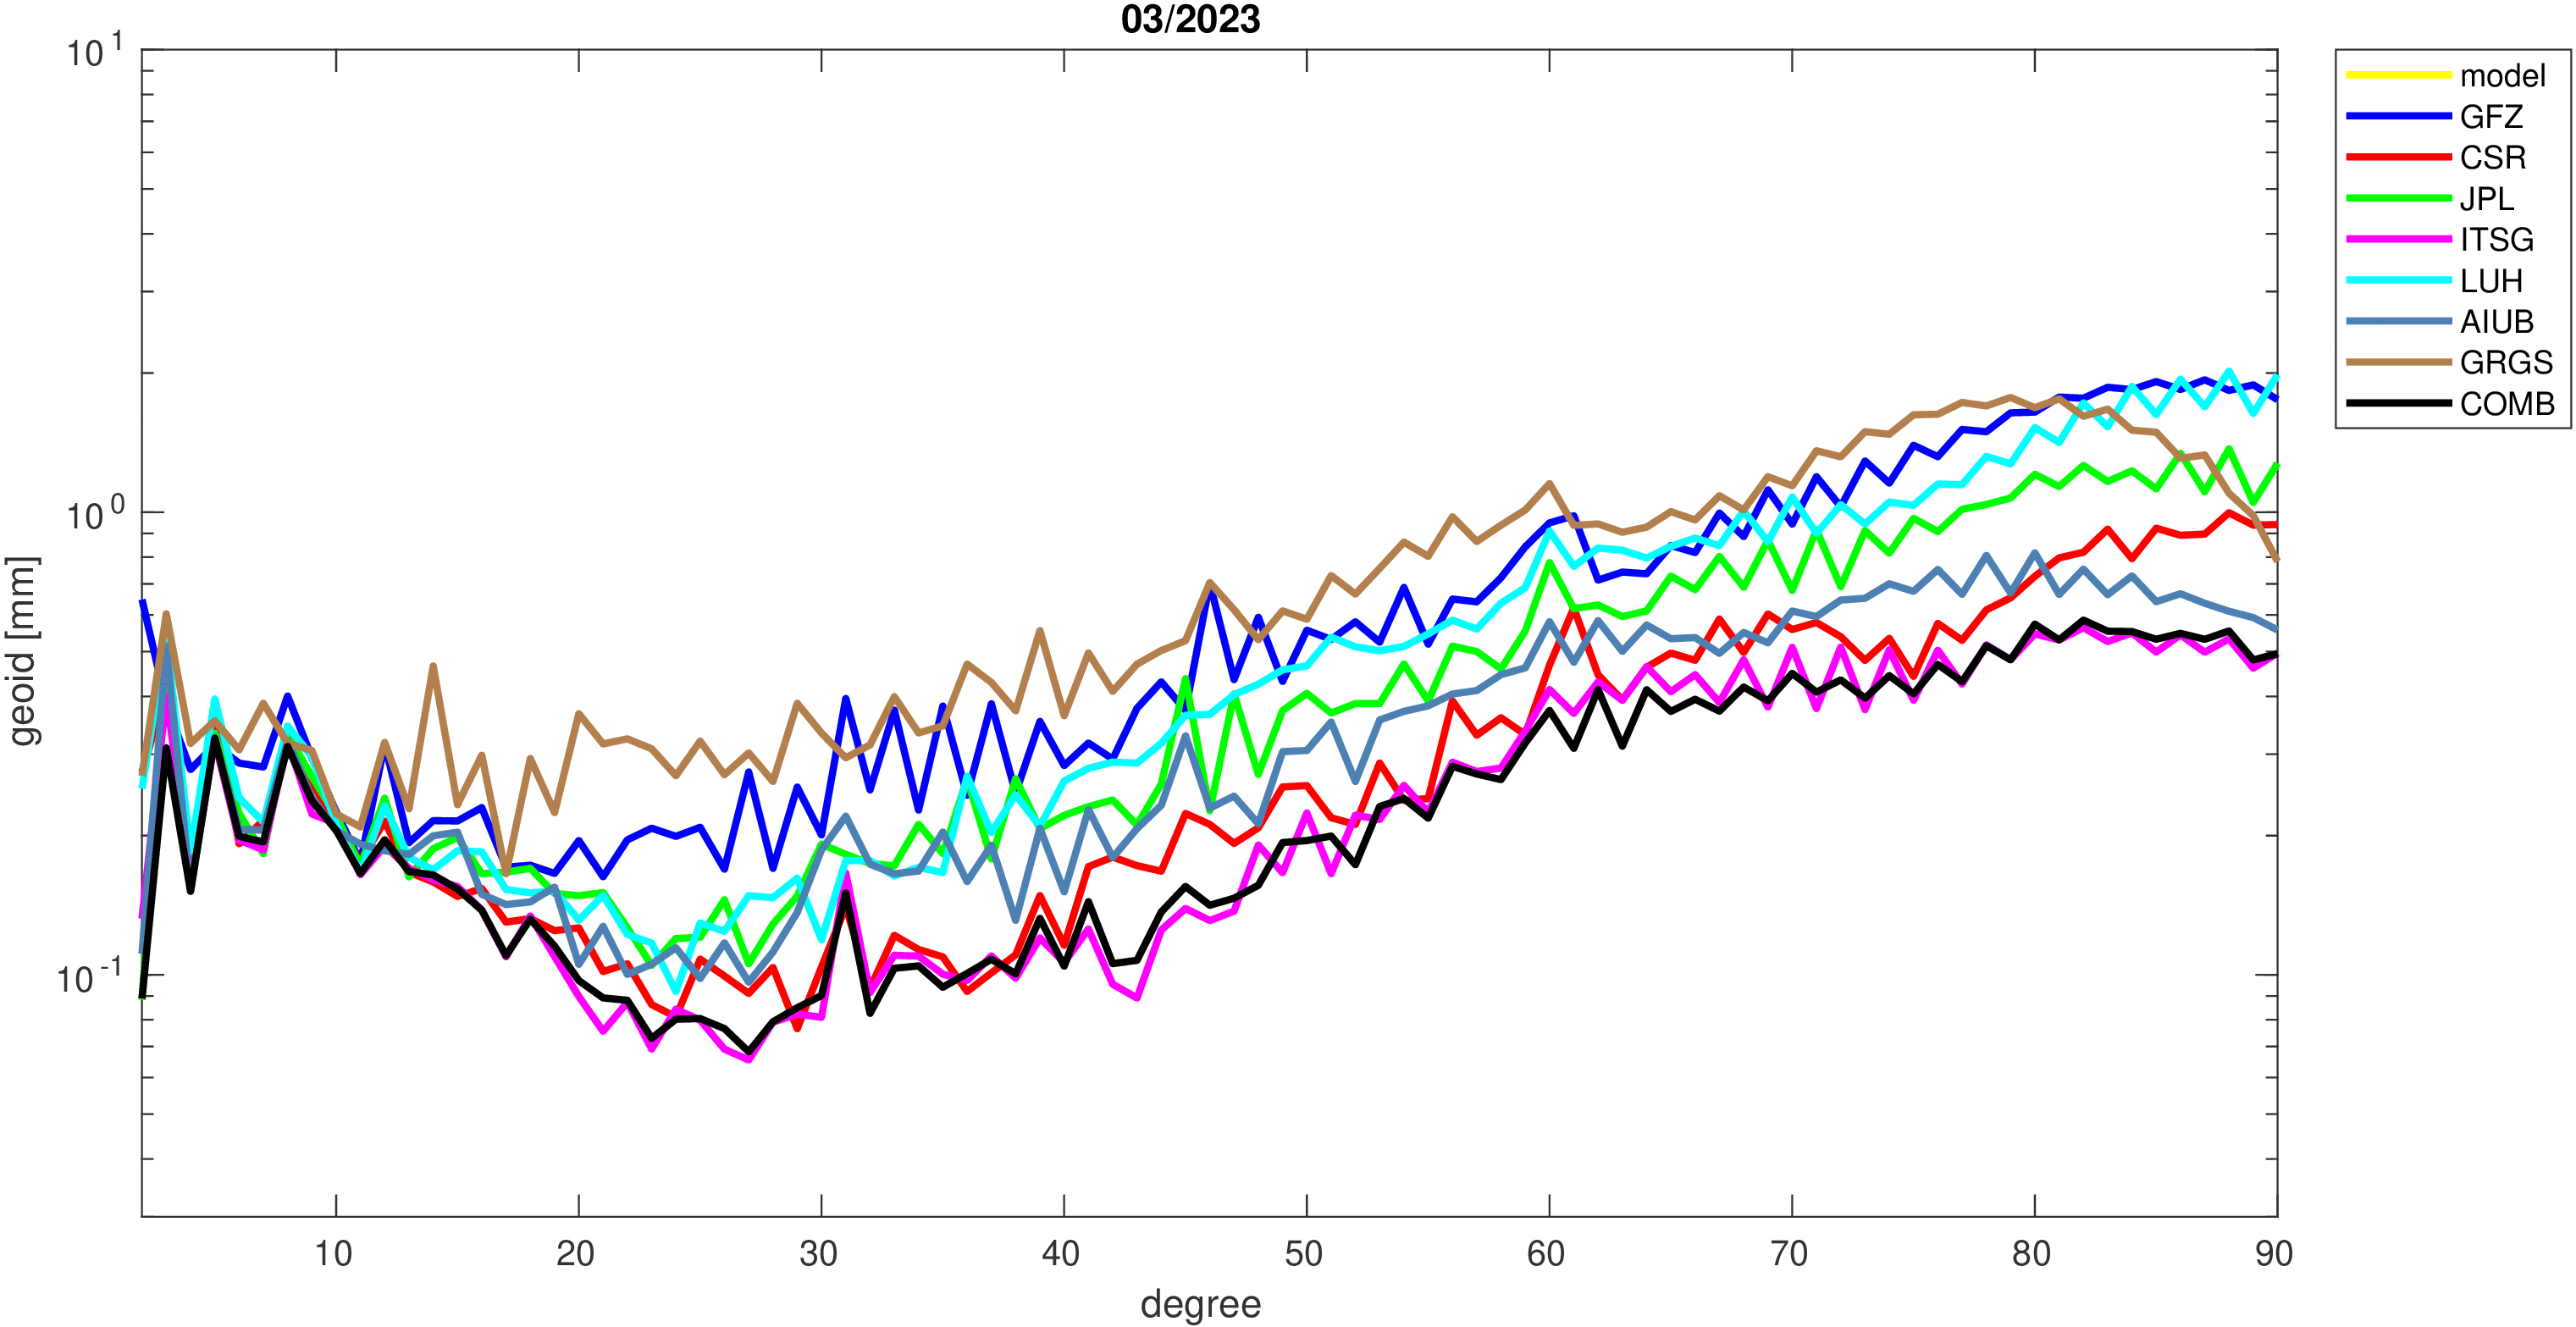
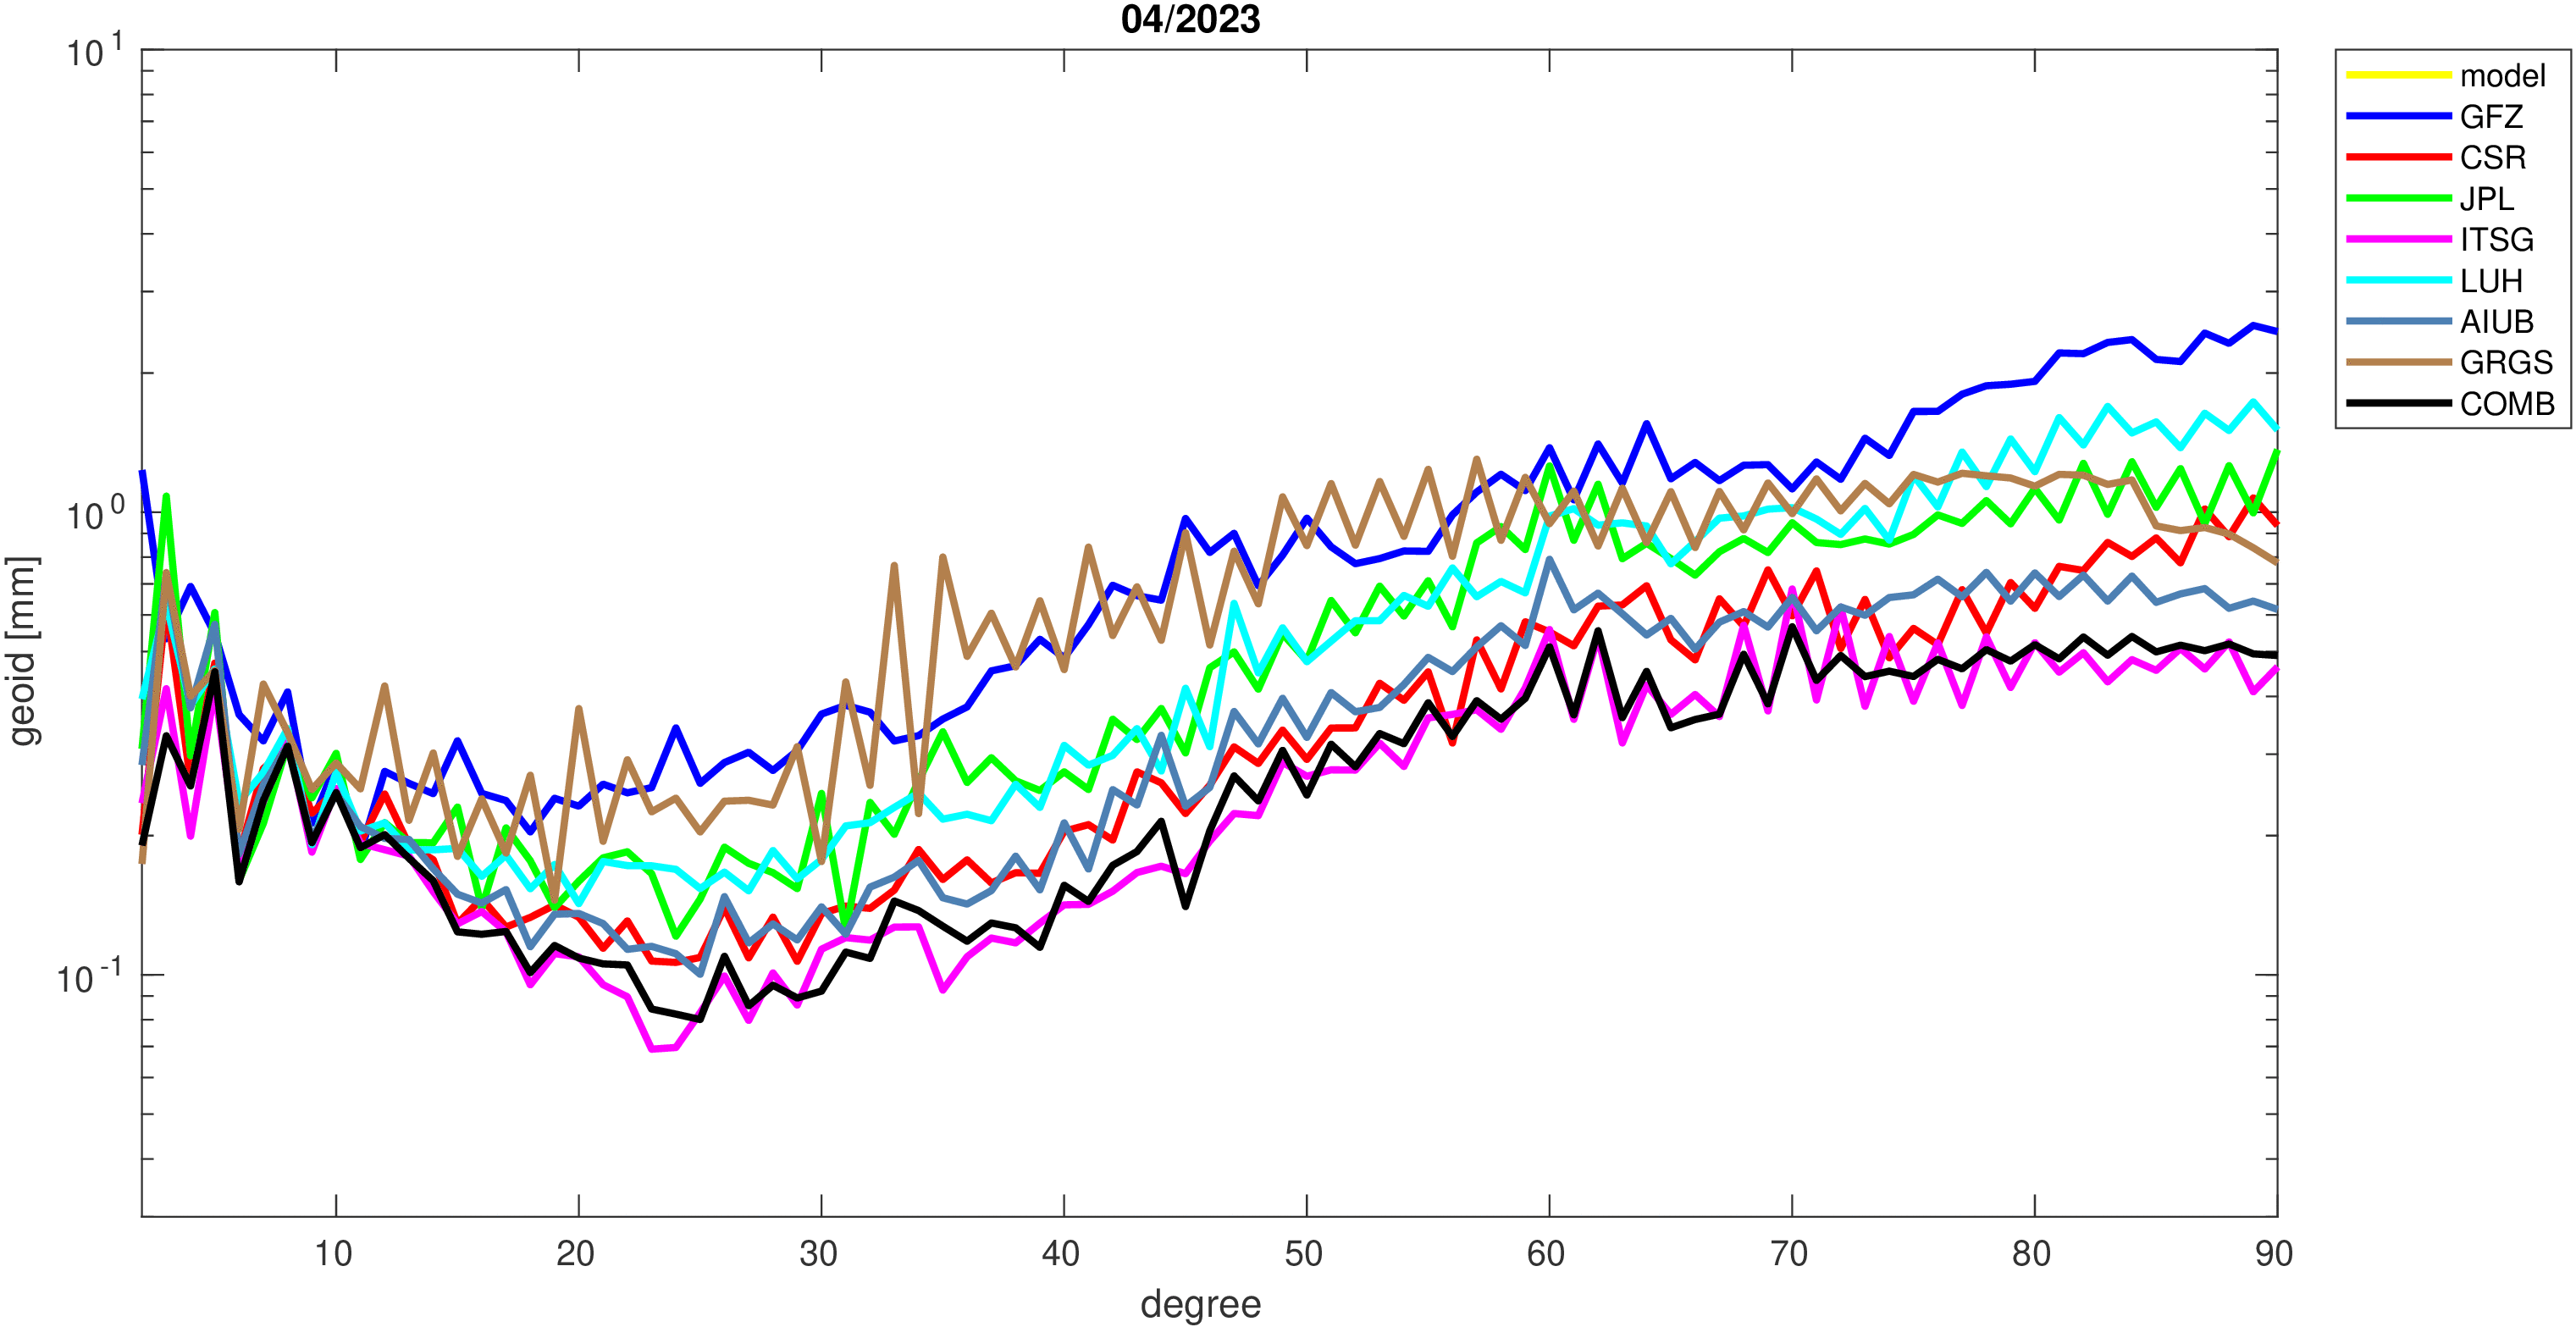
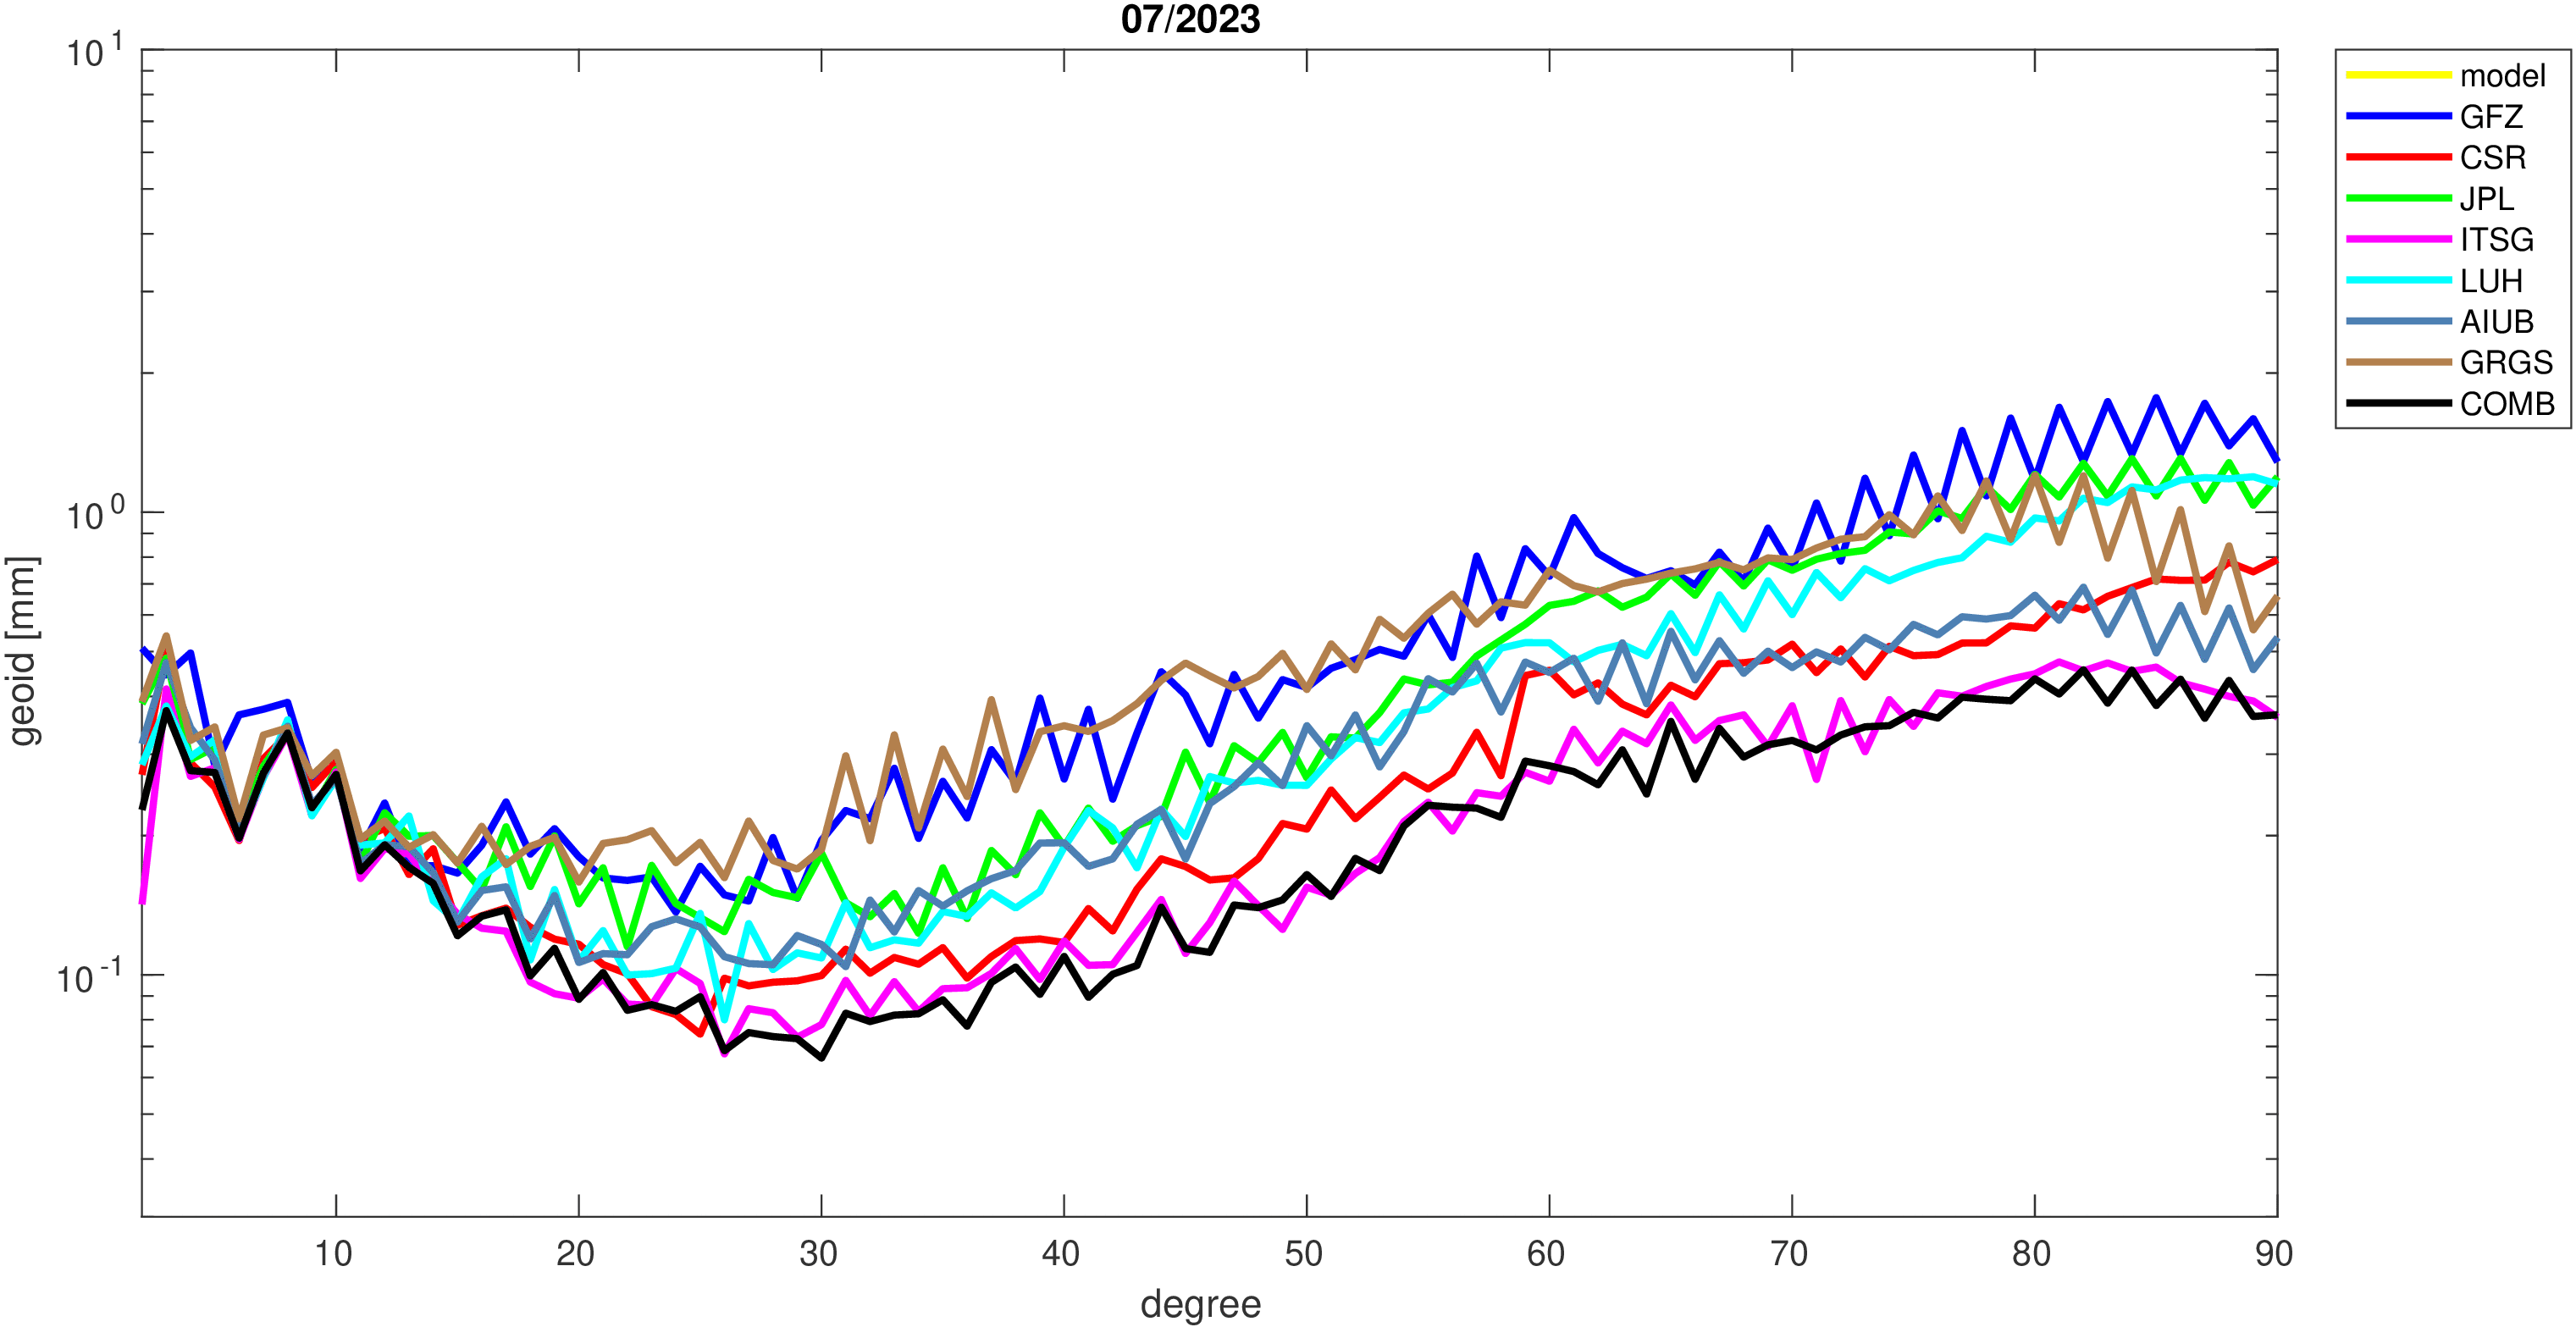
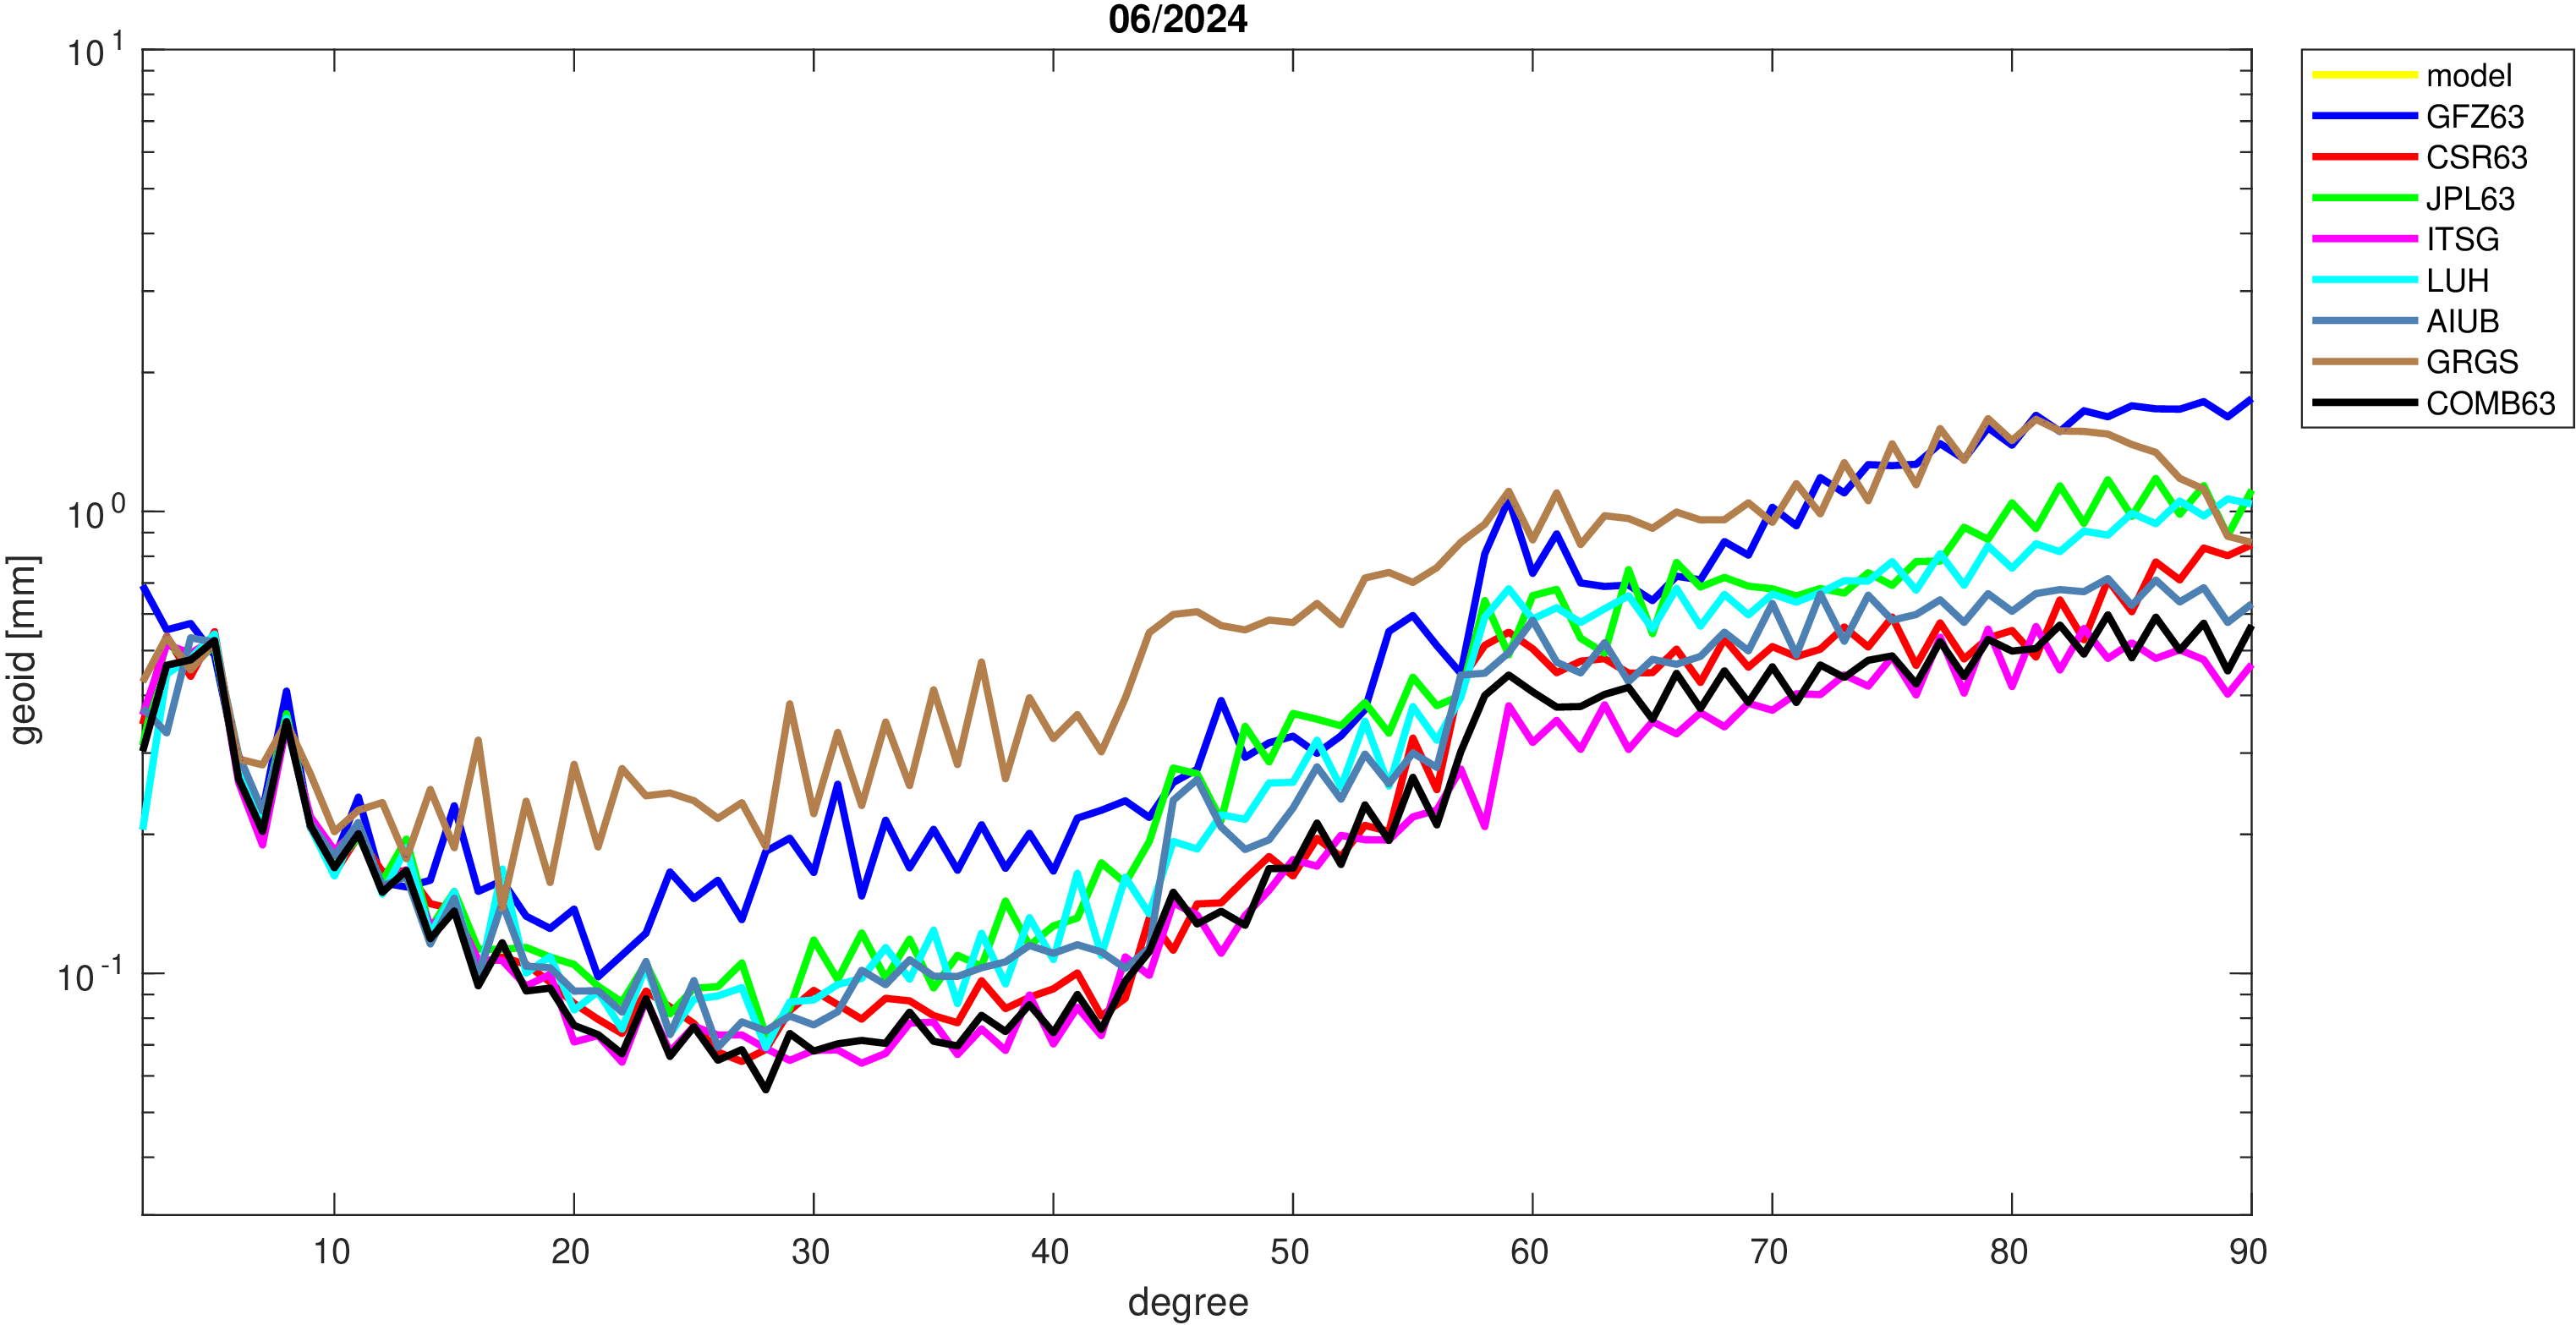
Monthly anomalies are derived by subtraction of a deterministic signal model (bias, trend, annual and semi-annual variations)
from the monthly solutions. The signal model is fitted to the monthly average solutions of the GRACE-FO time-series contributing
to the combination.
For each spherical harmonic coefficient an individual model is fitted.
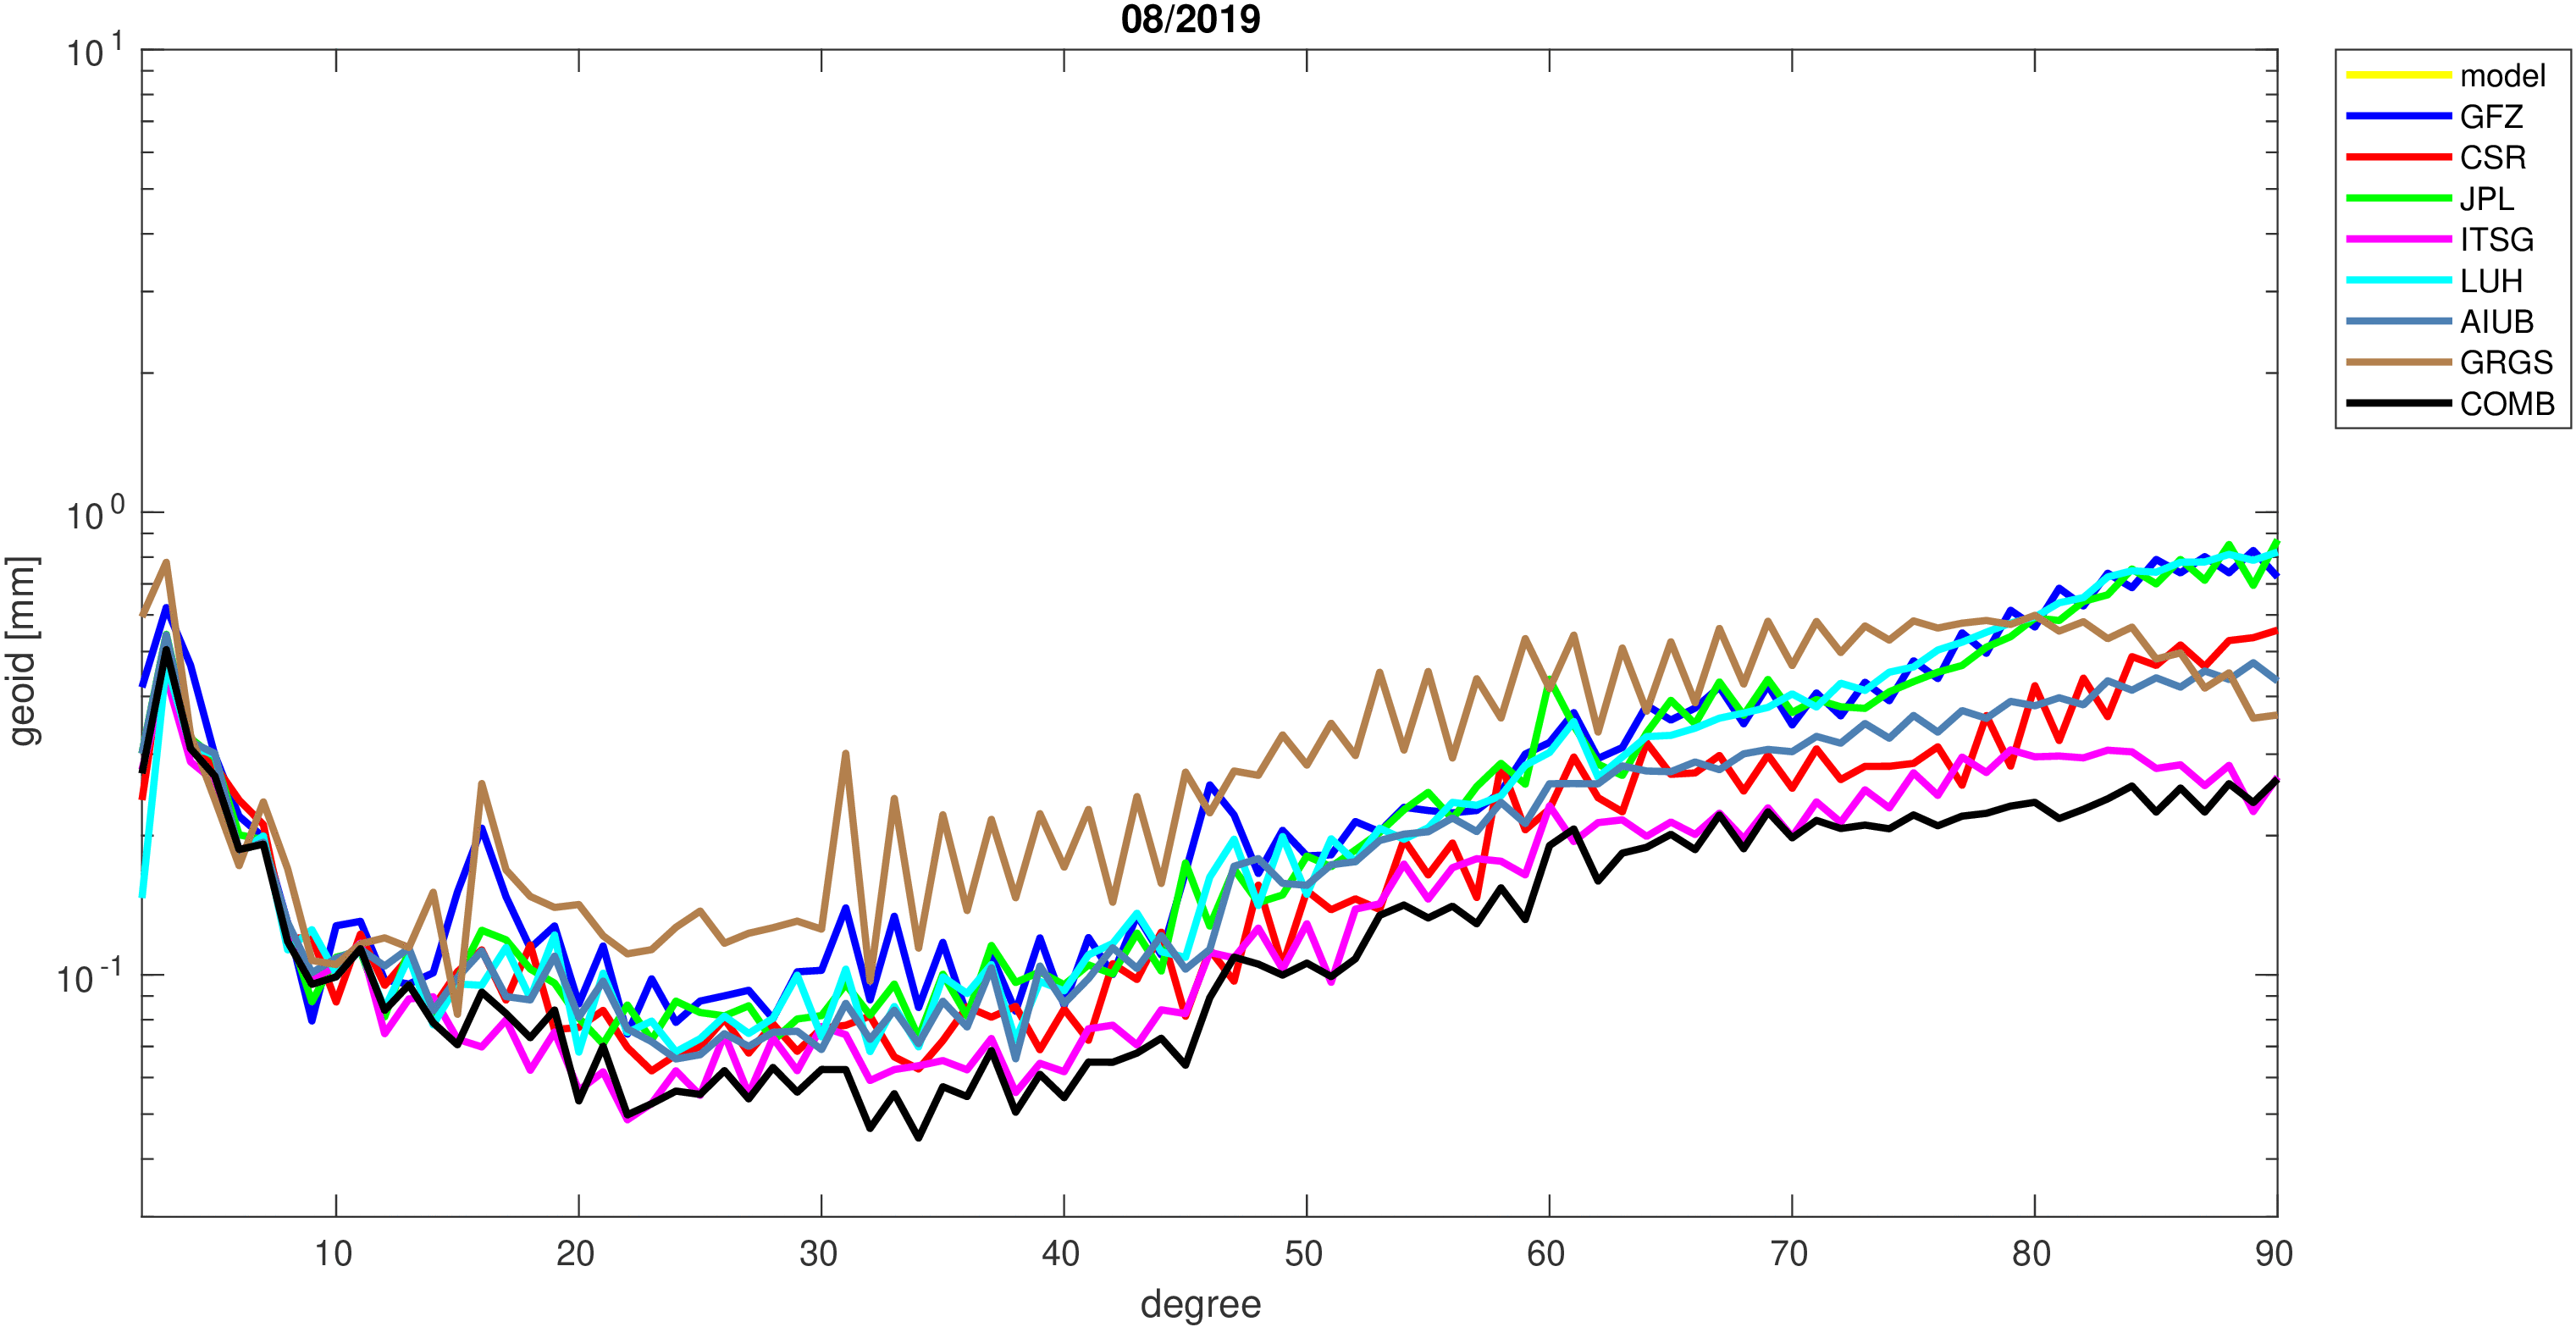
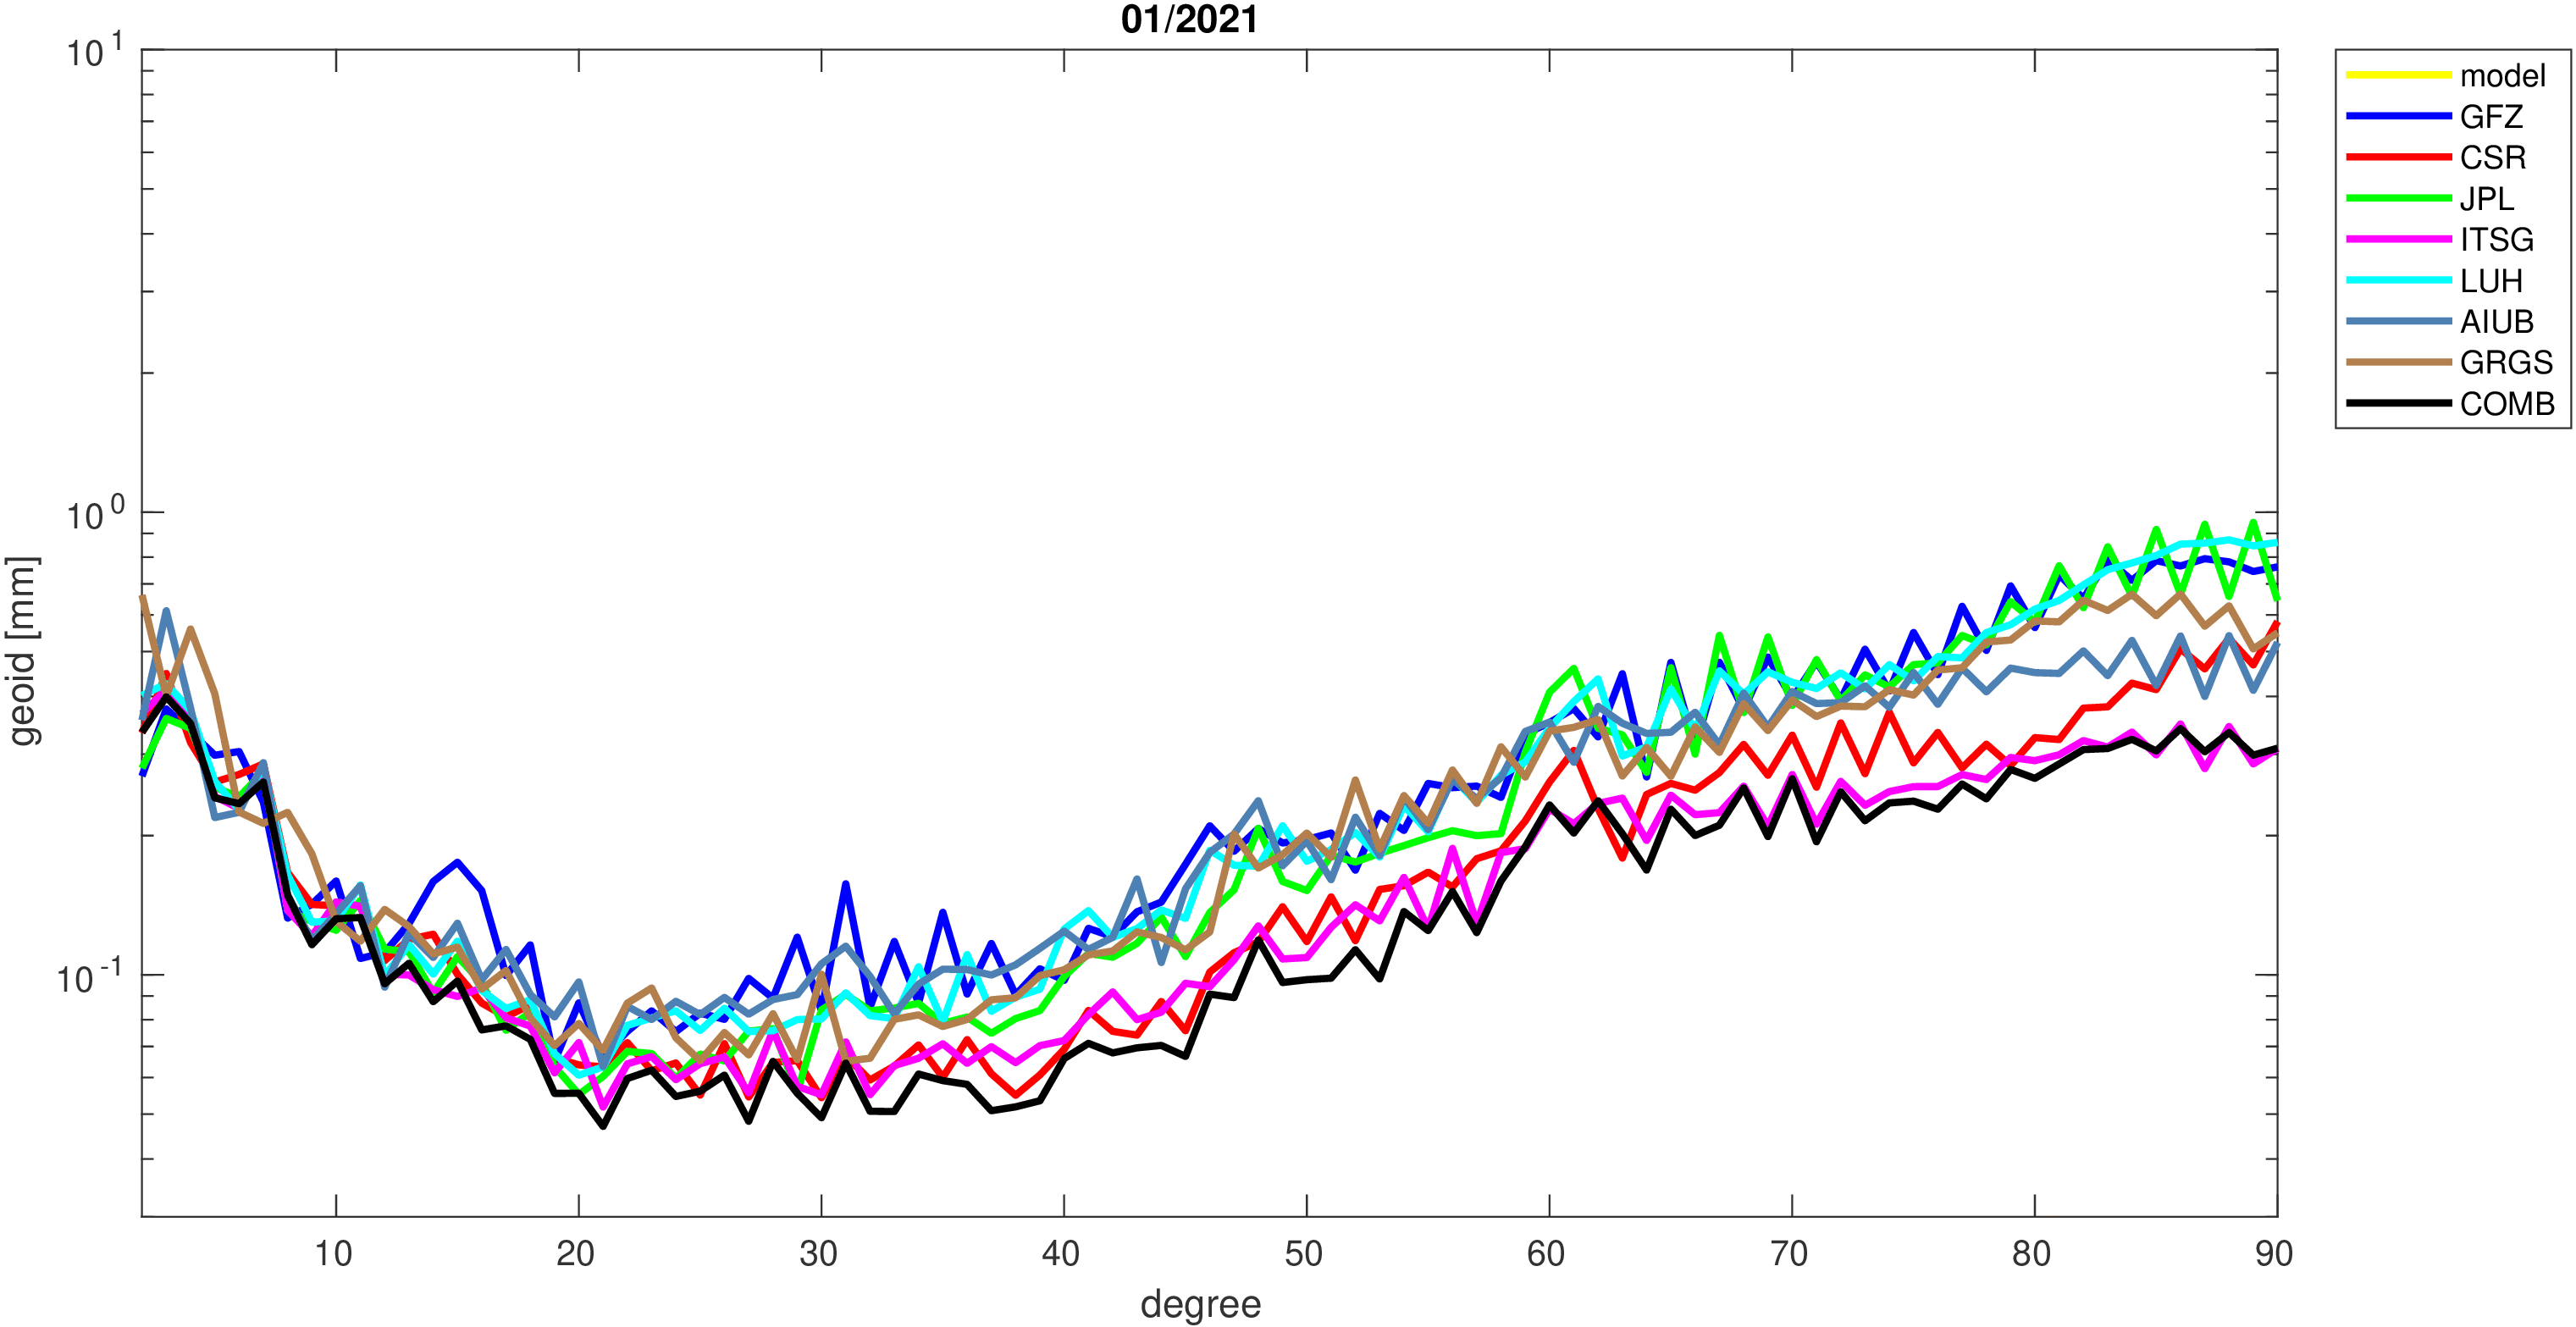
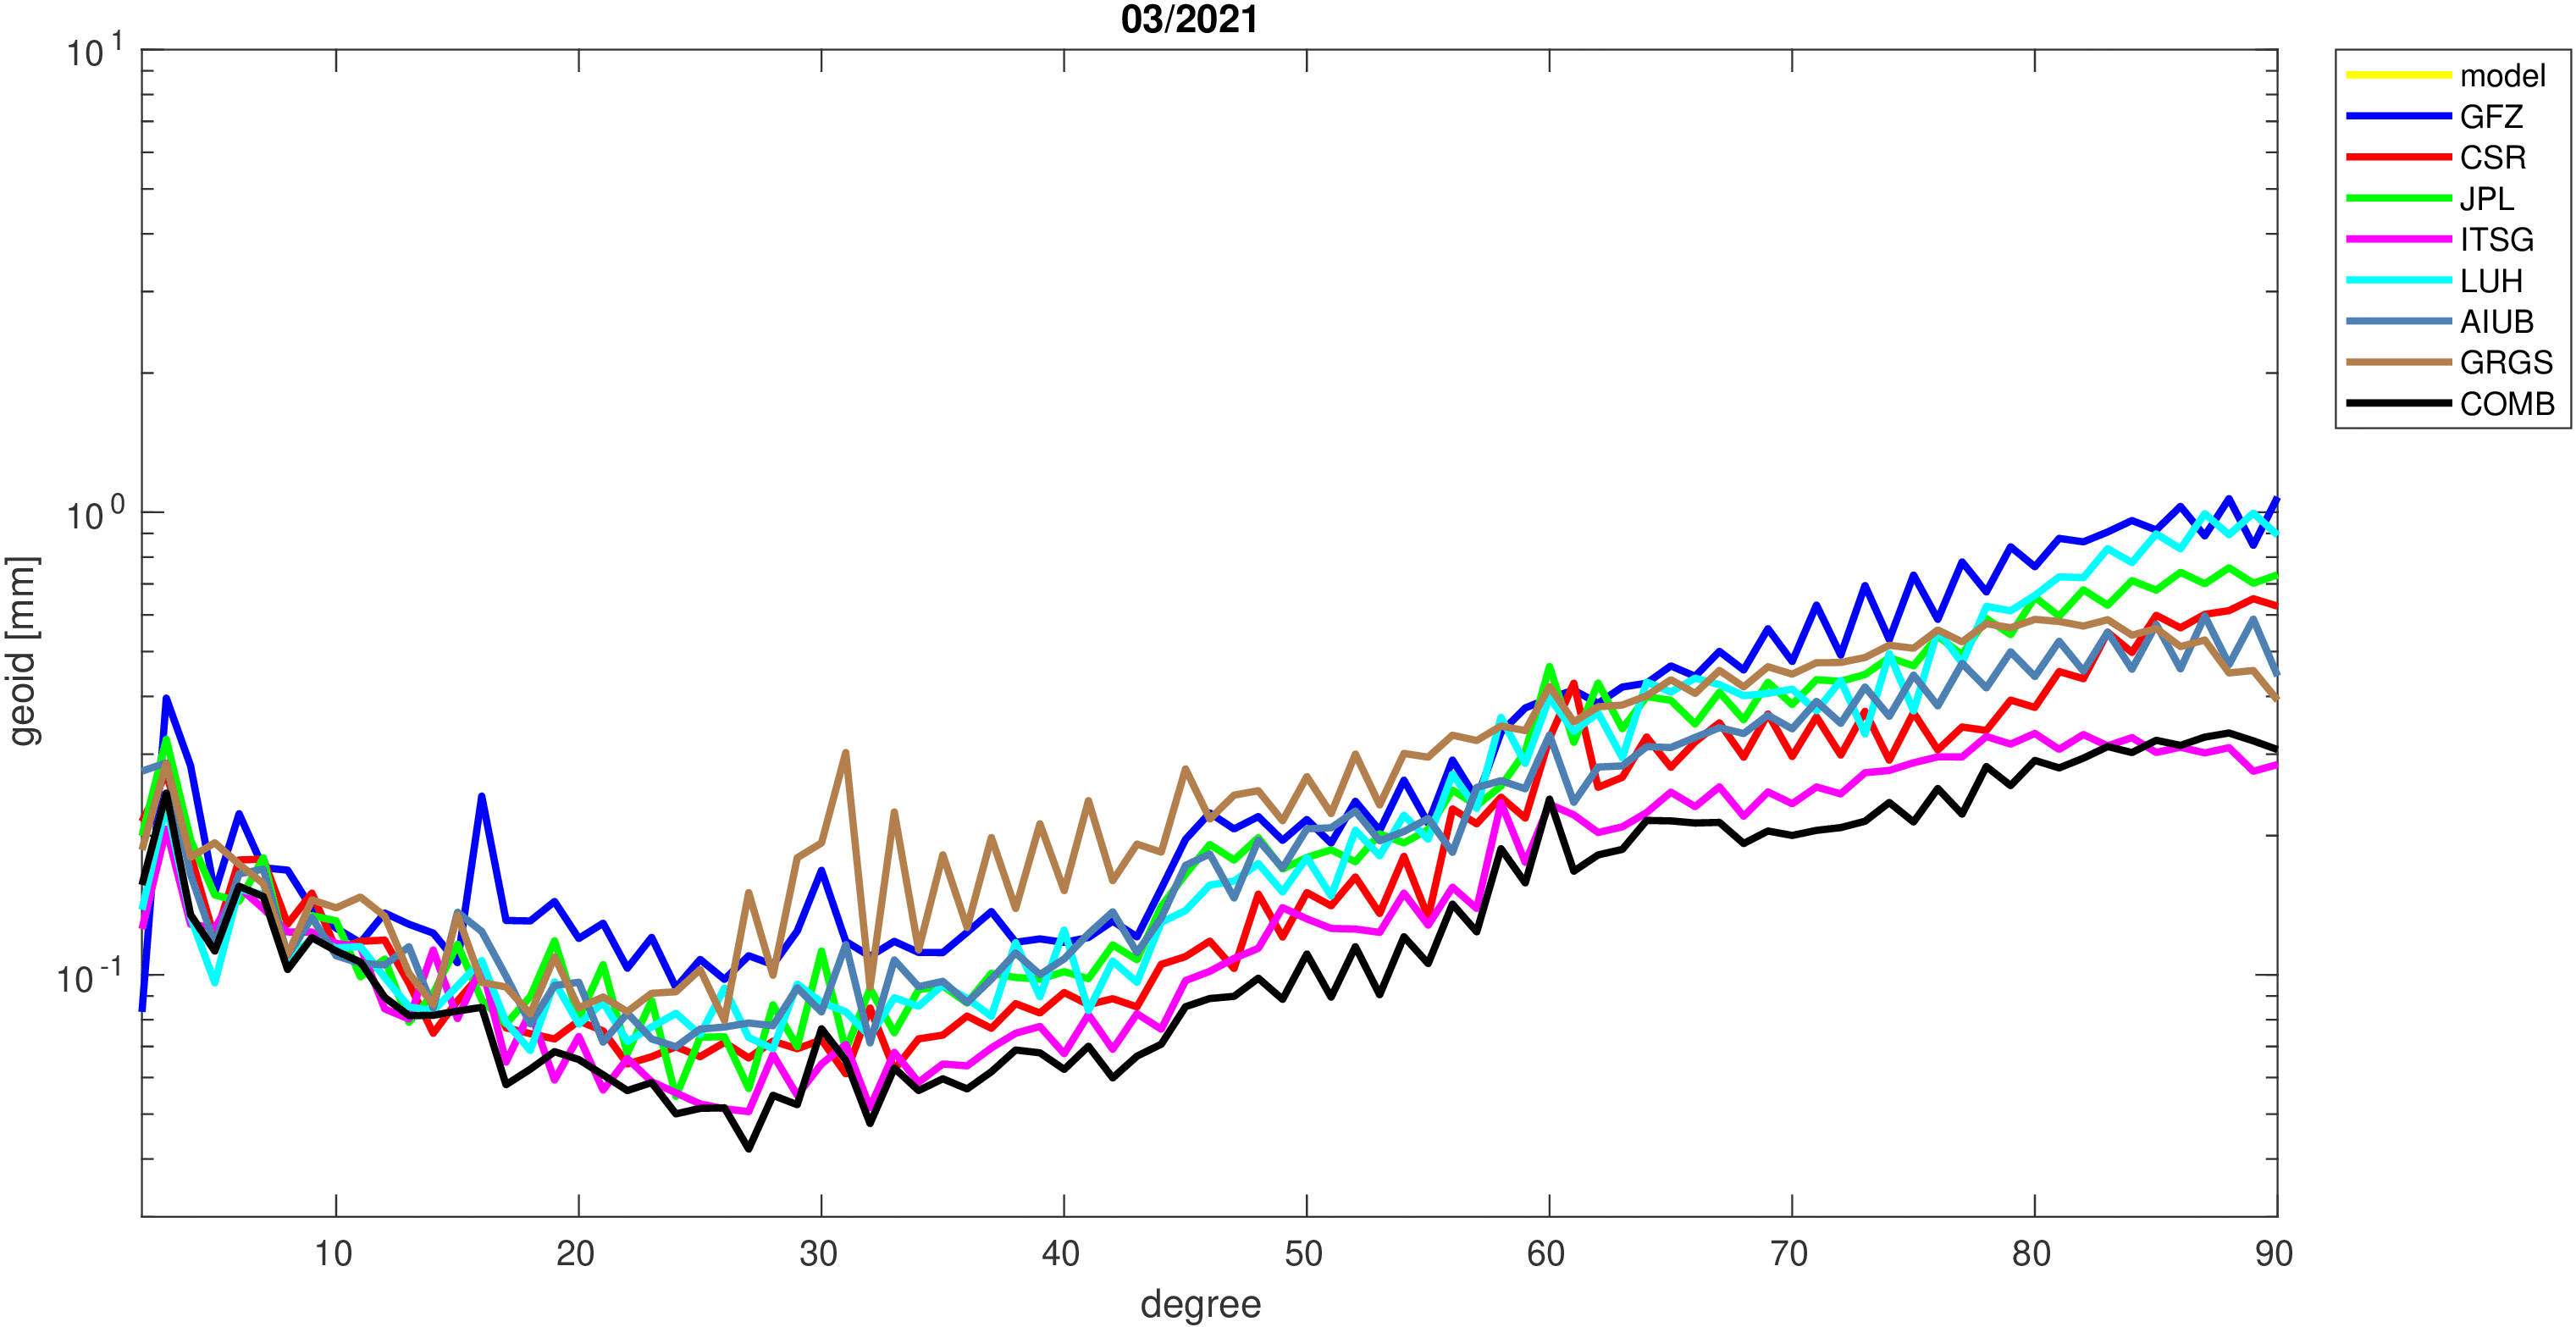
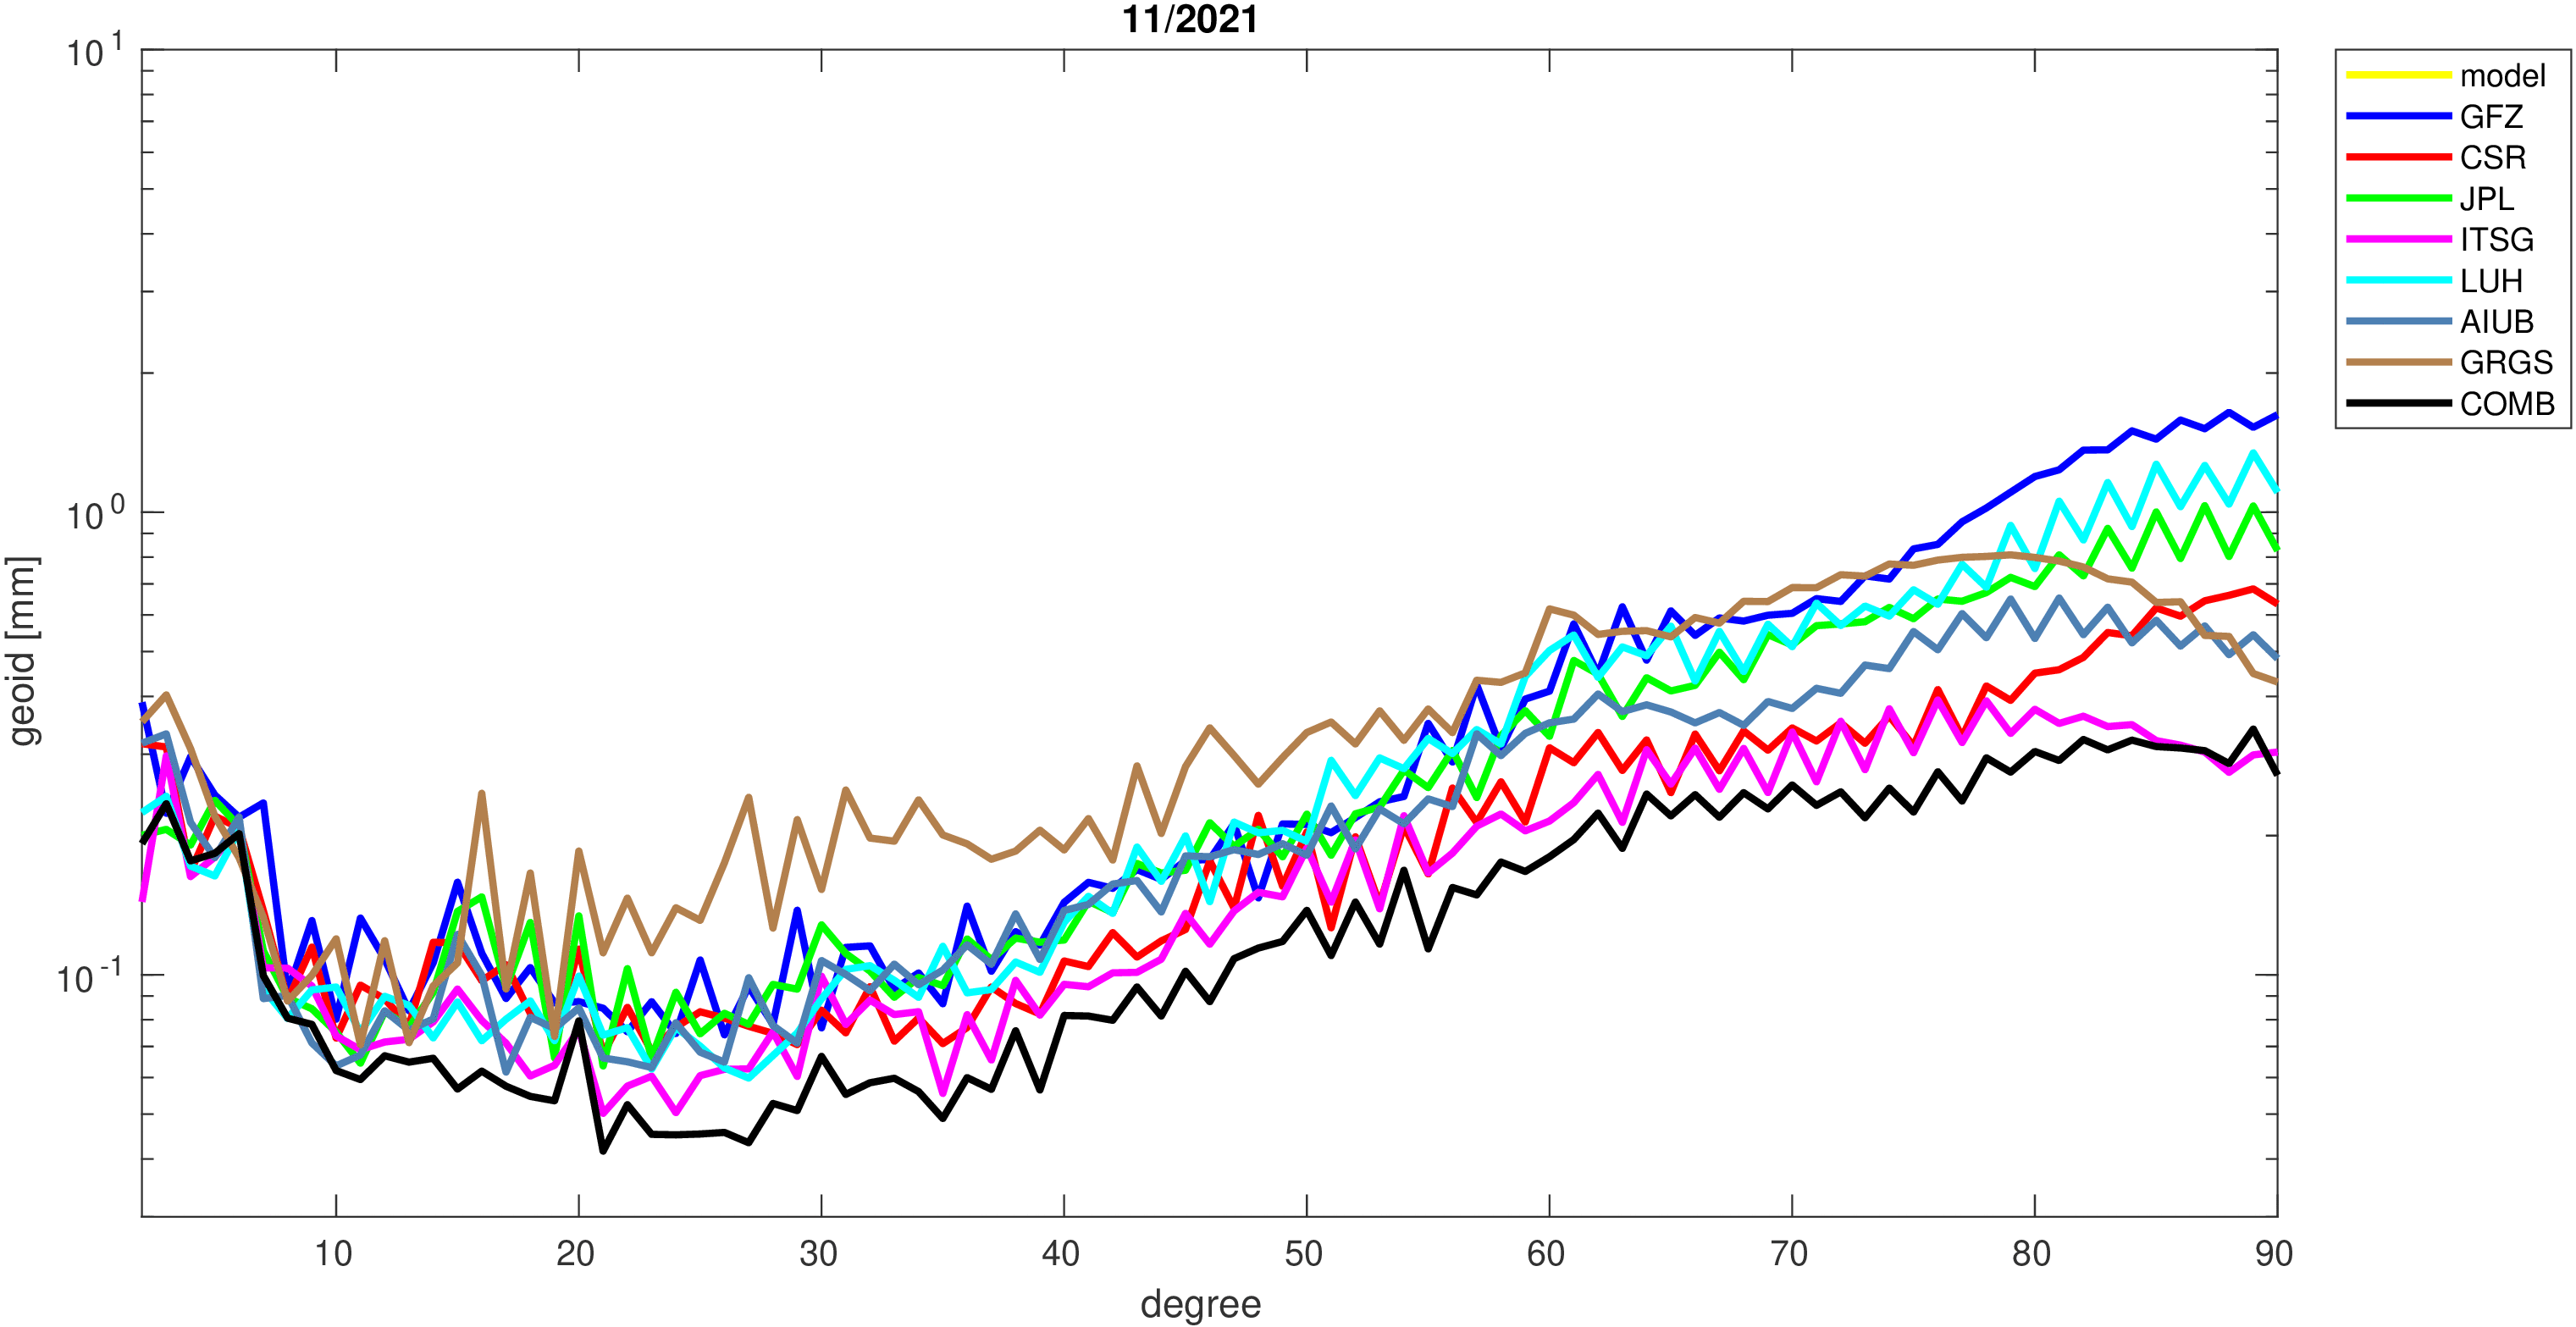
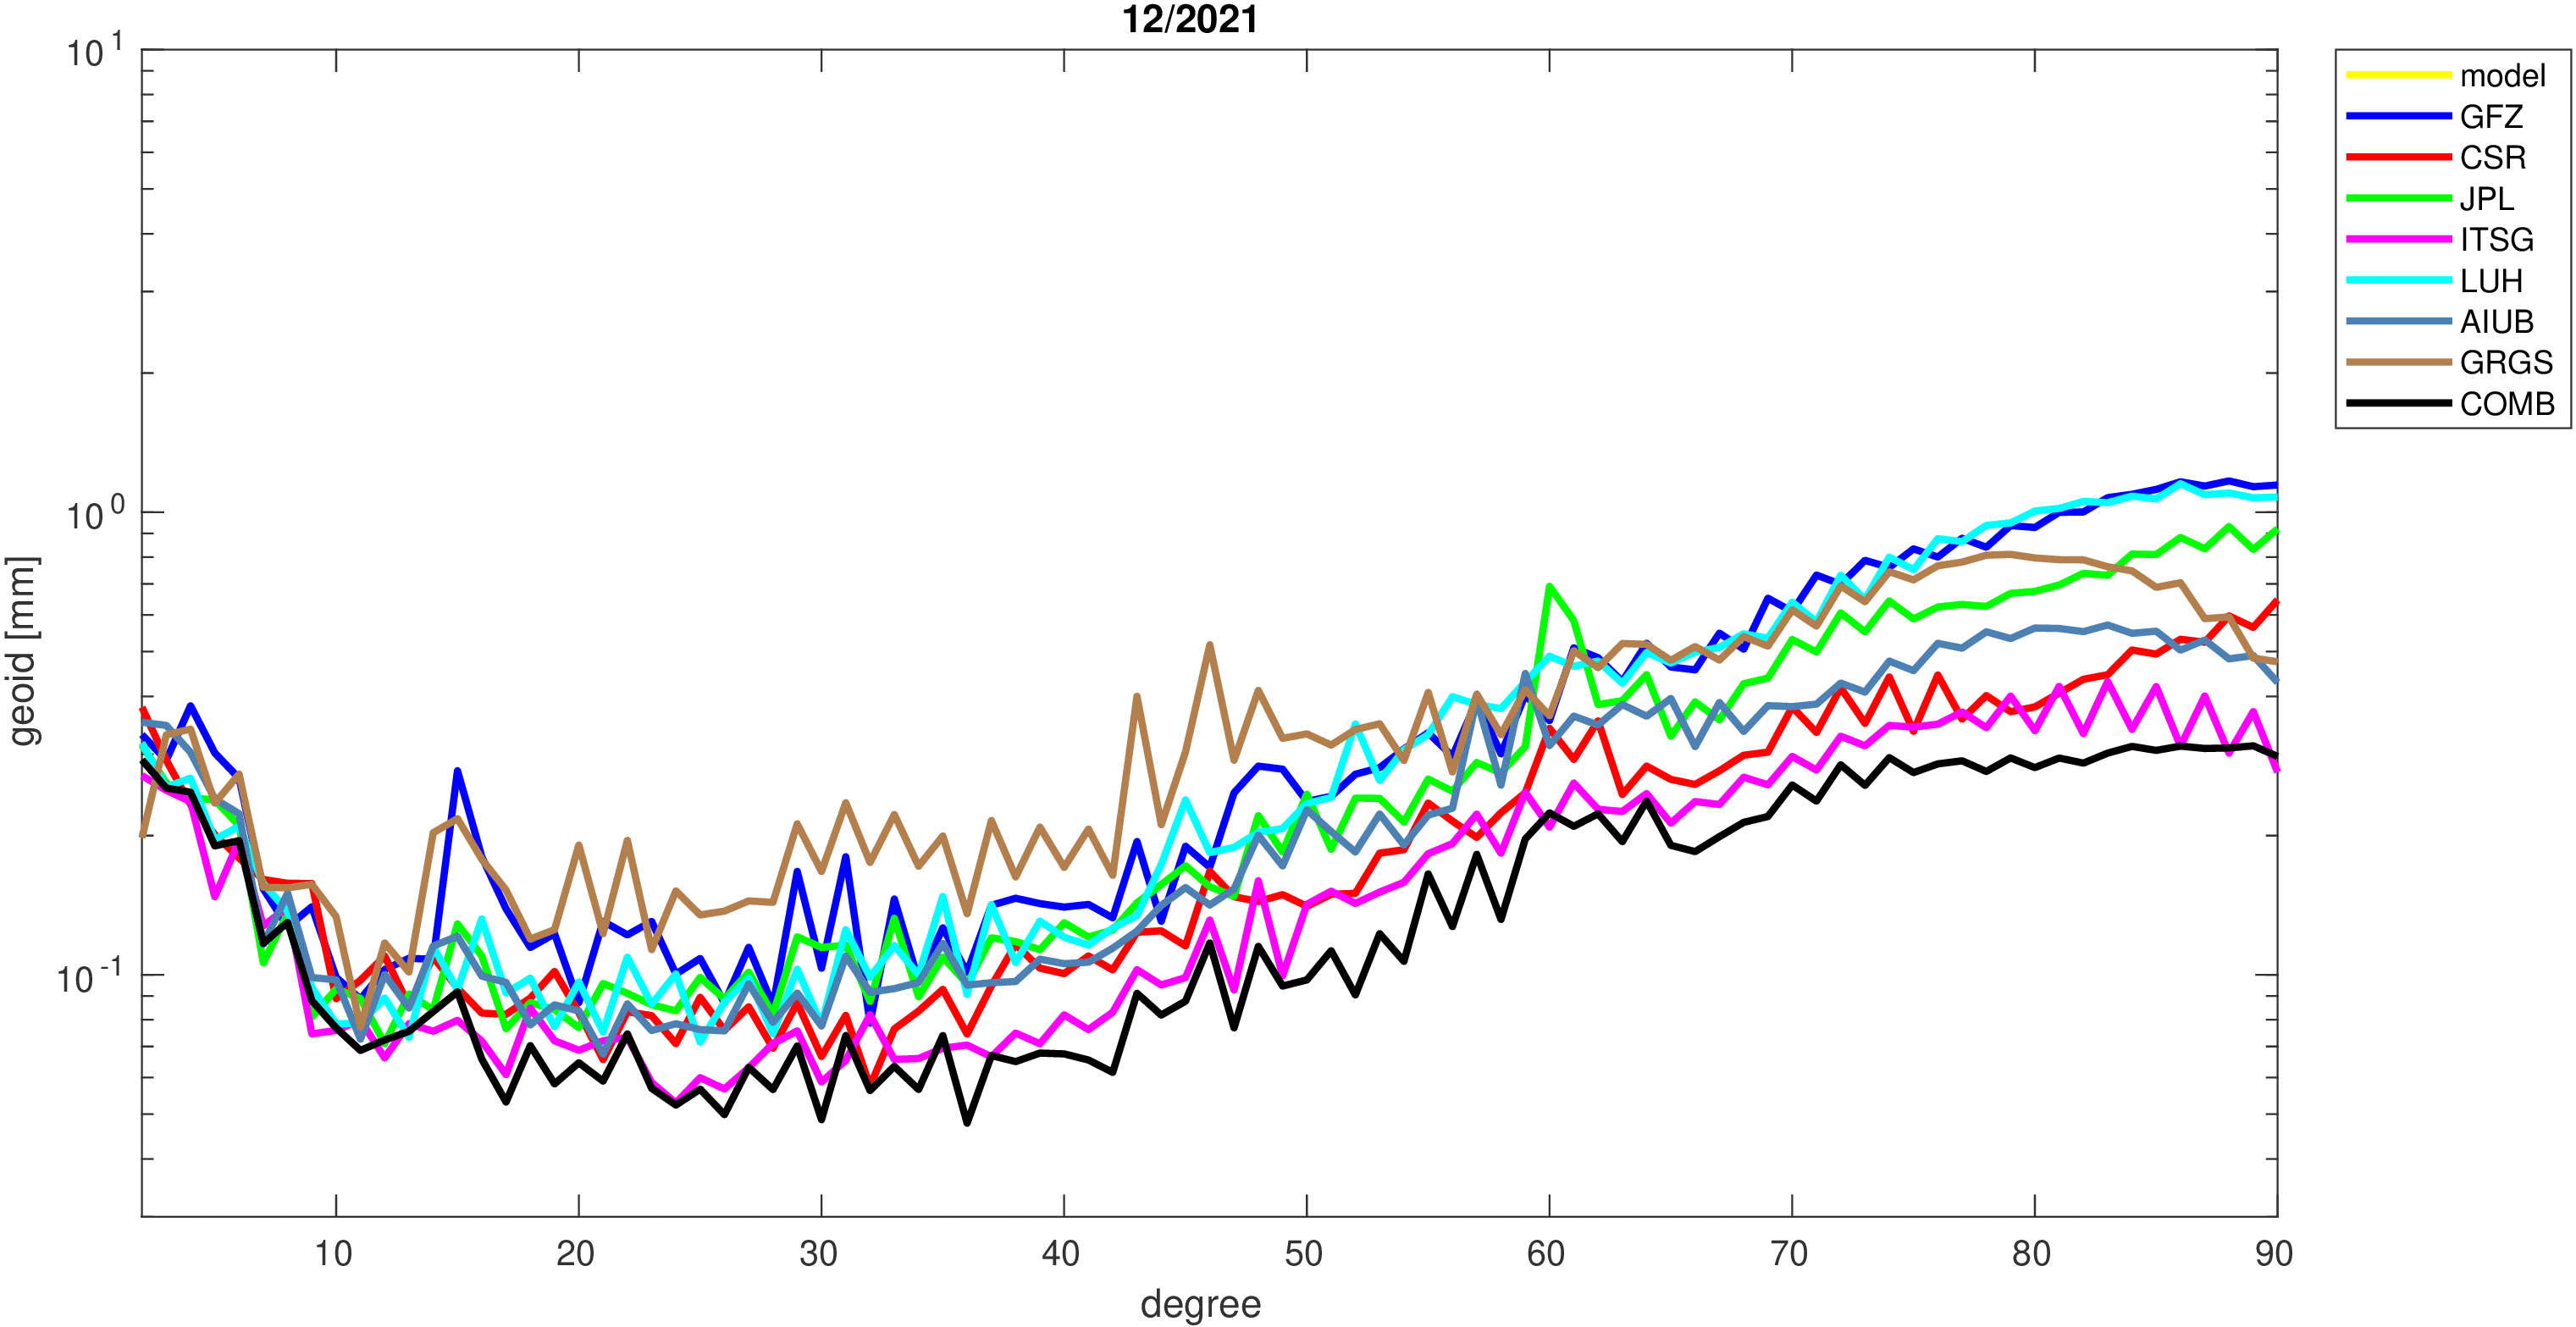
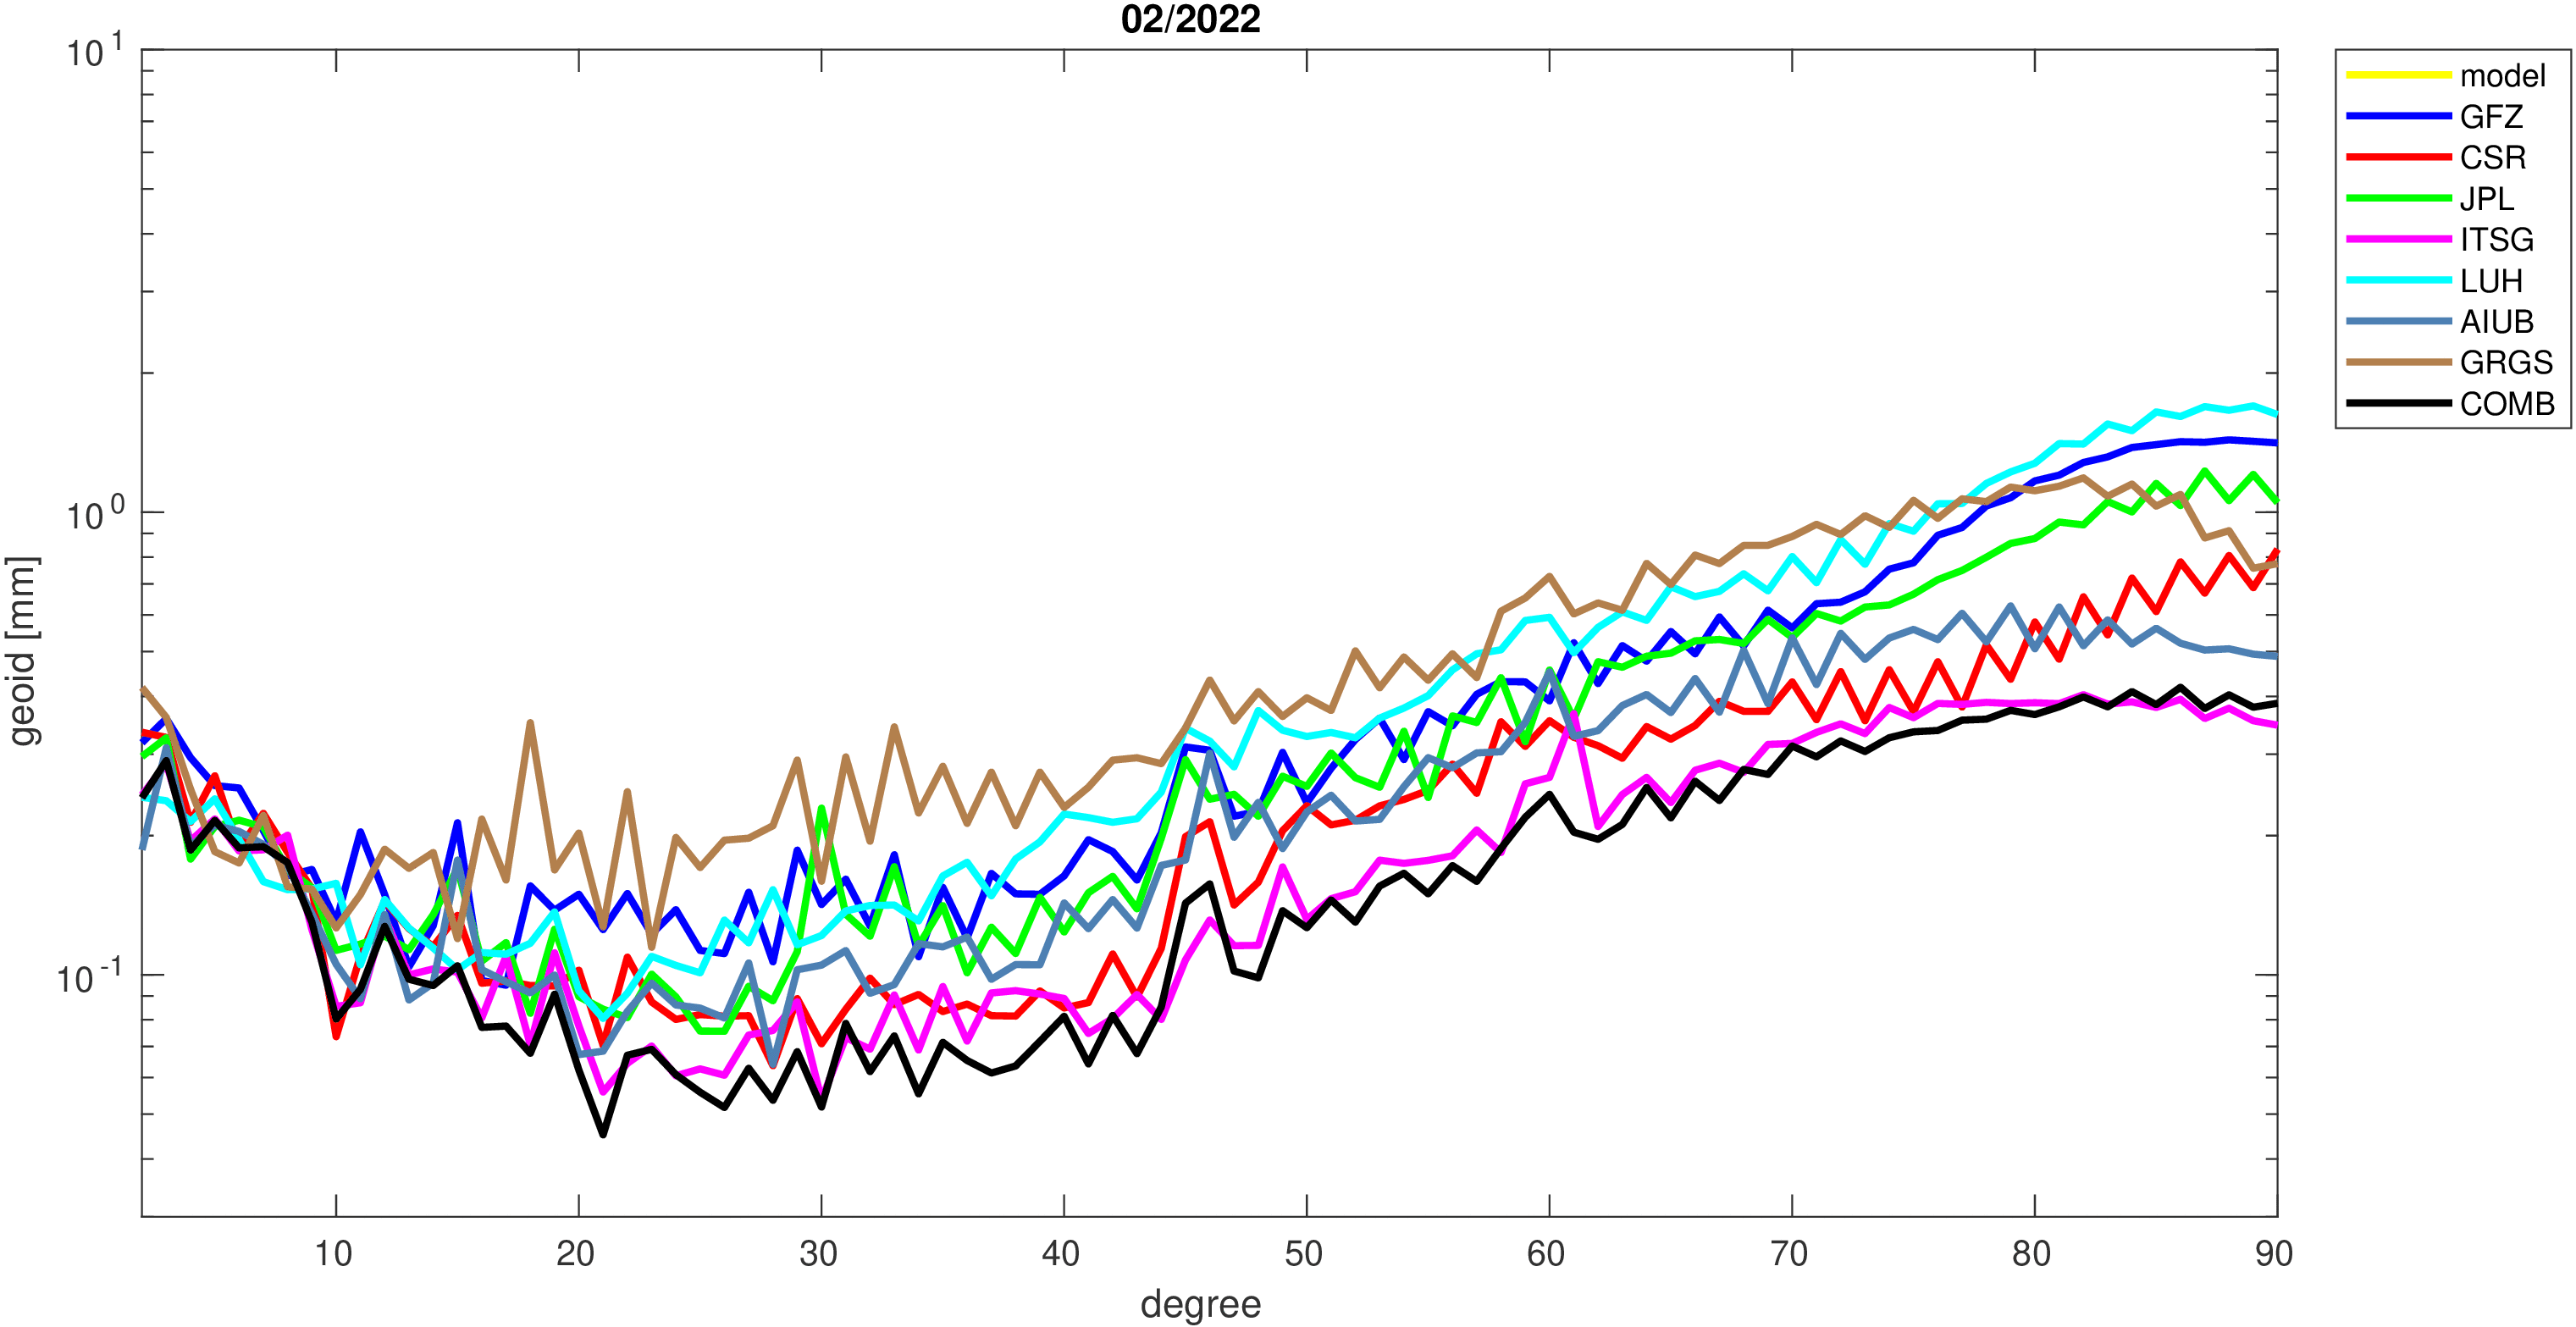
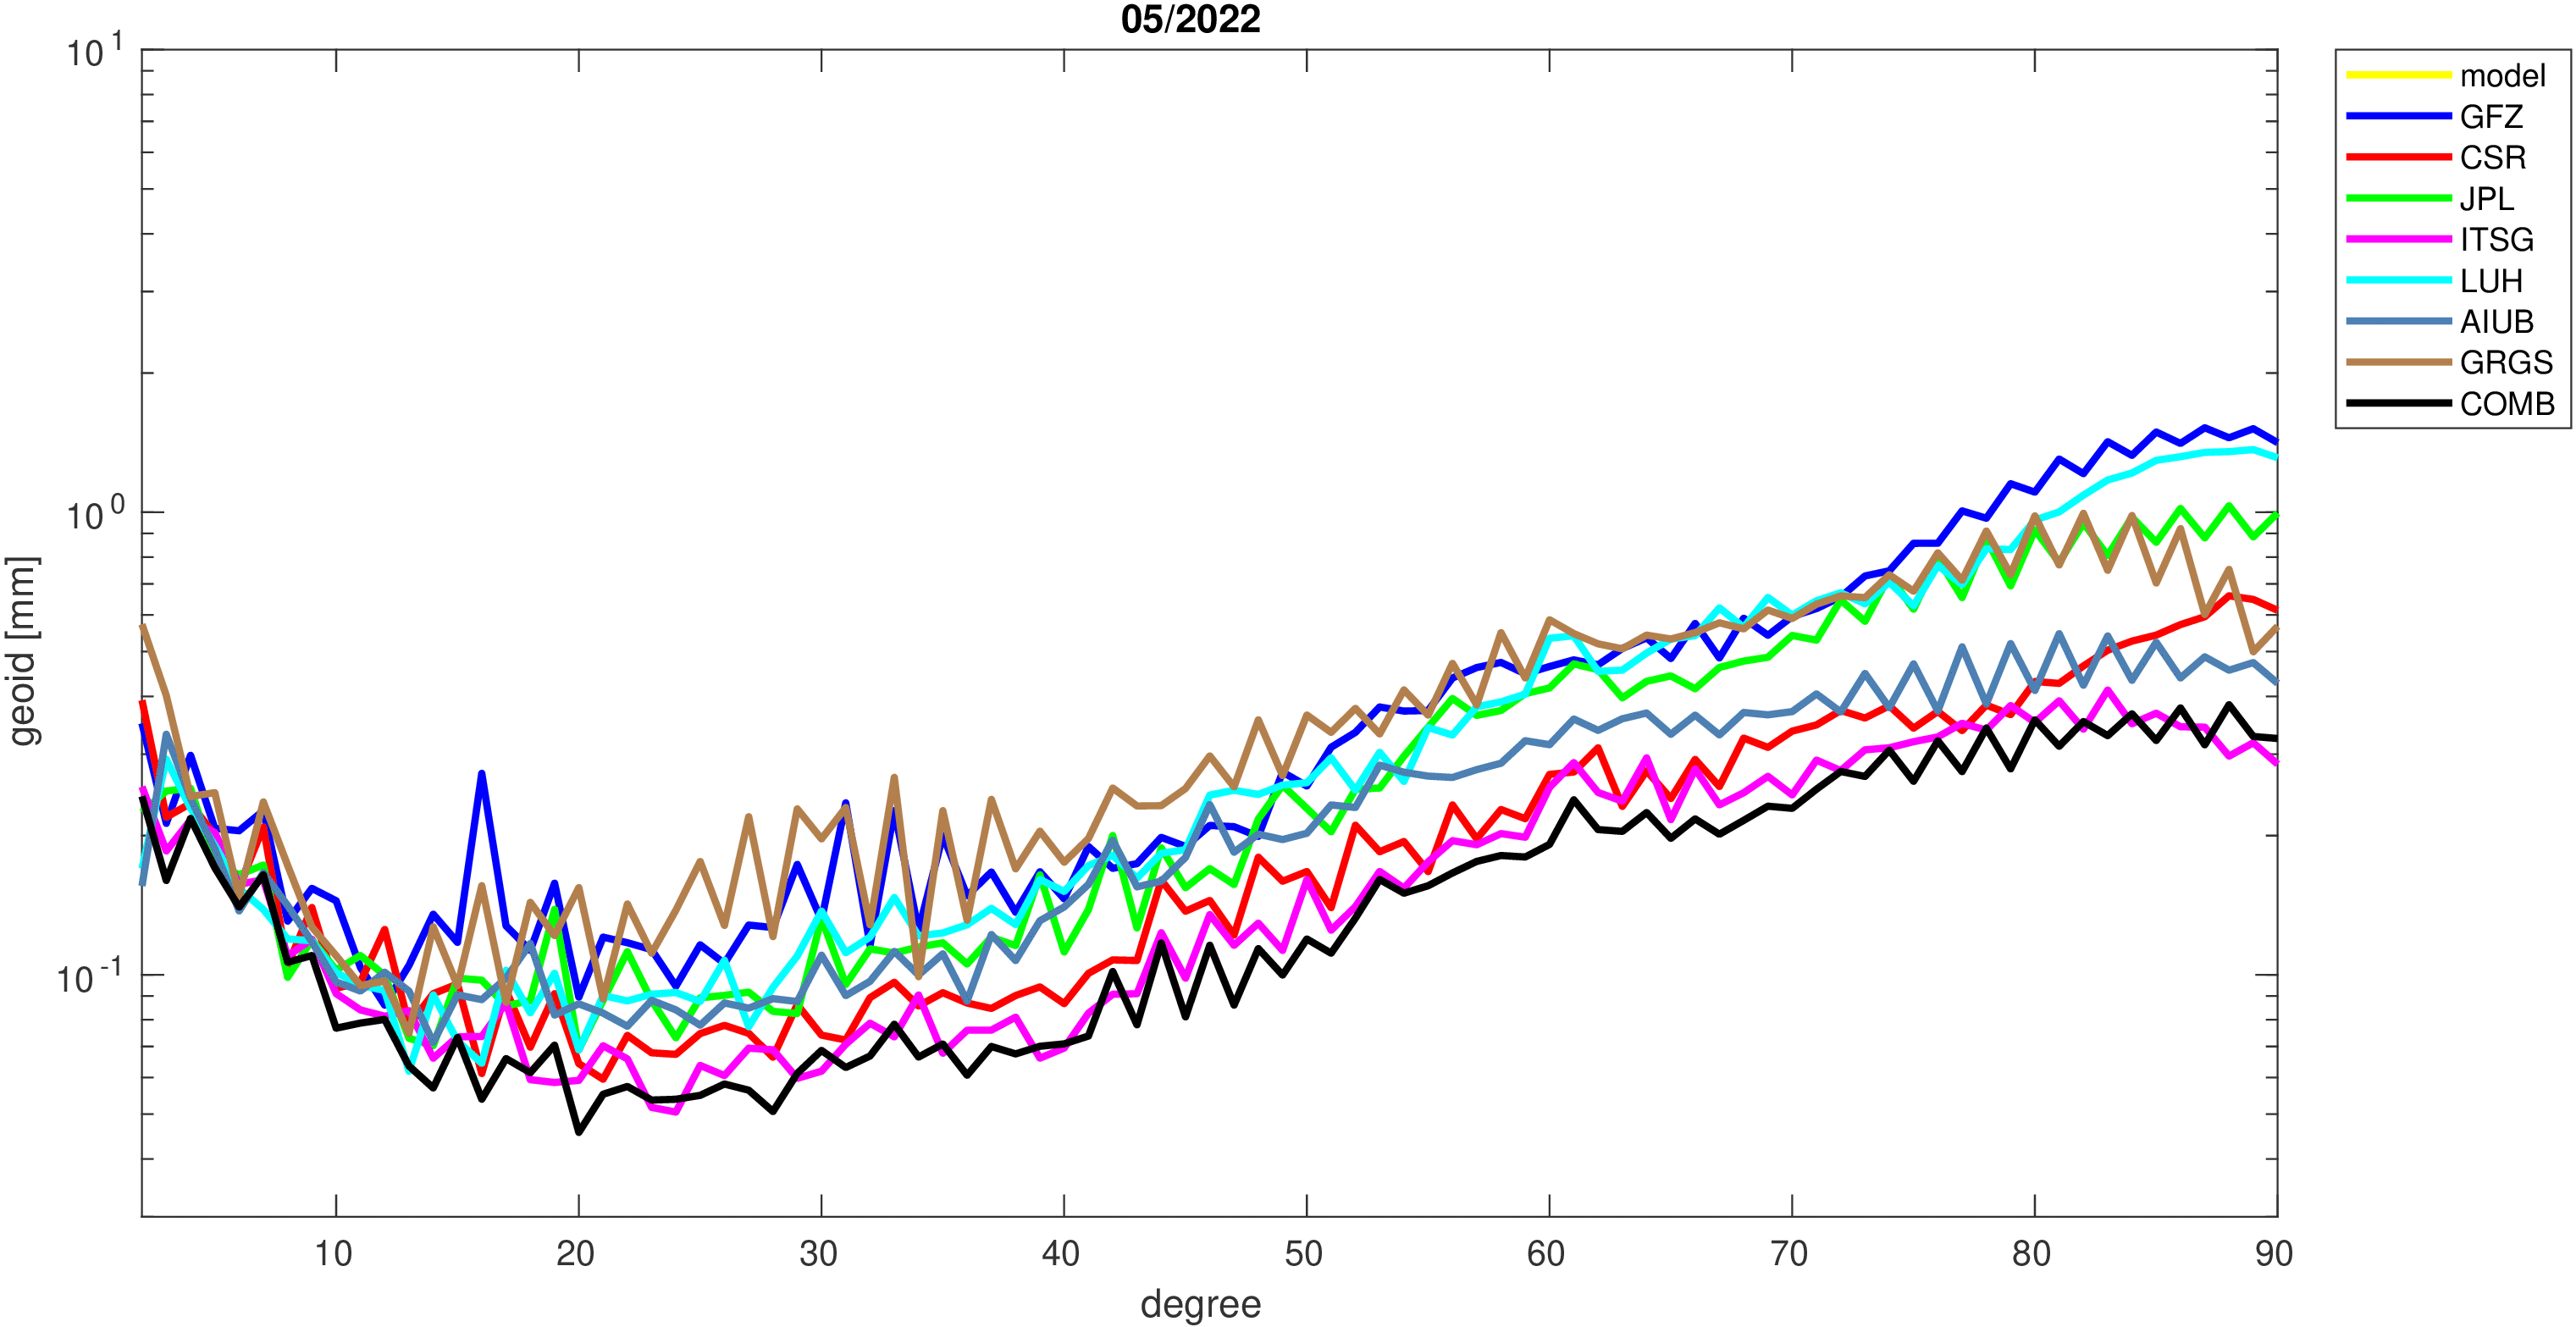
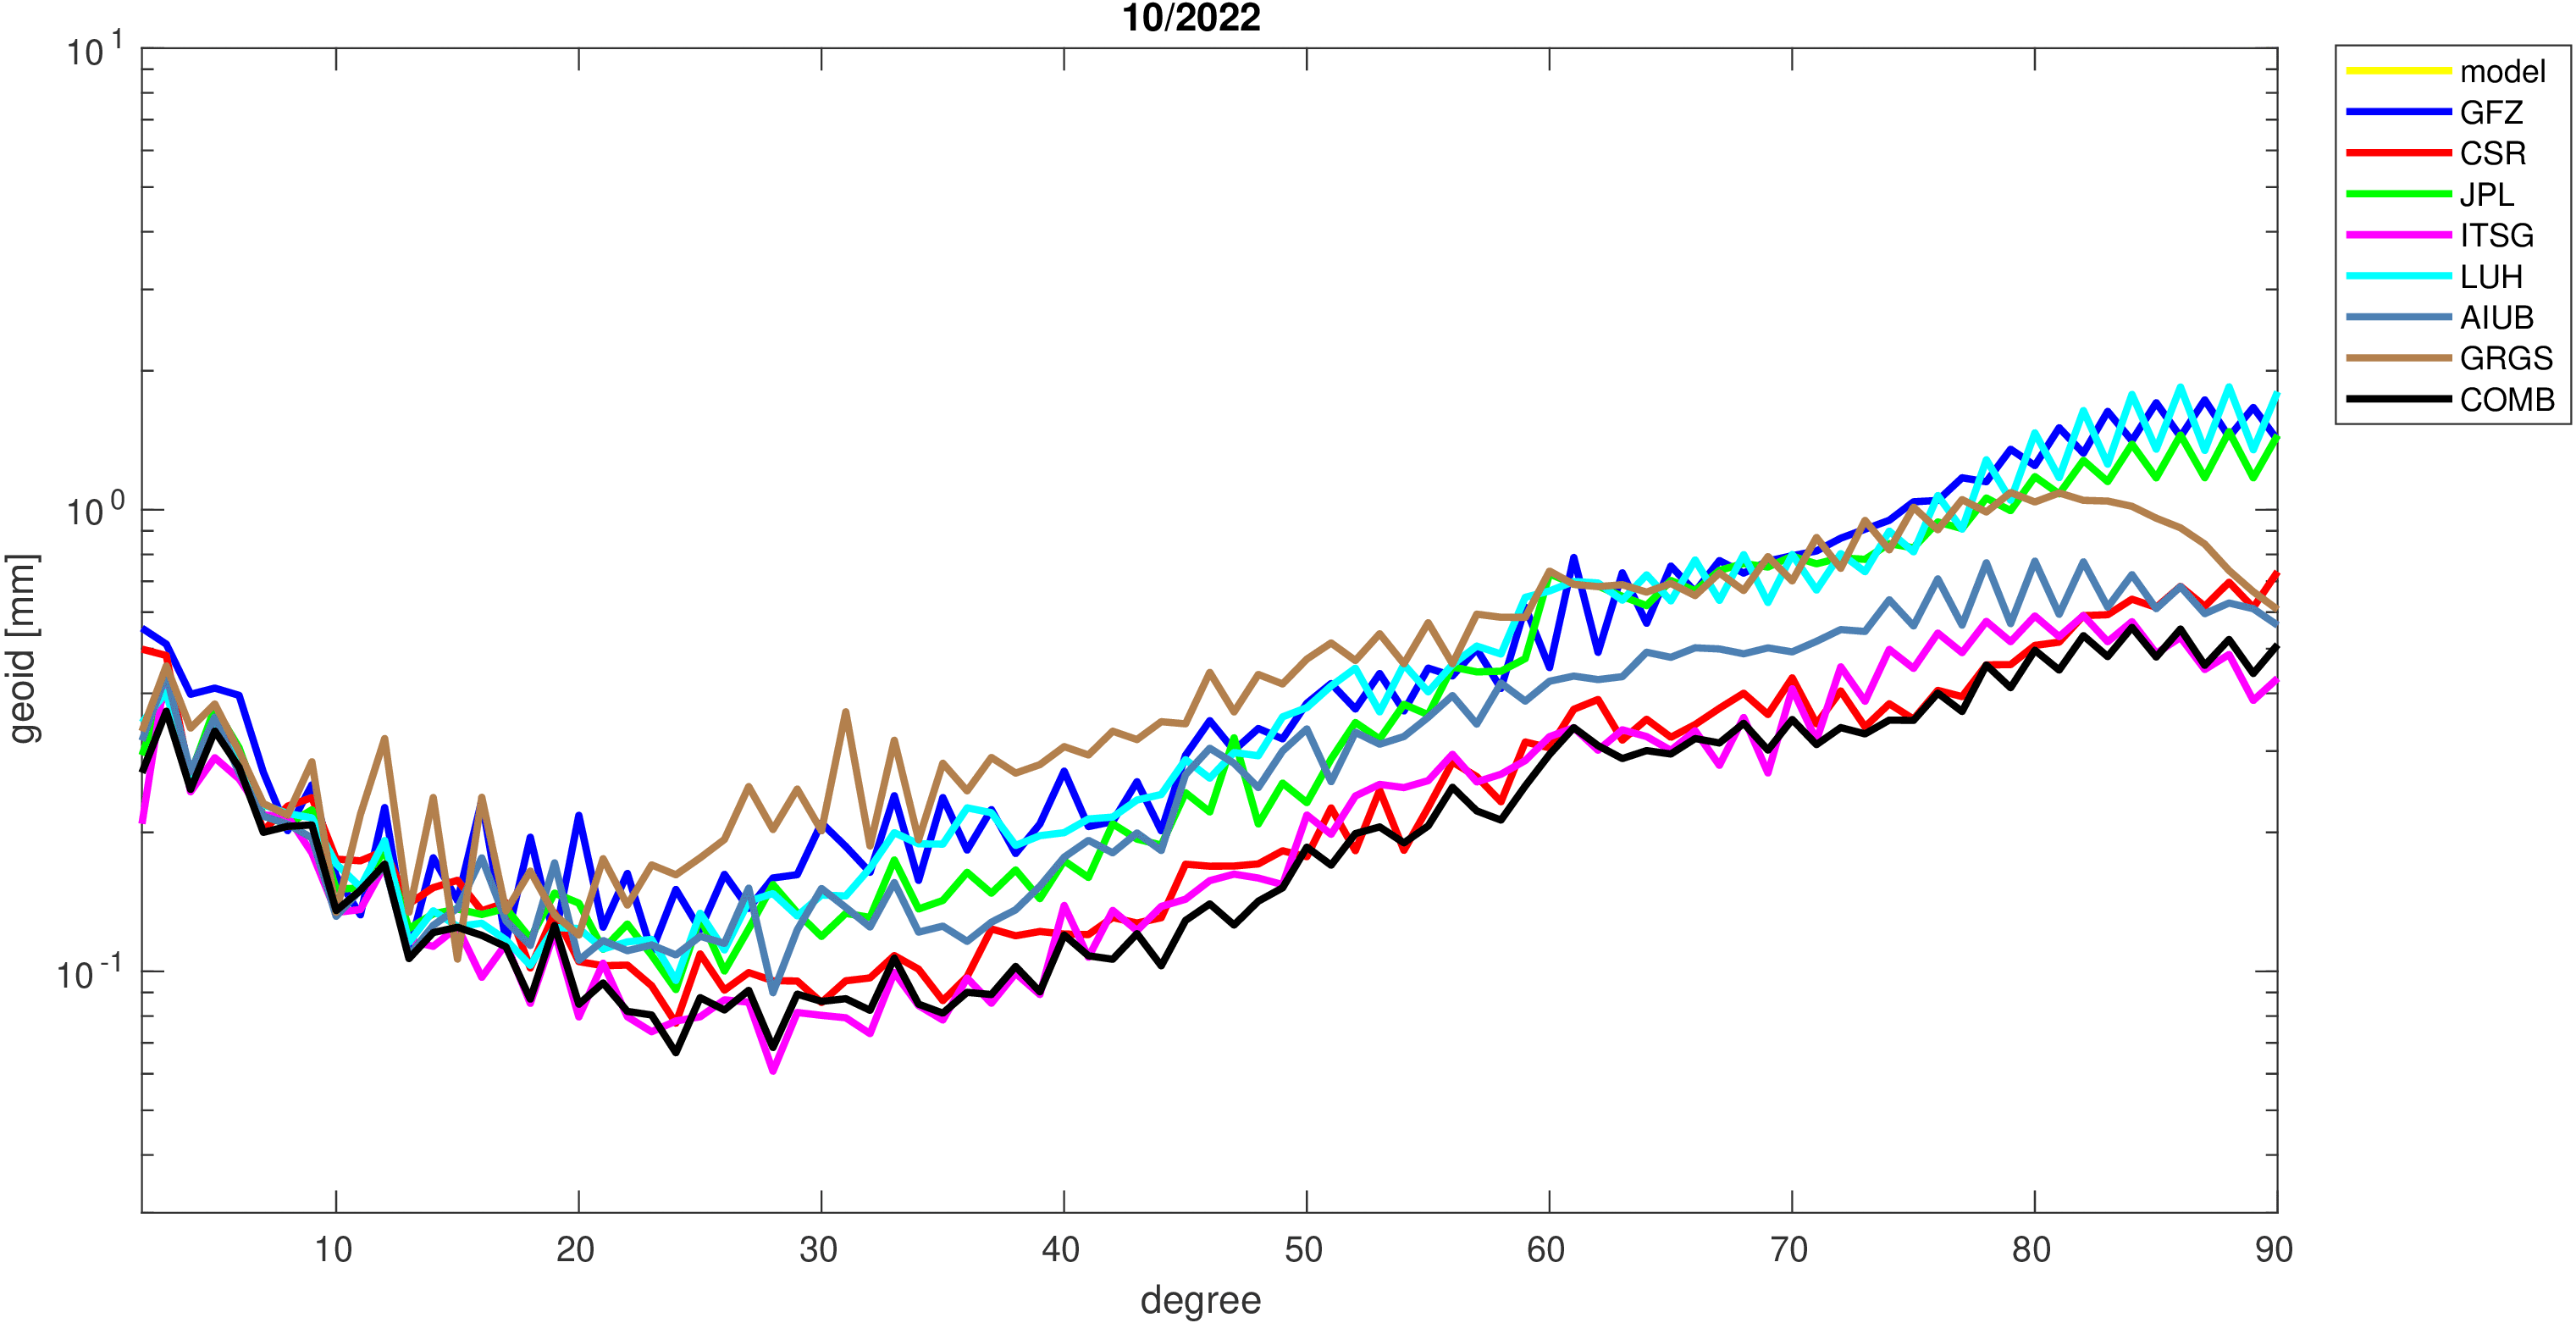
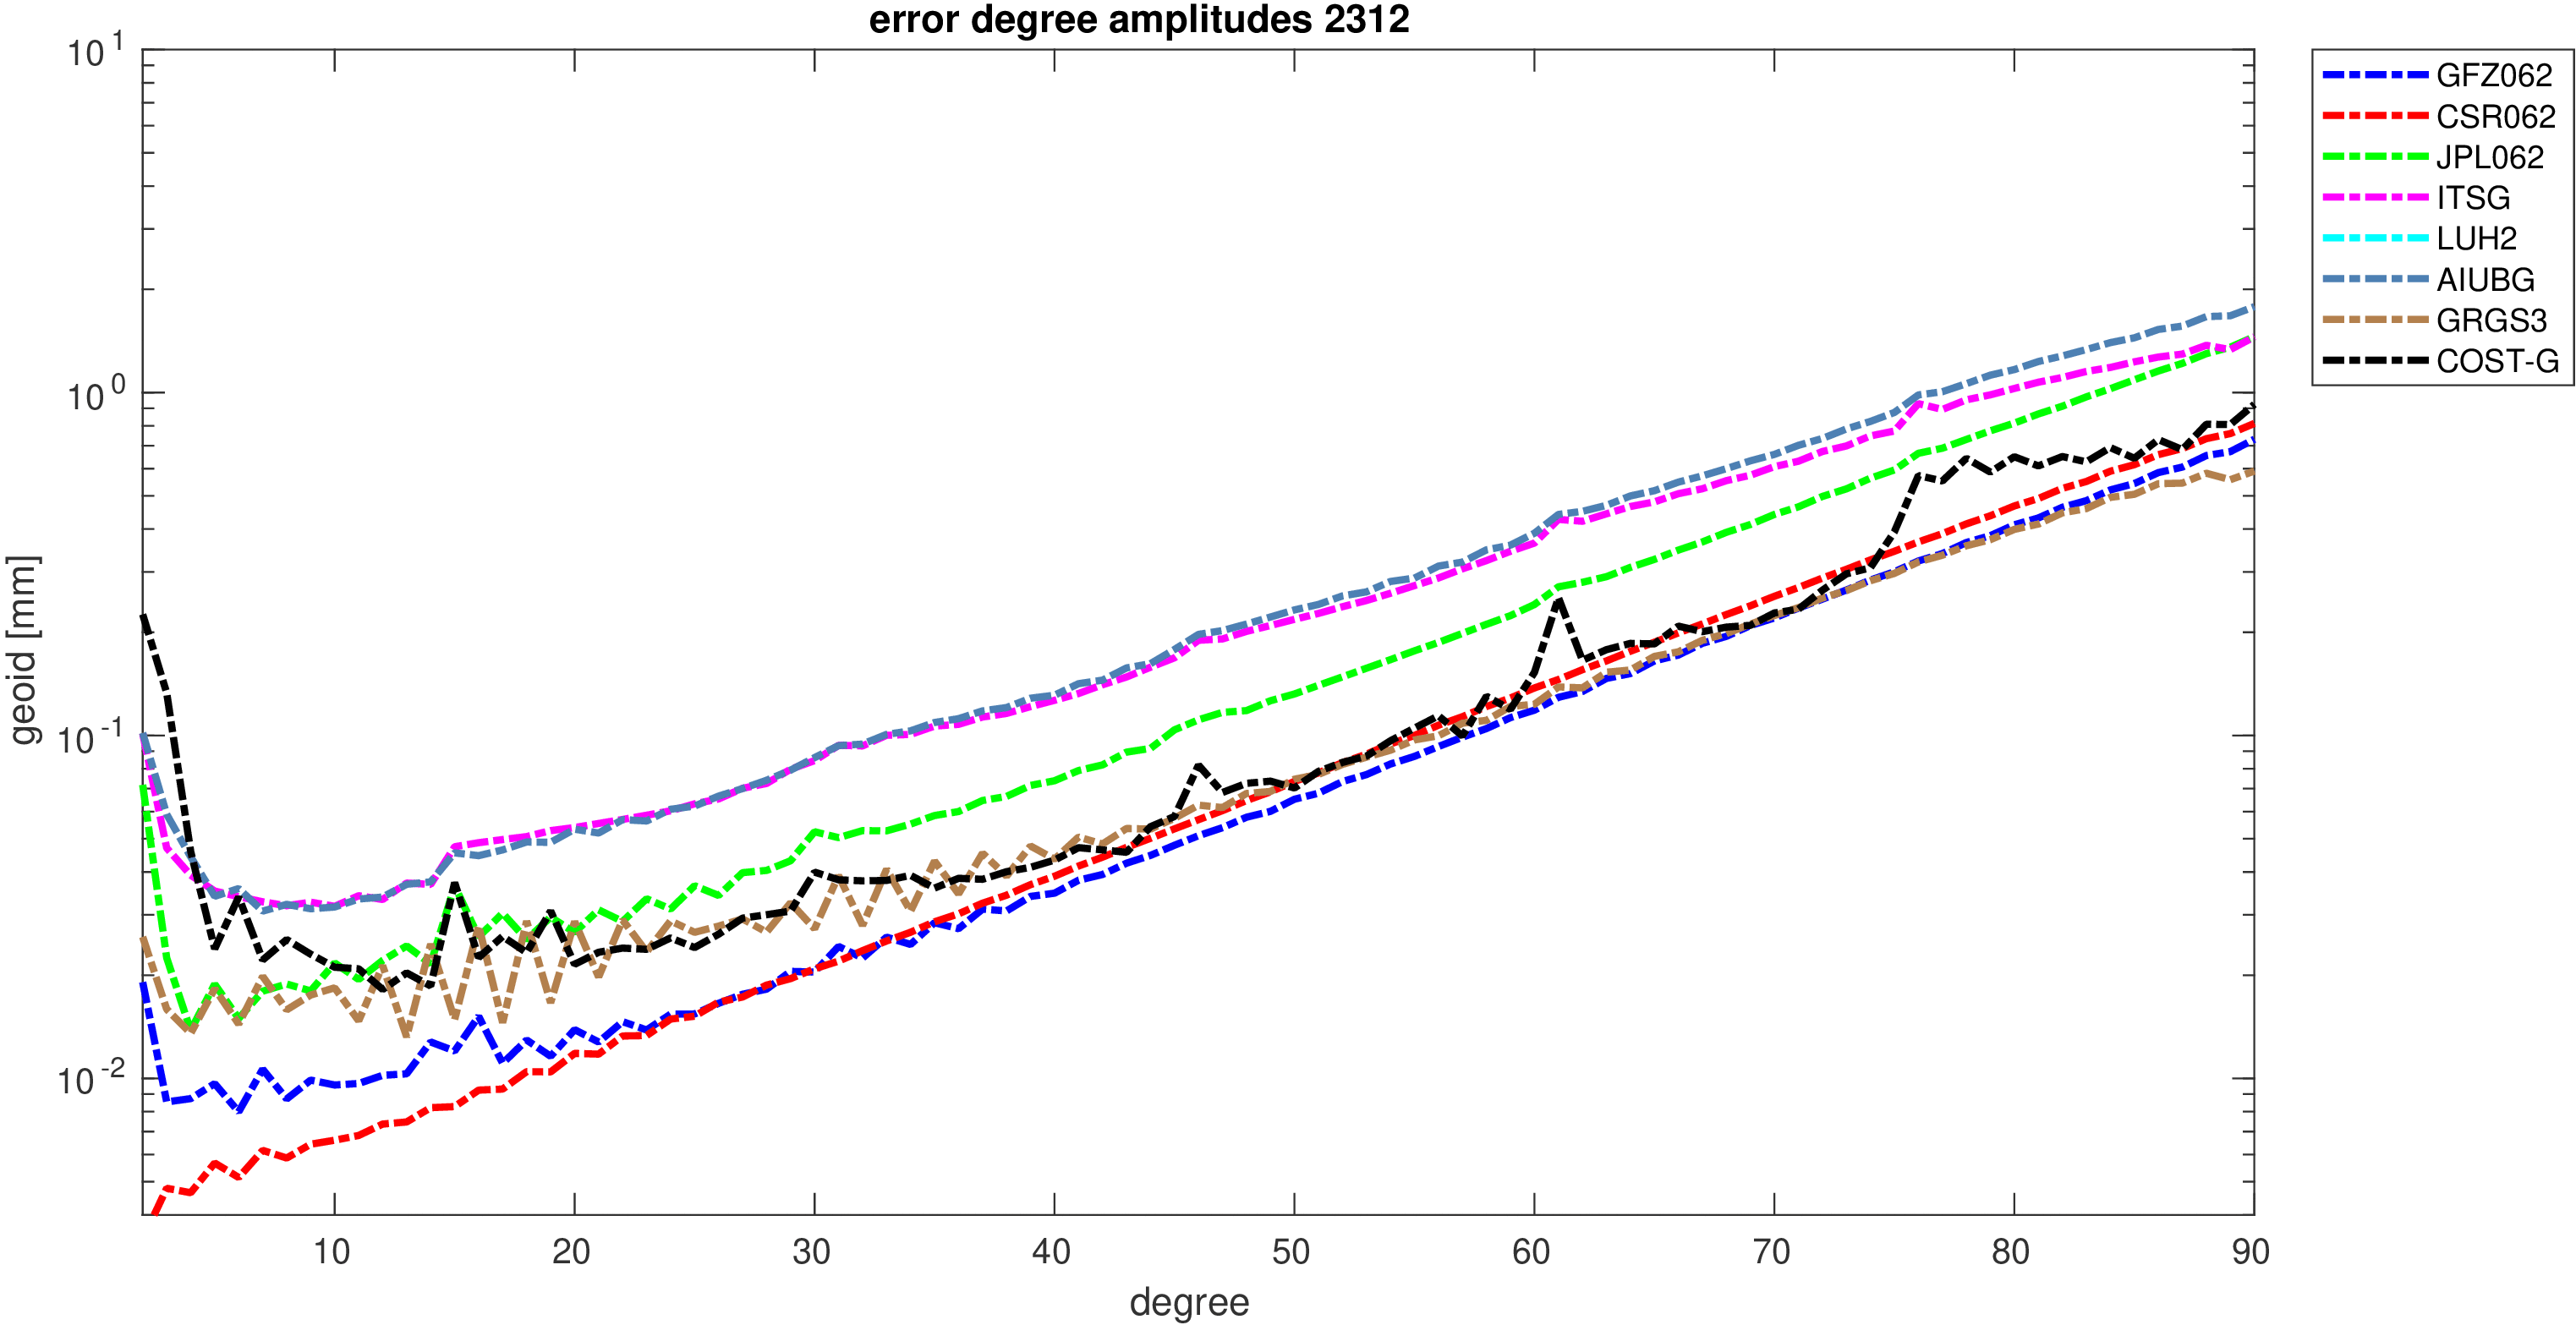
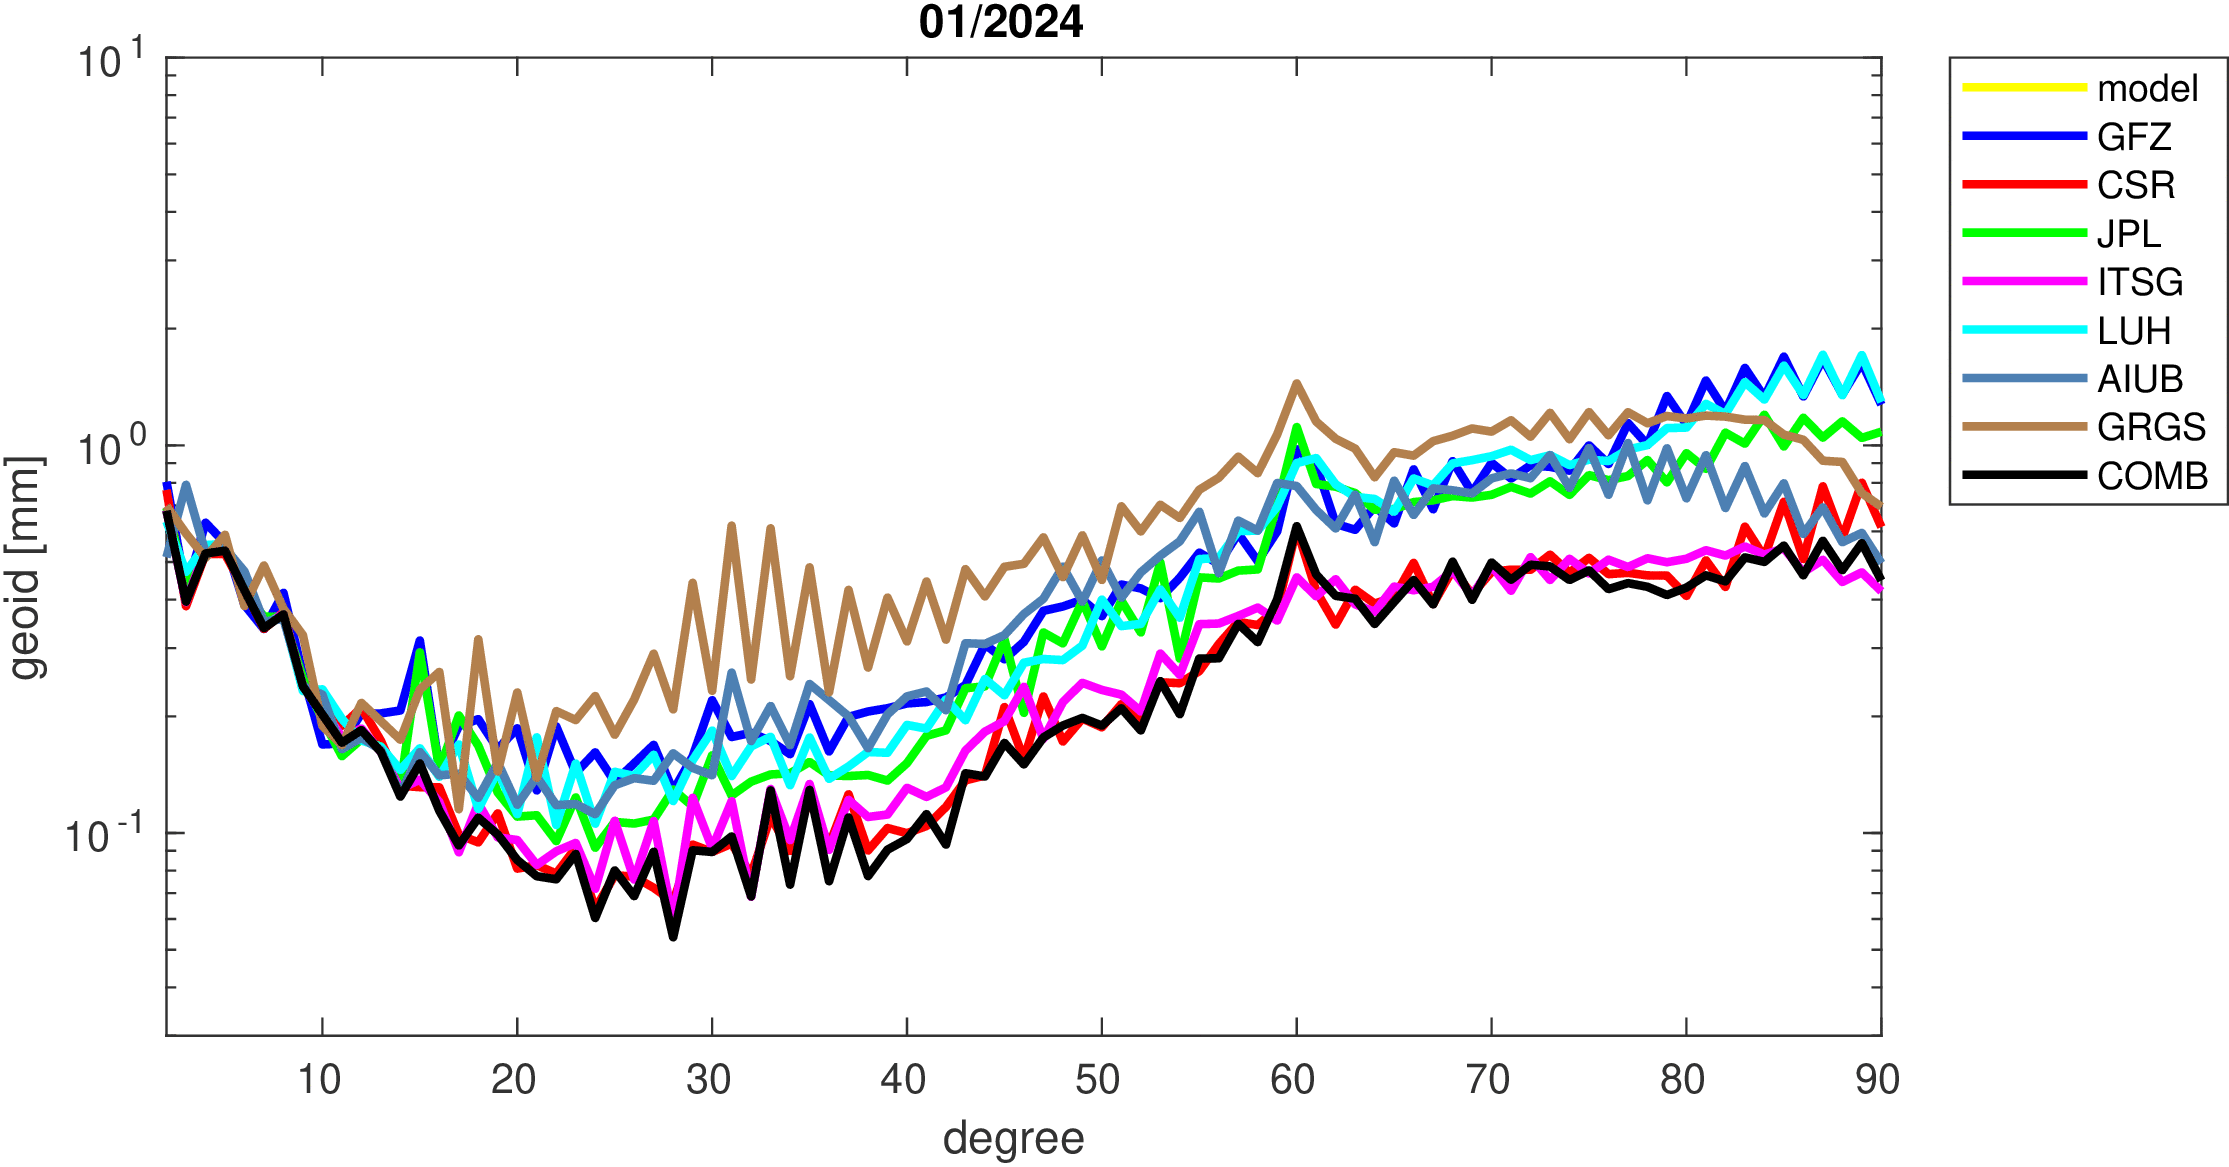
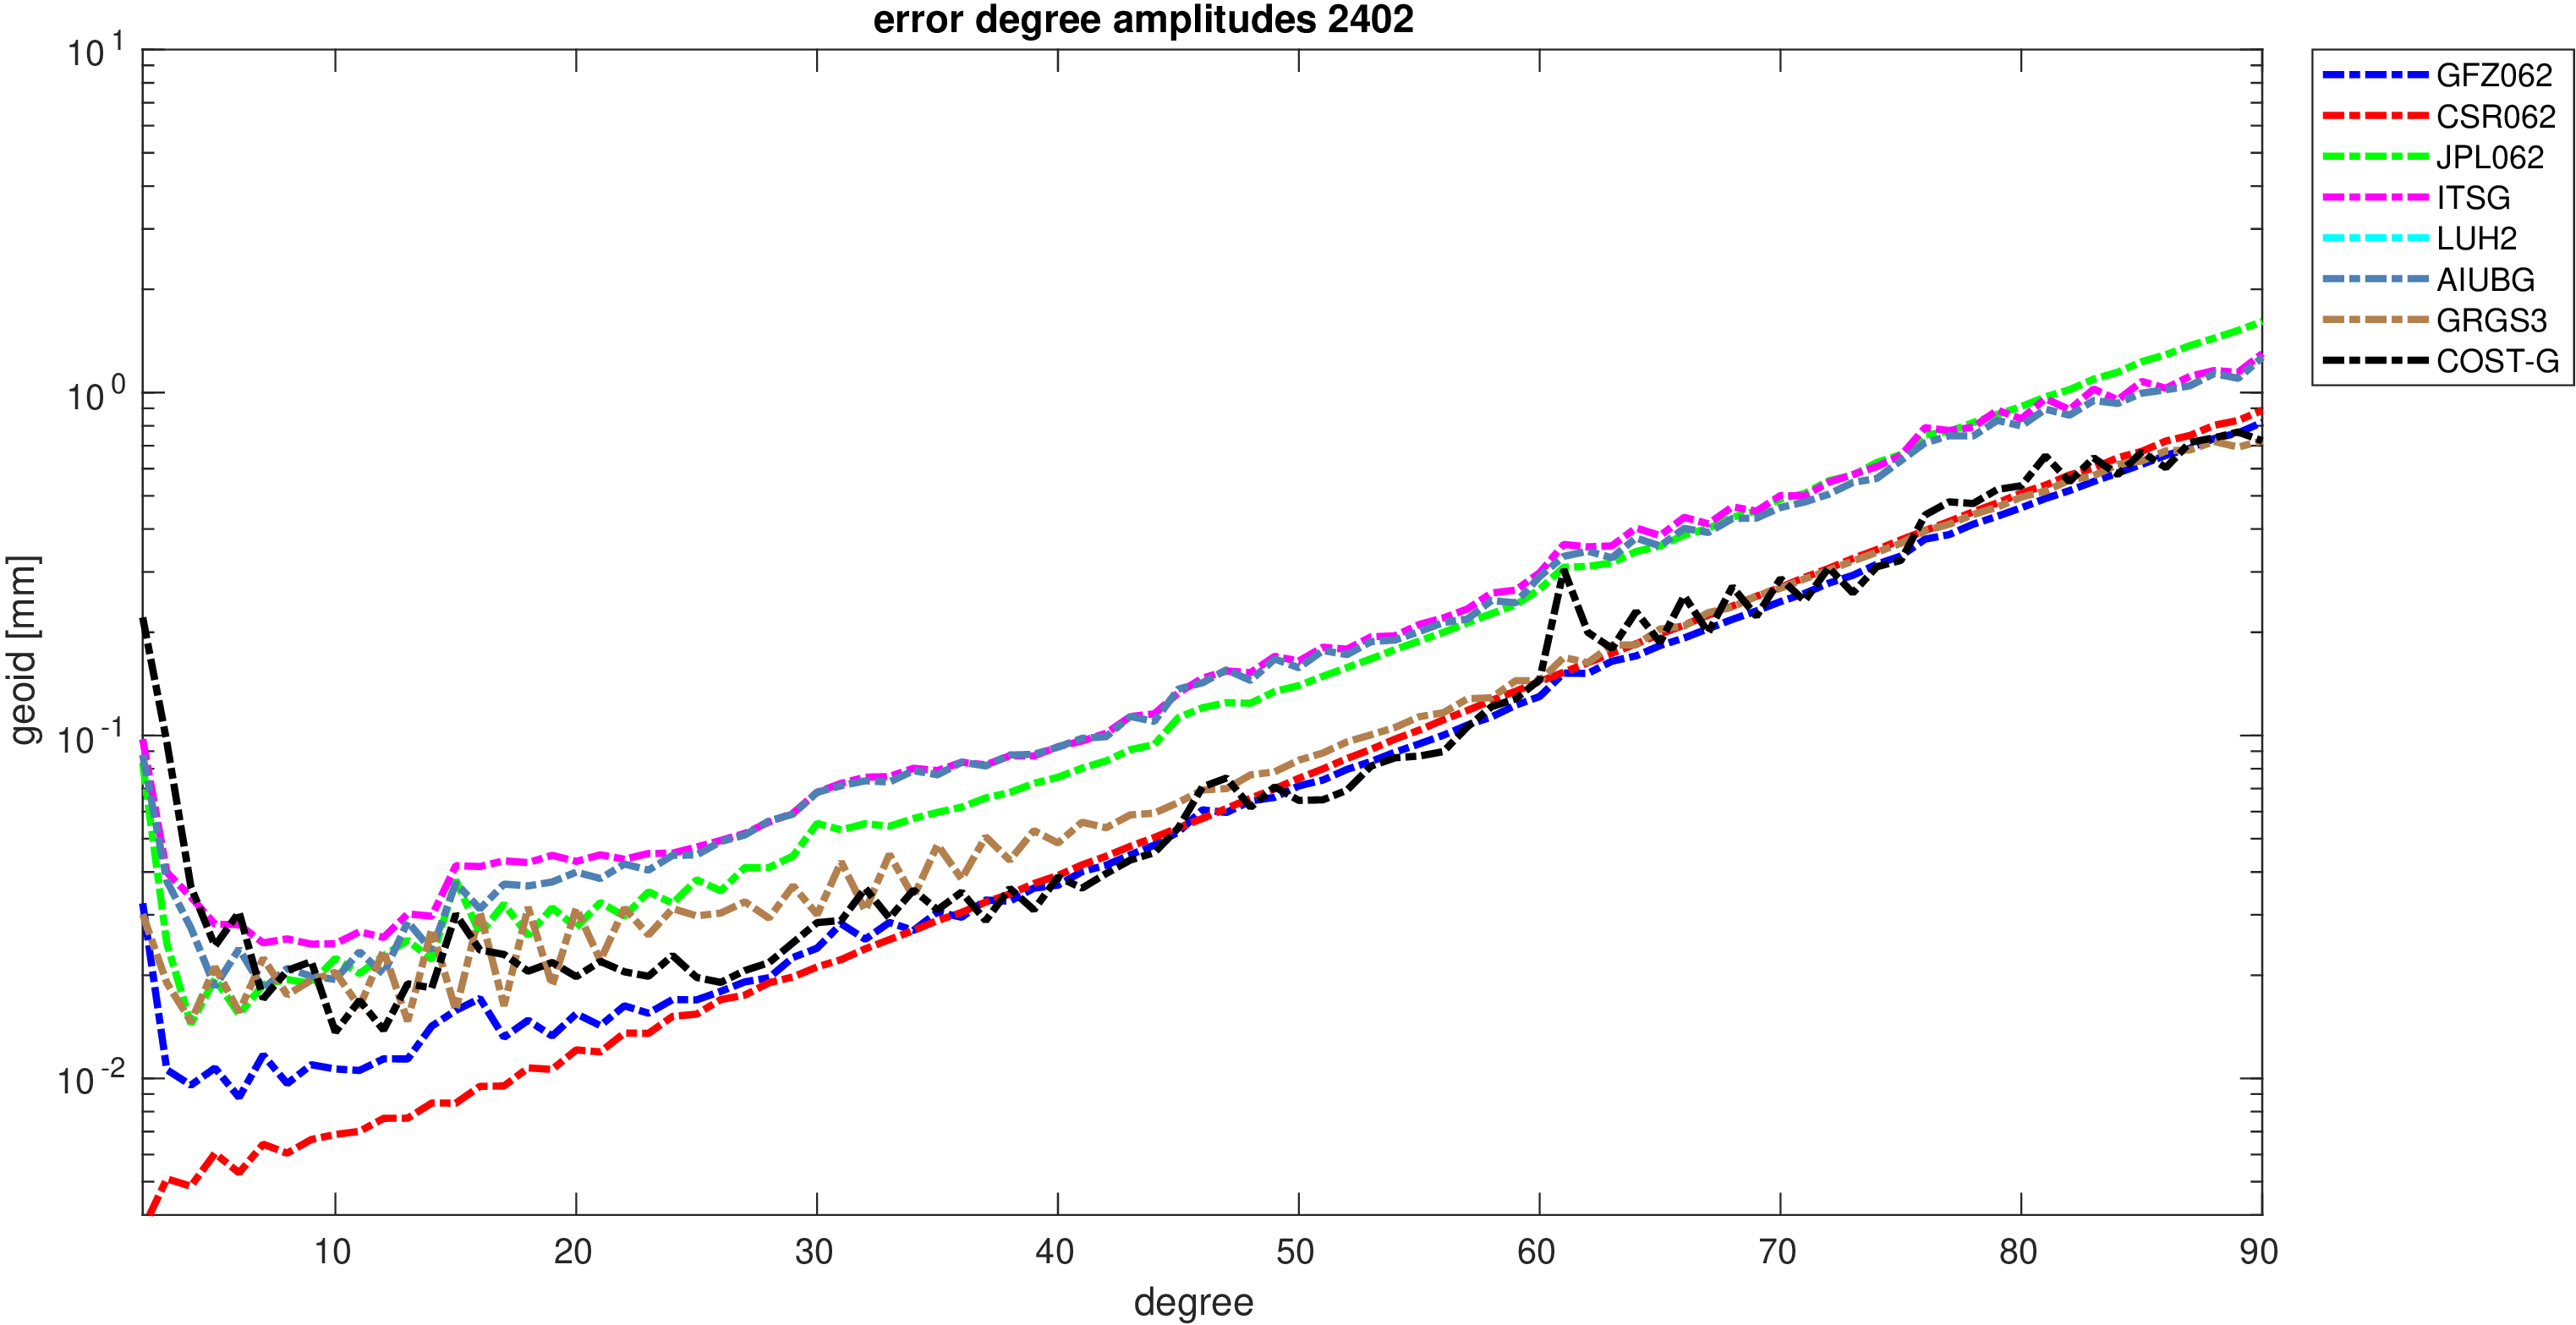
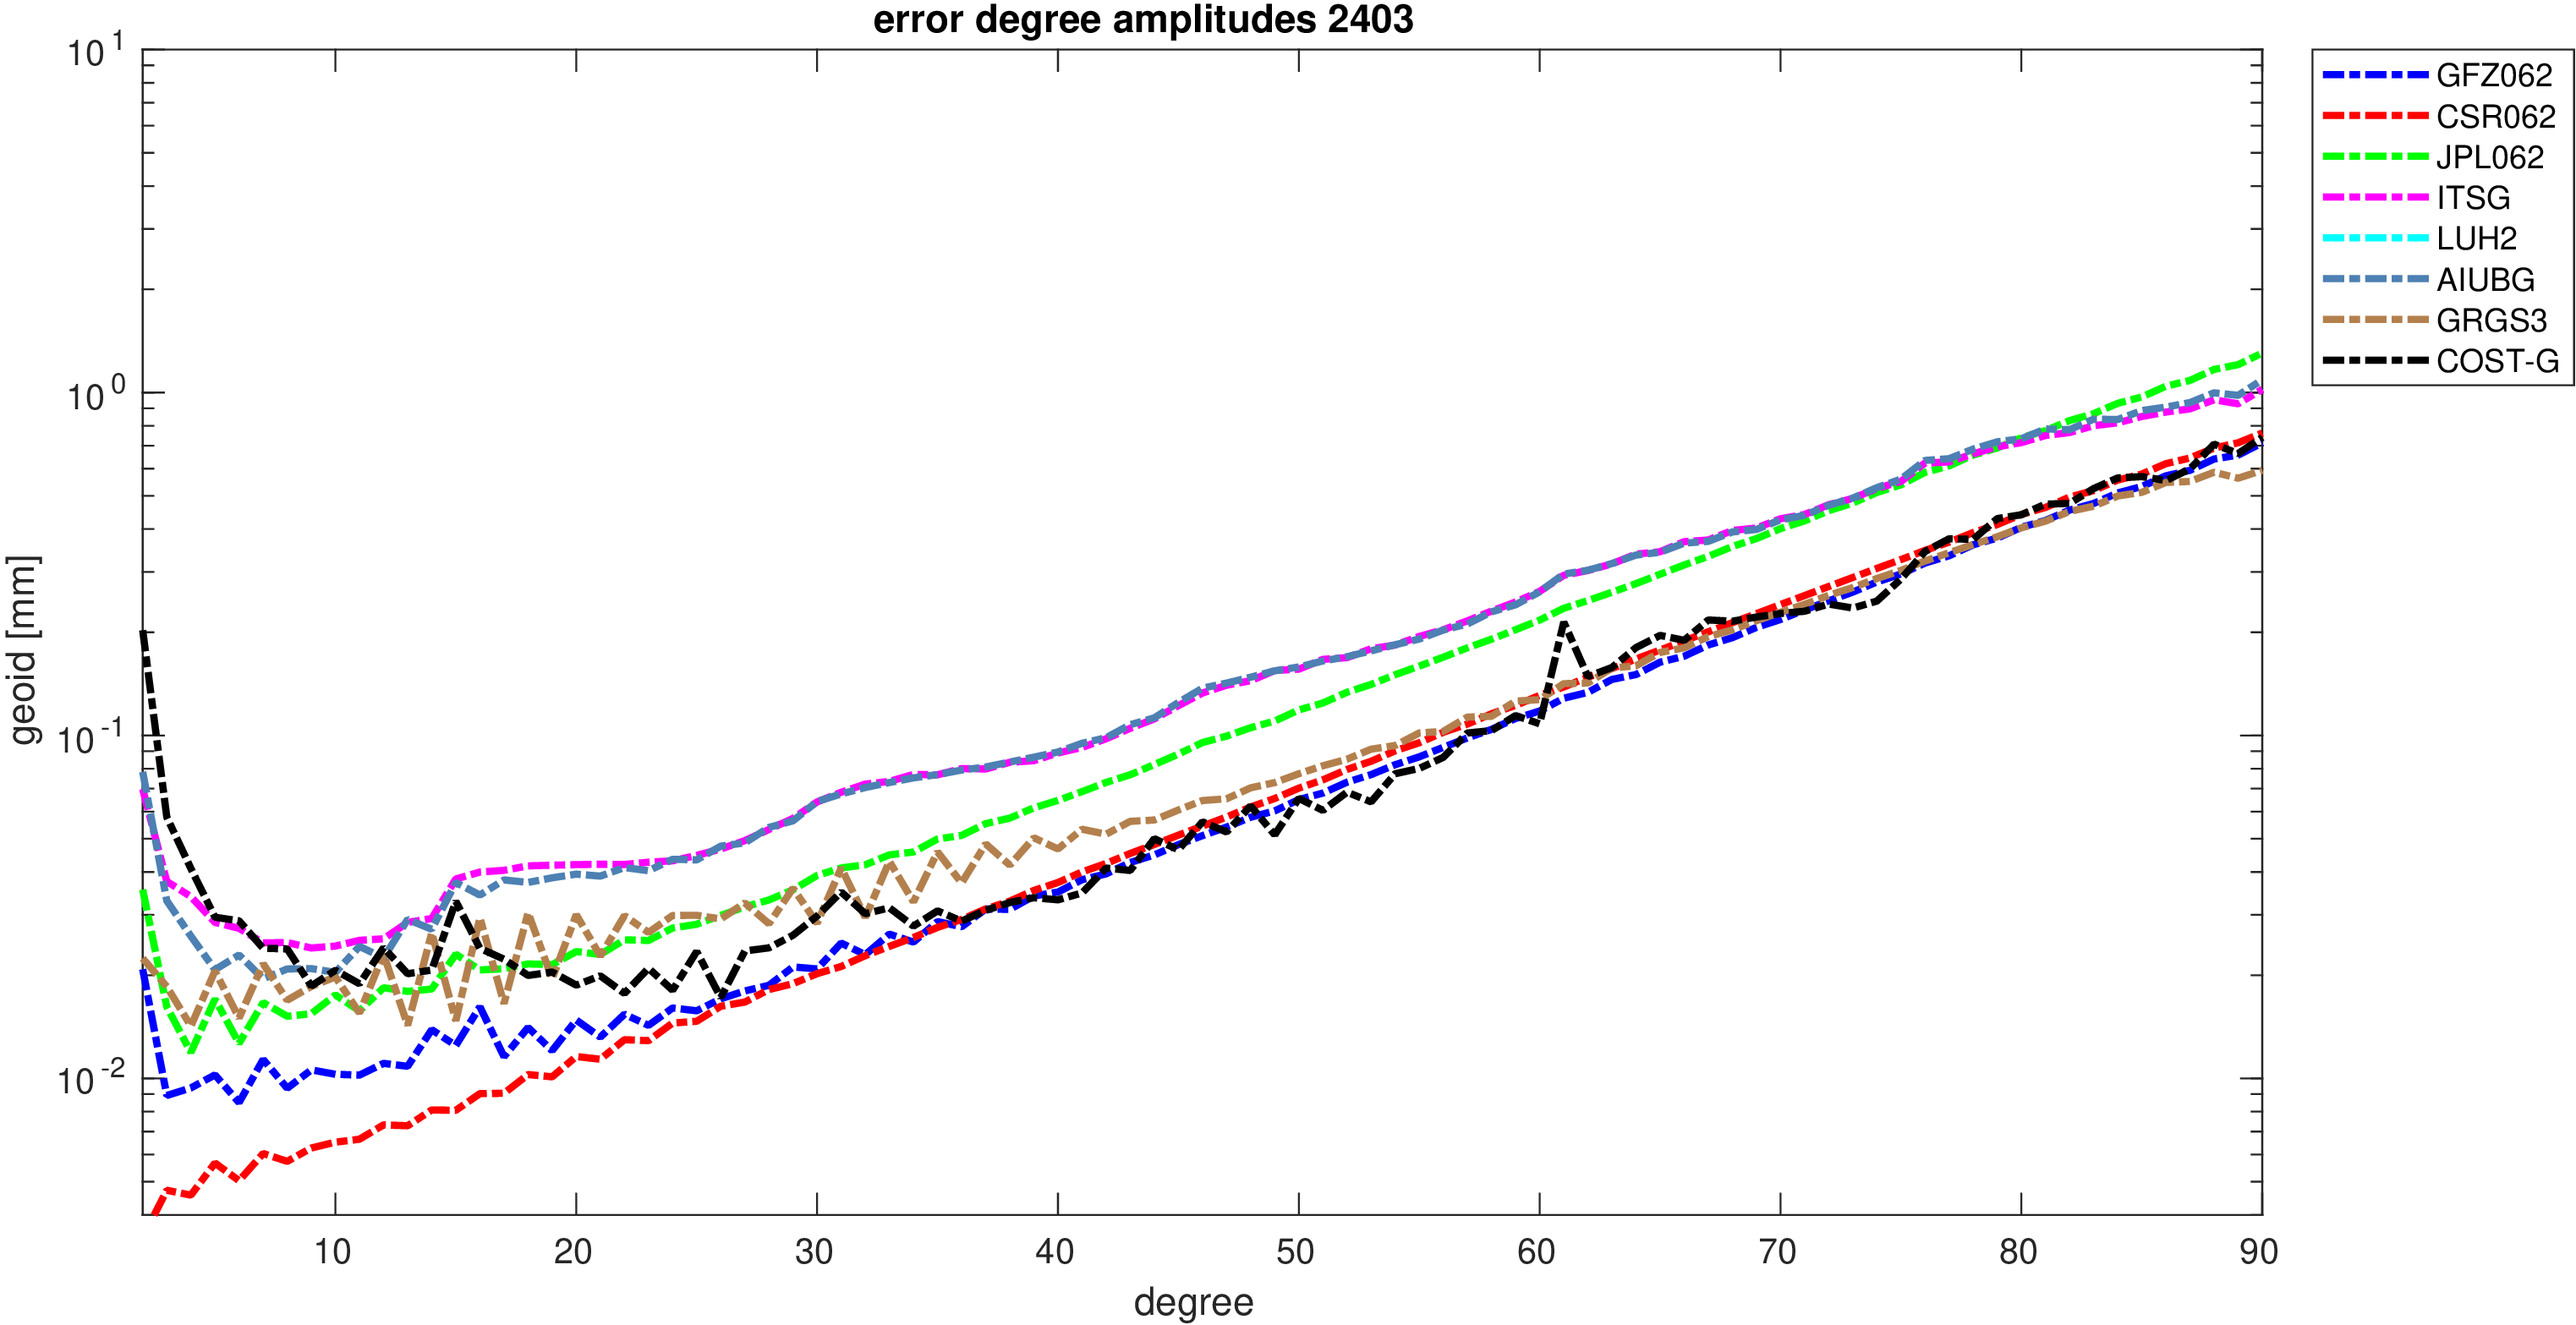
For comparisons in the spherical harmonic domain no filter is applied. Low degree anomalies are dominated by
residual signal content (non-seasonal hydrology and non-linear ice melt),
while the higher degree anomalies are dominated by noise.
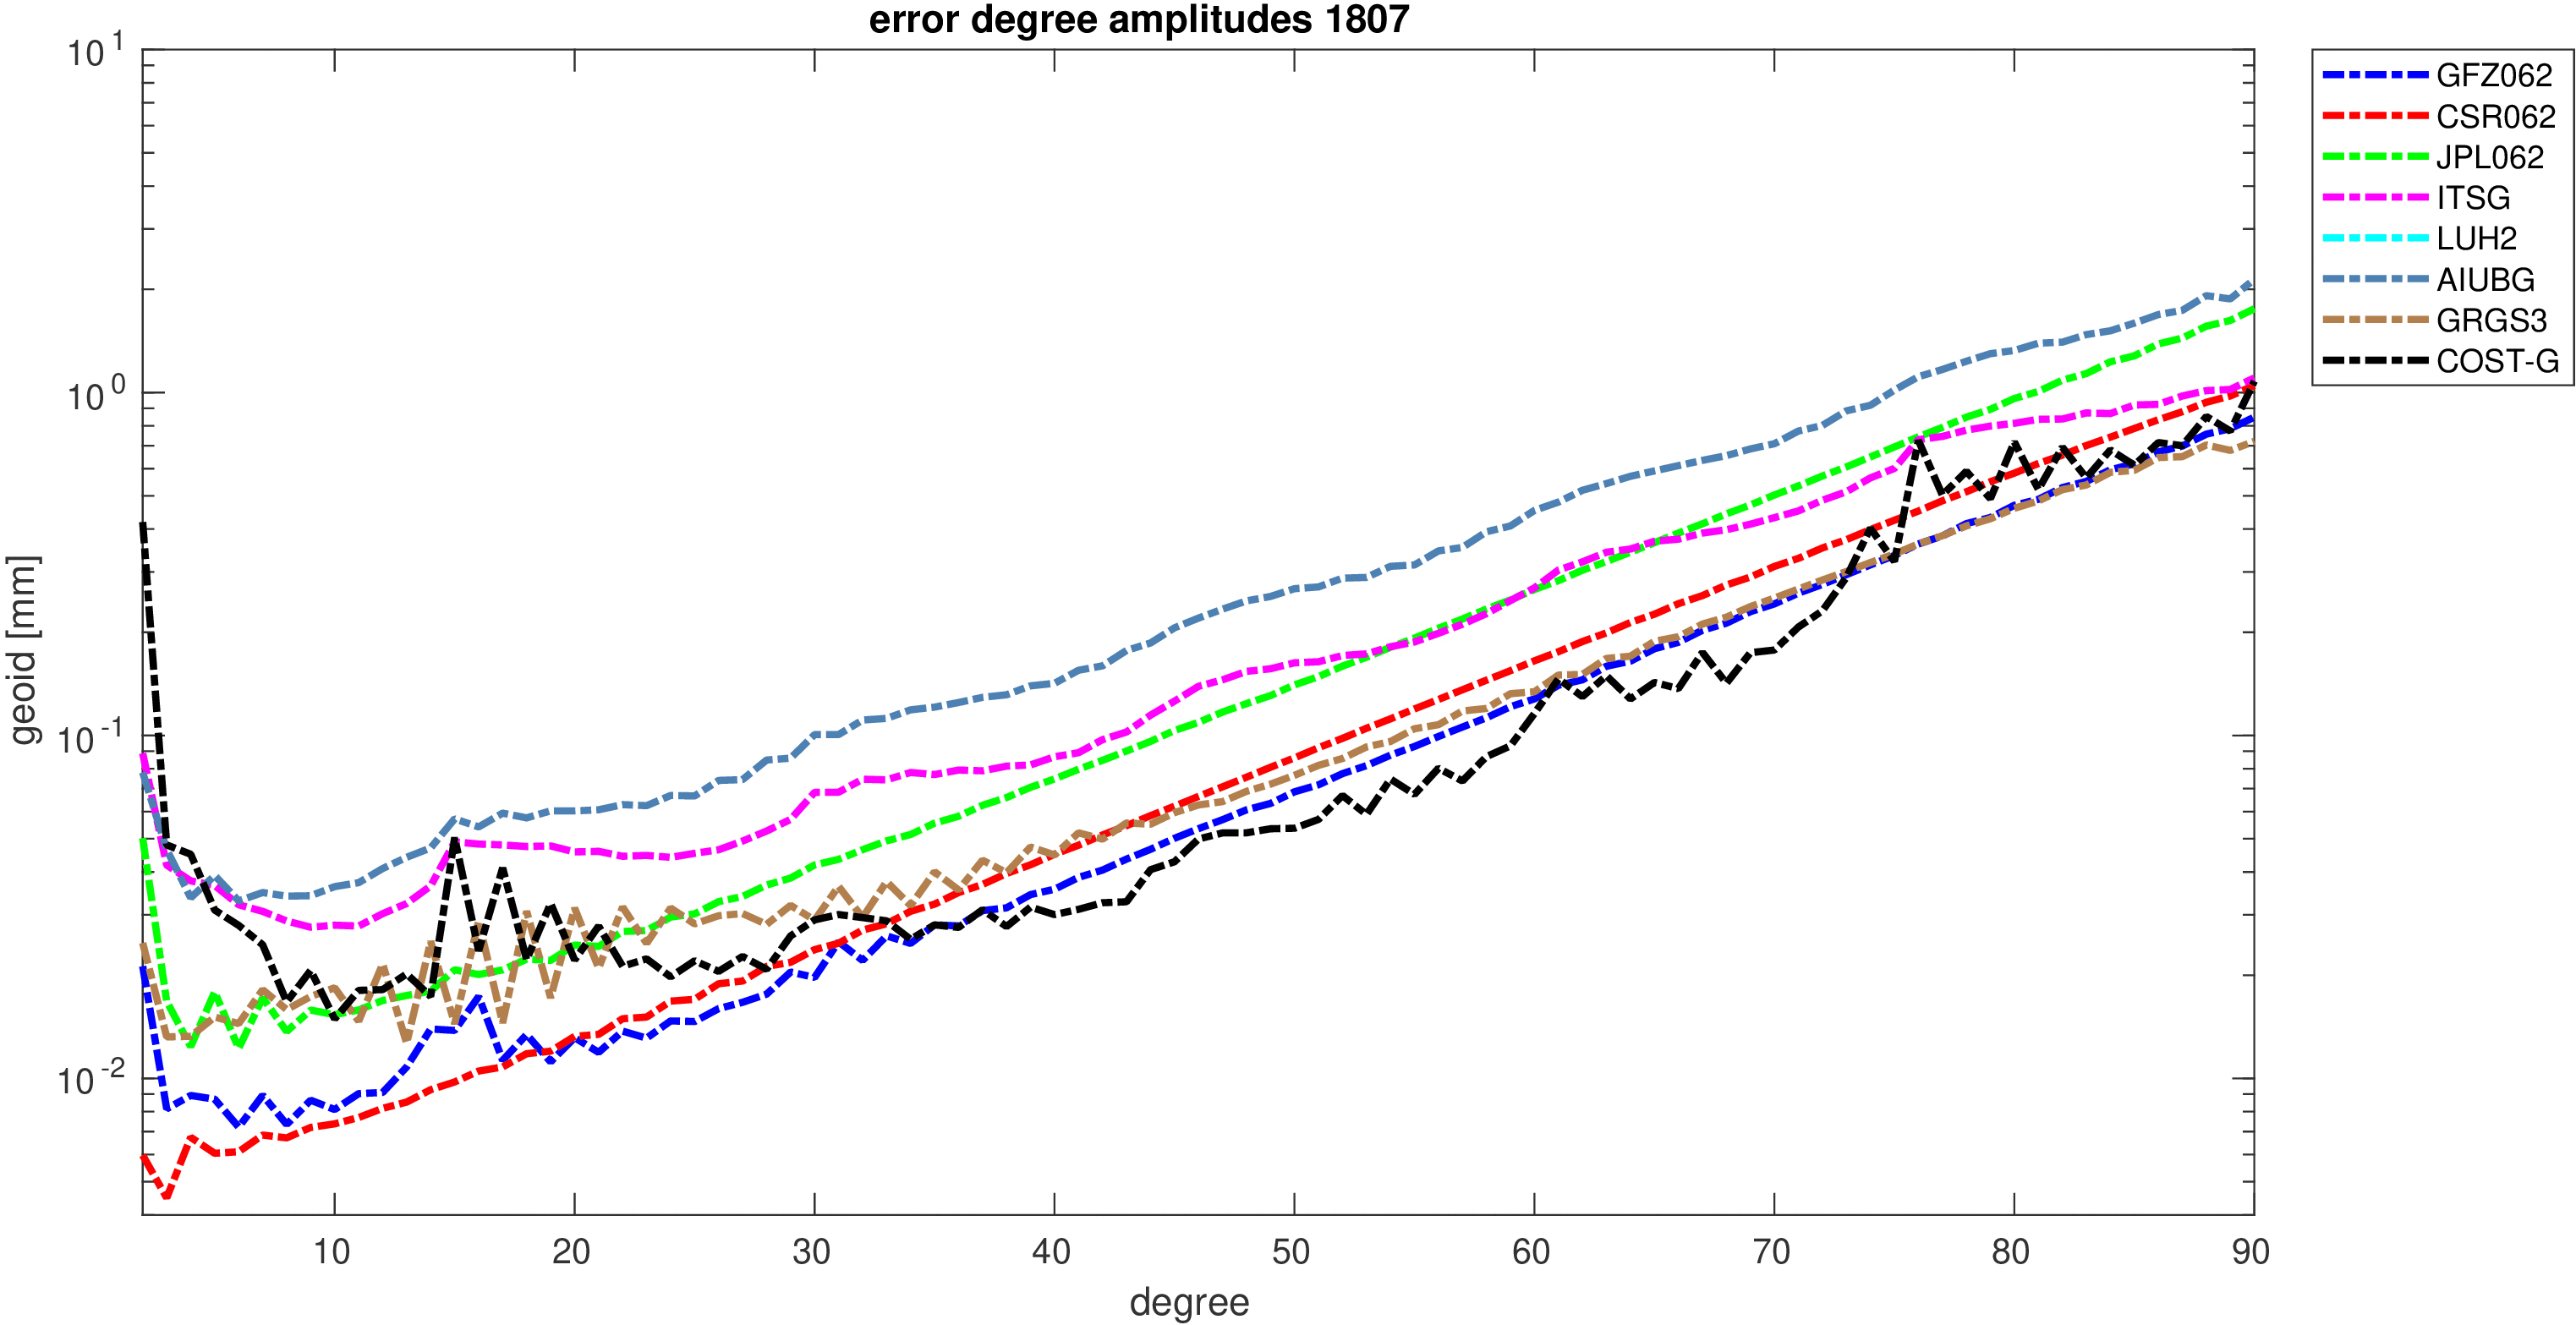
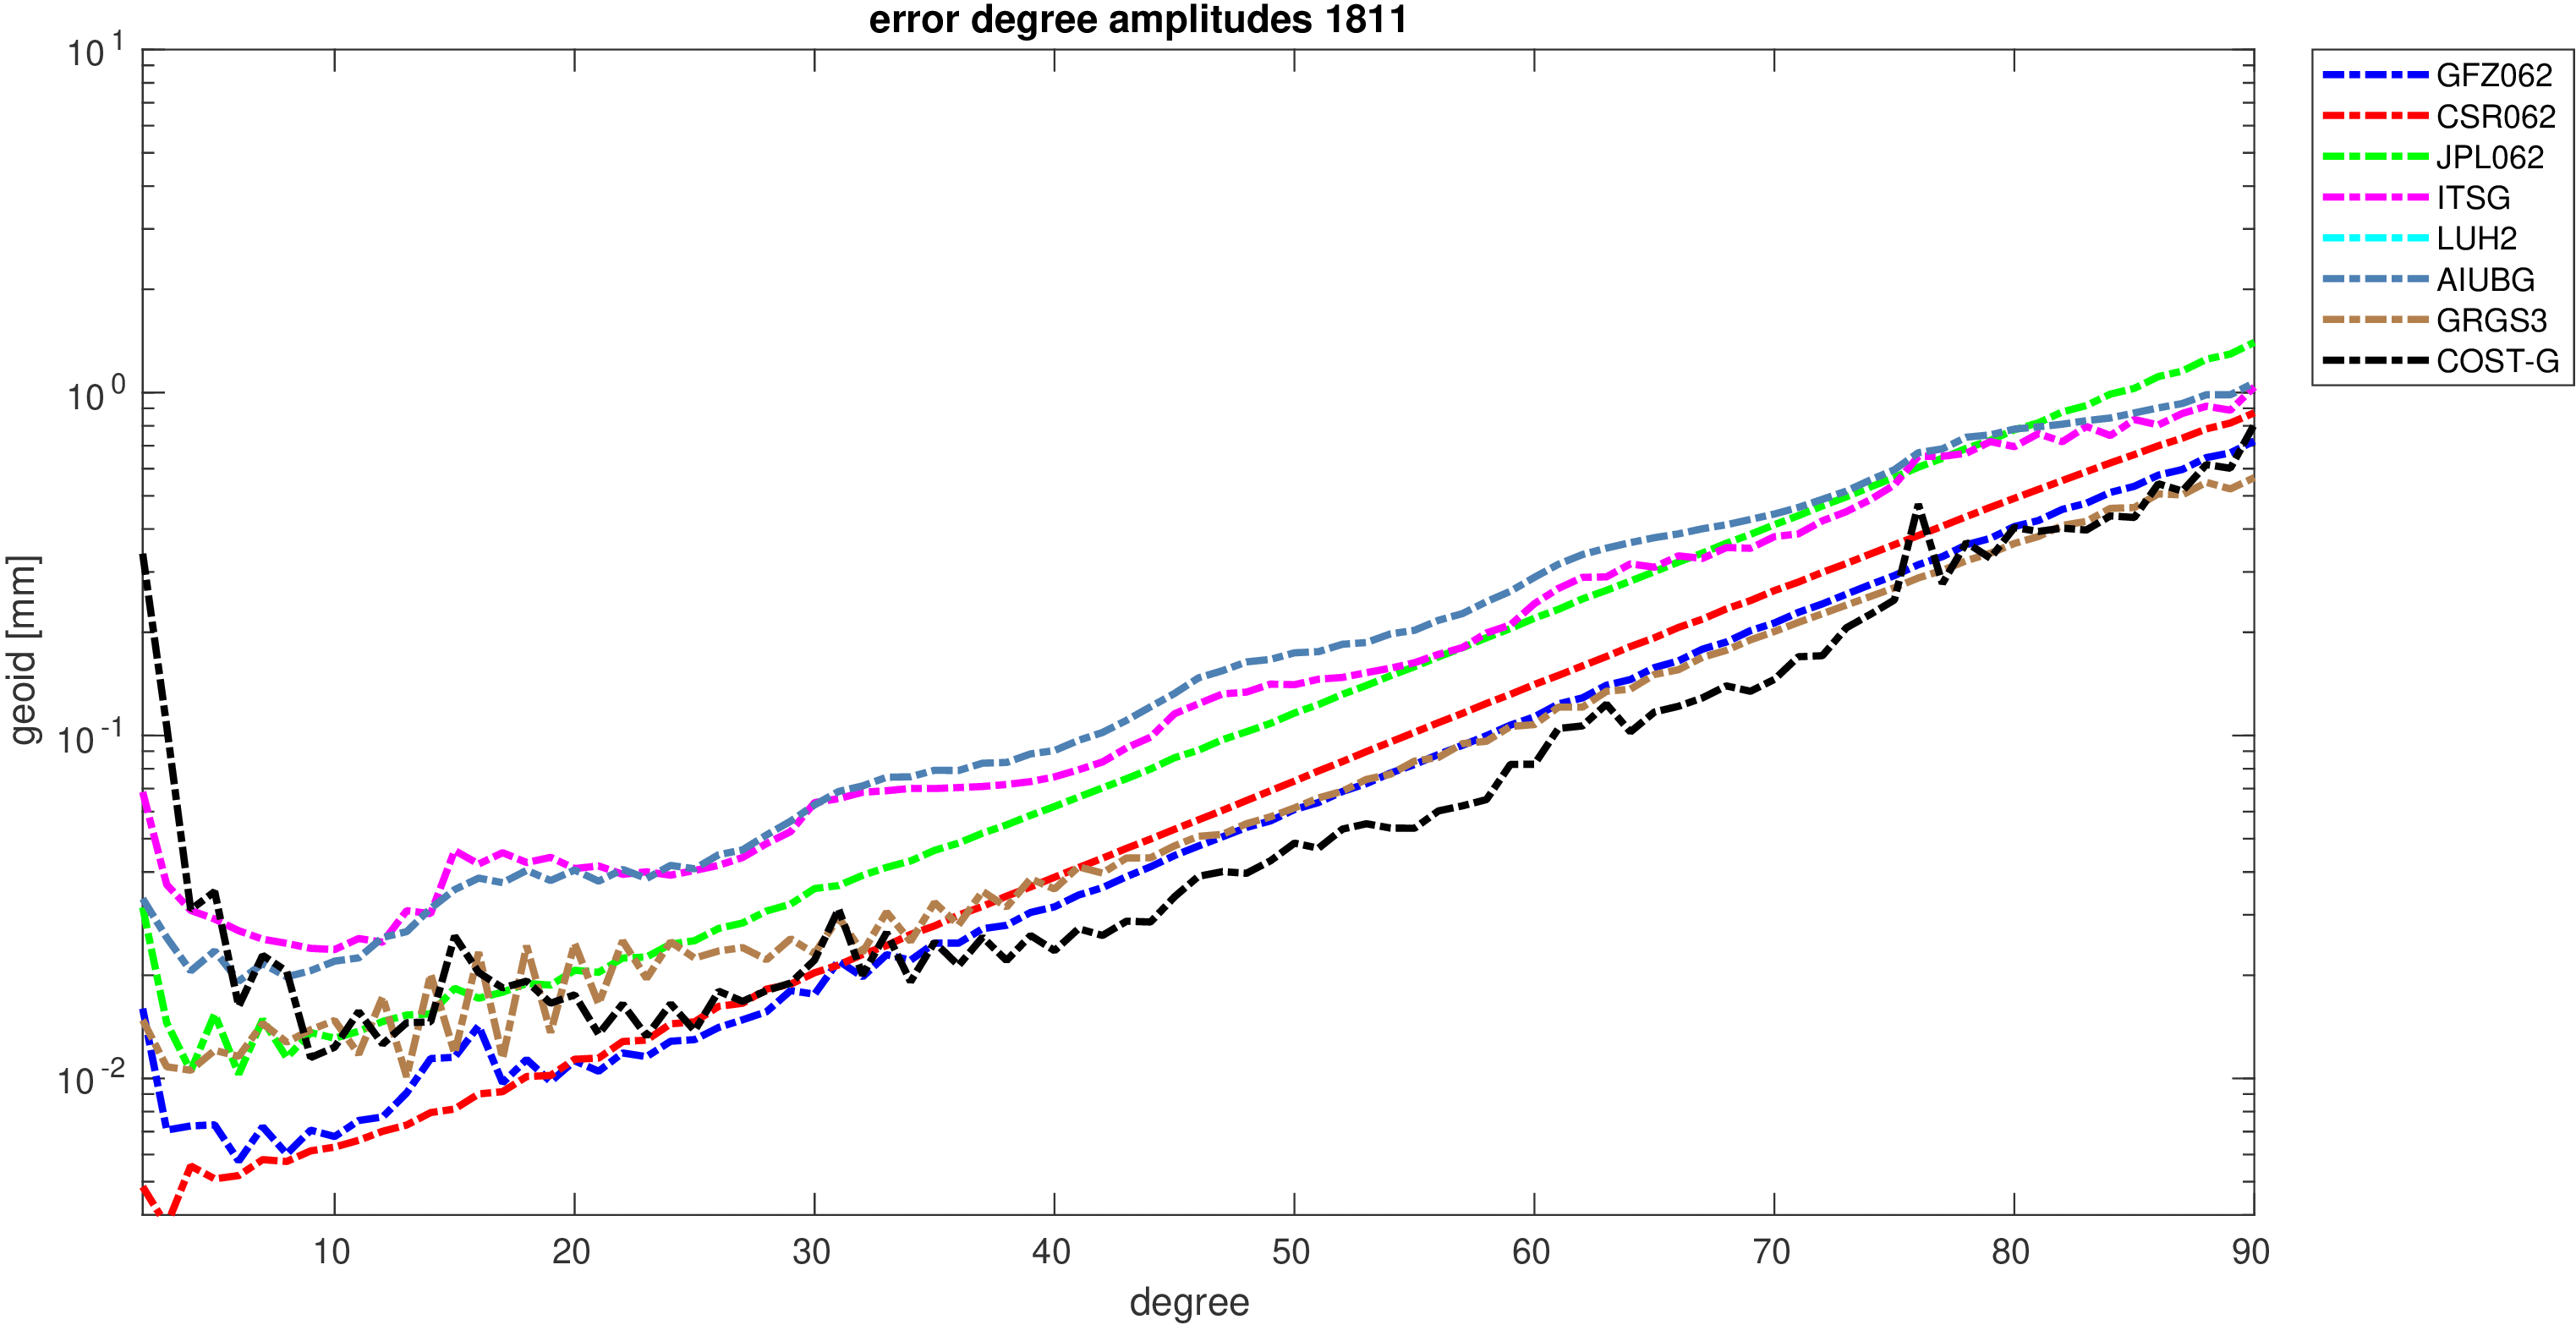
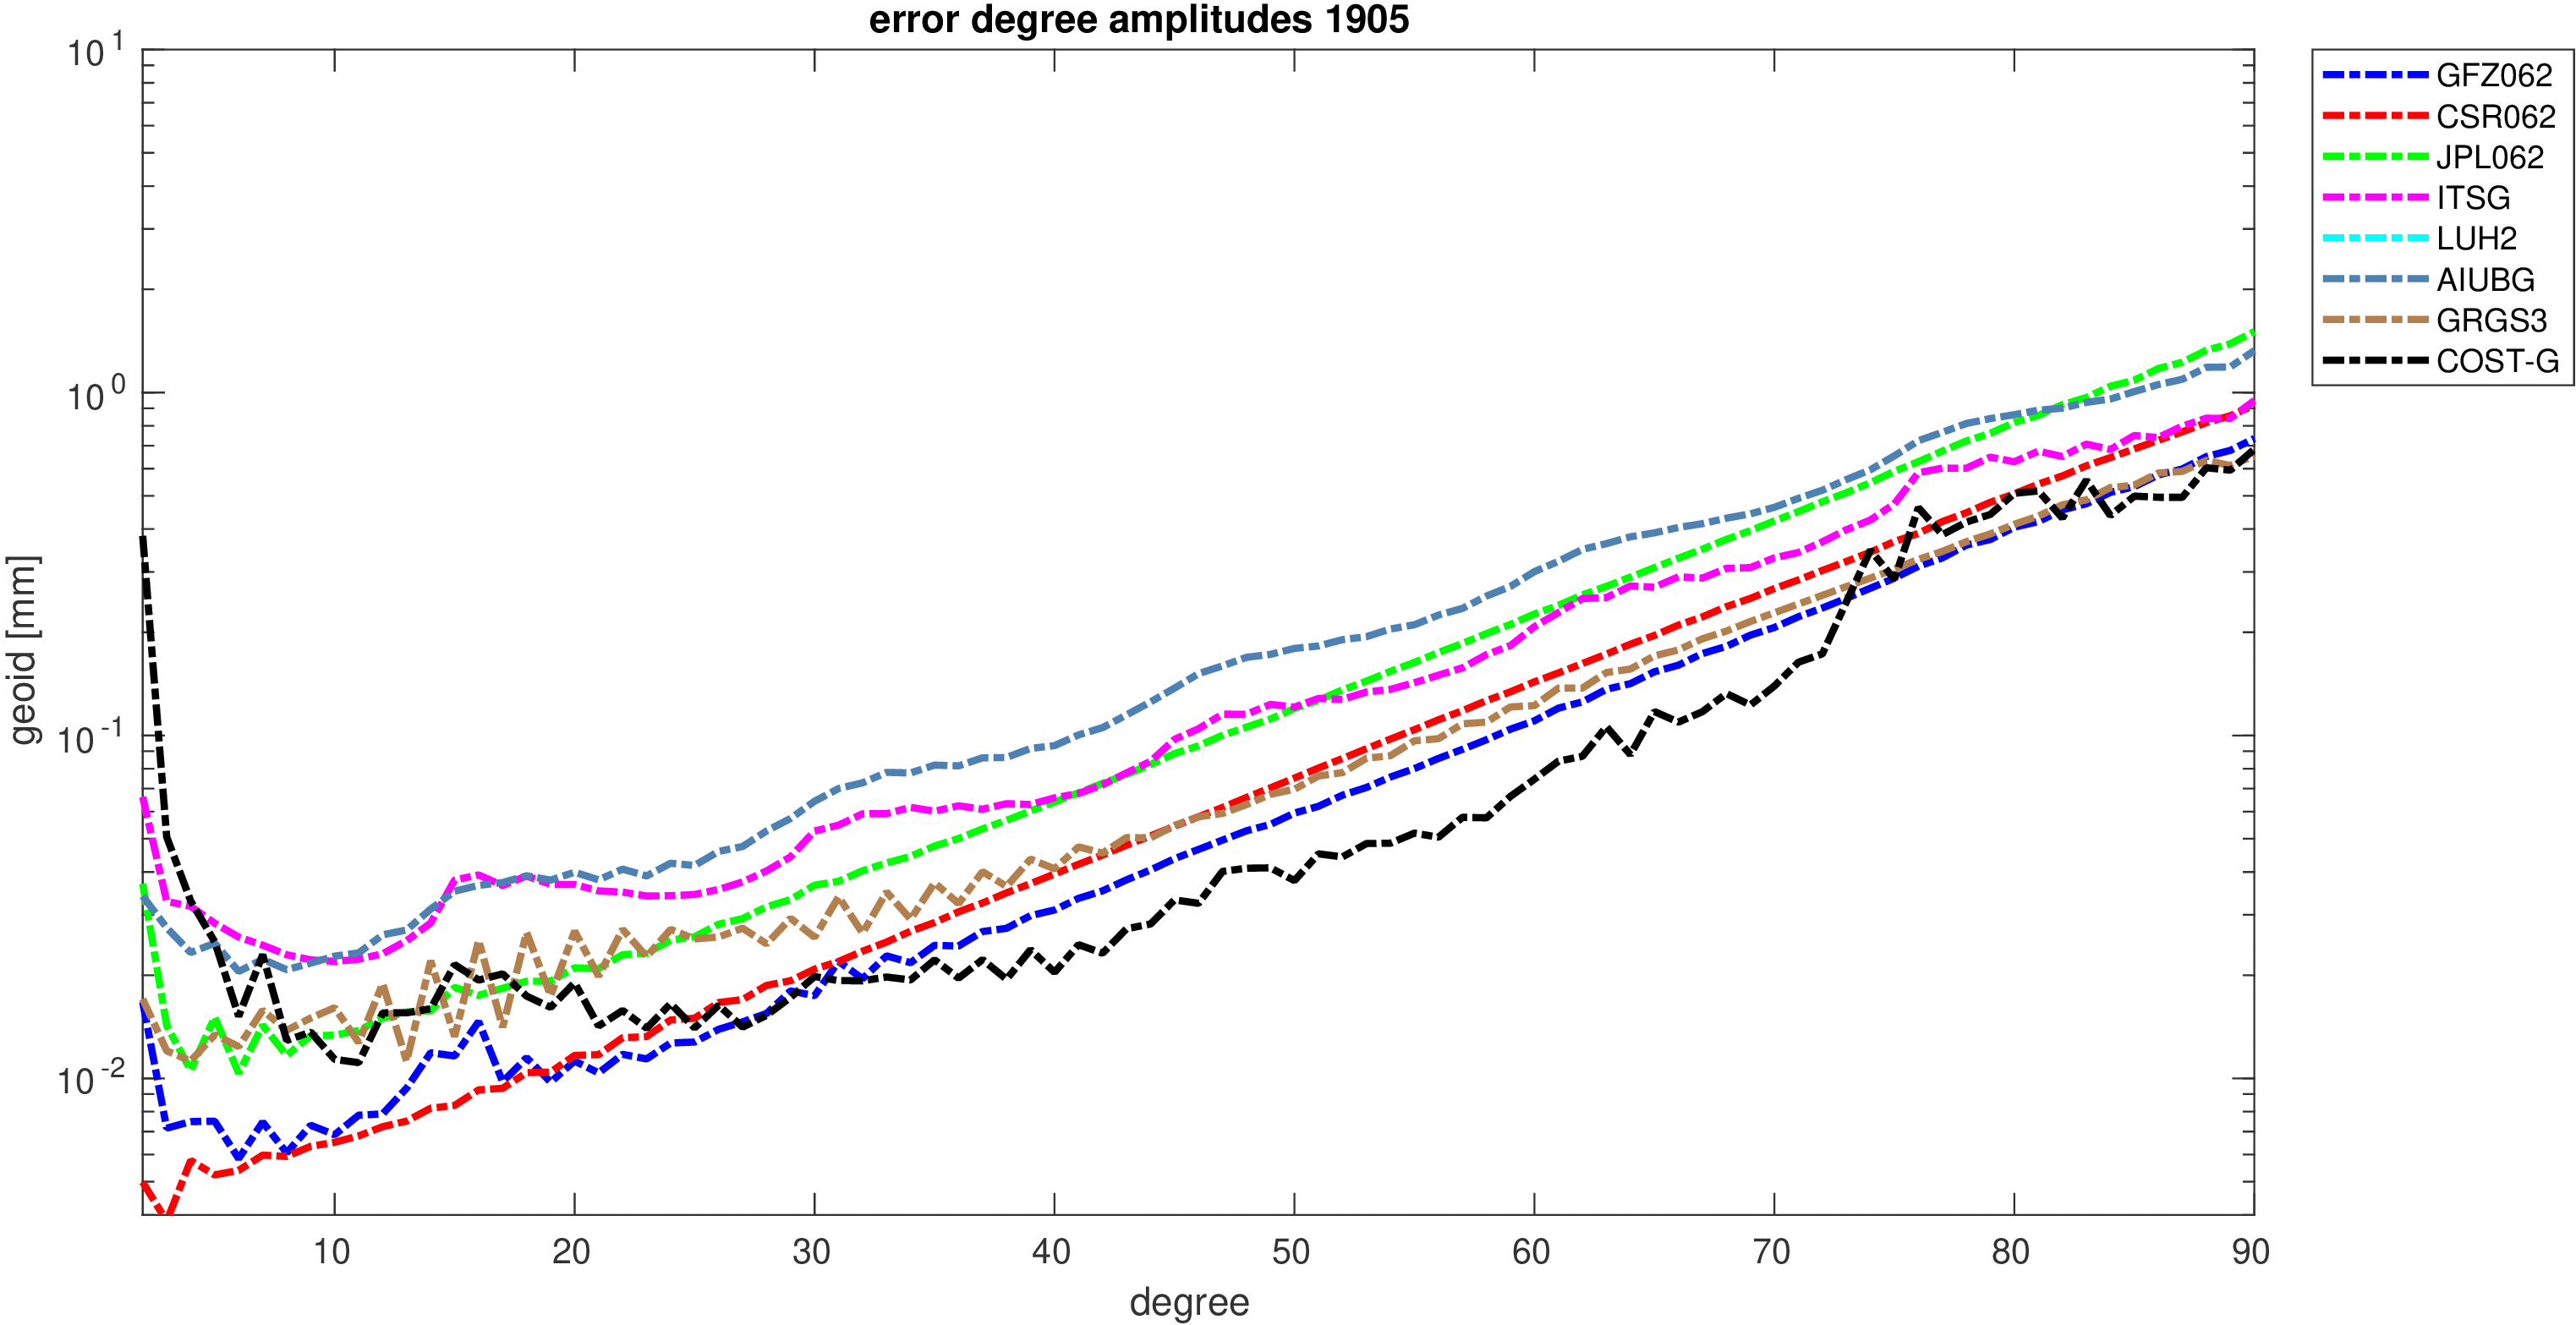
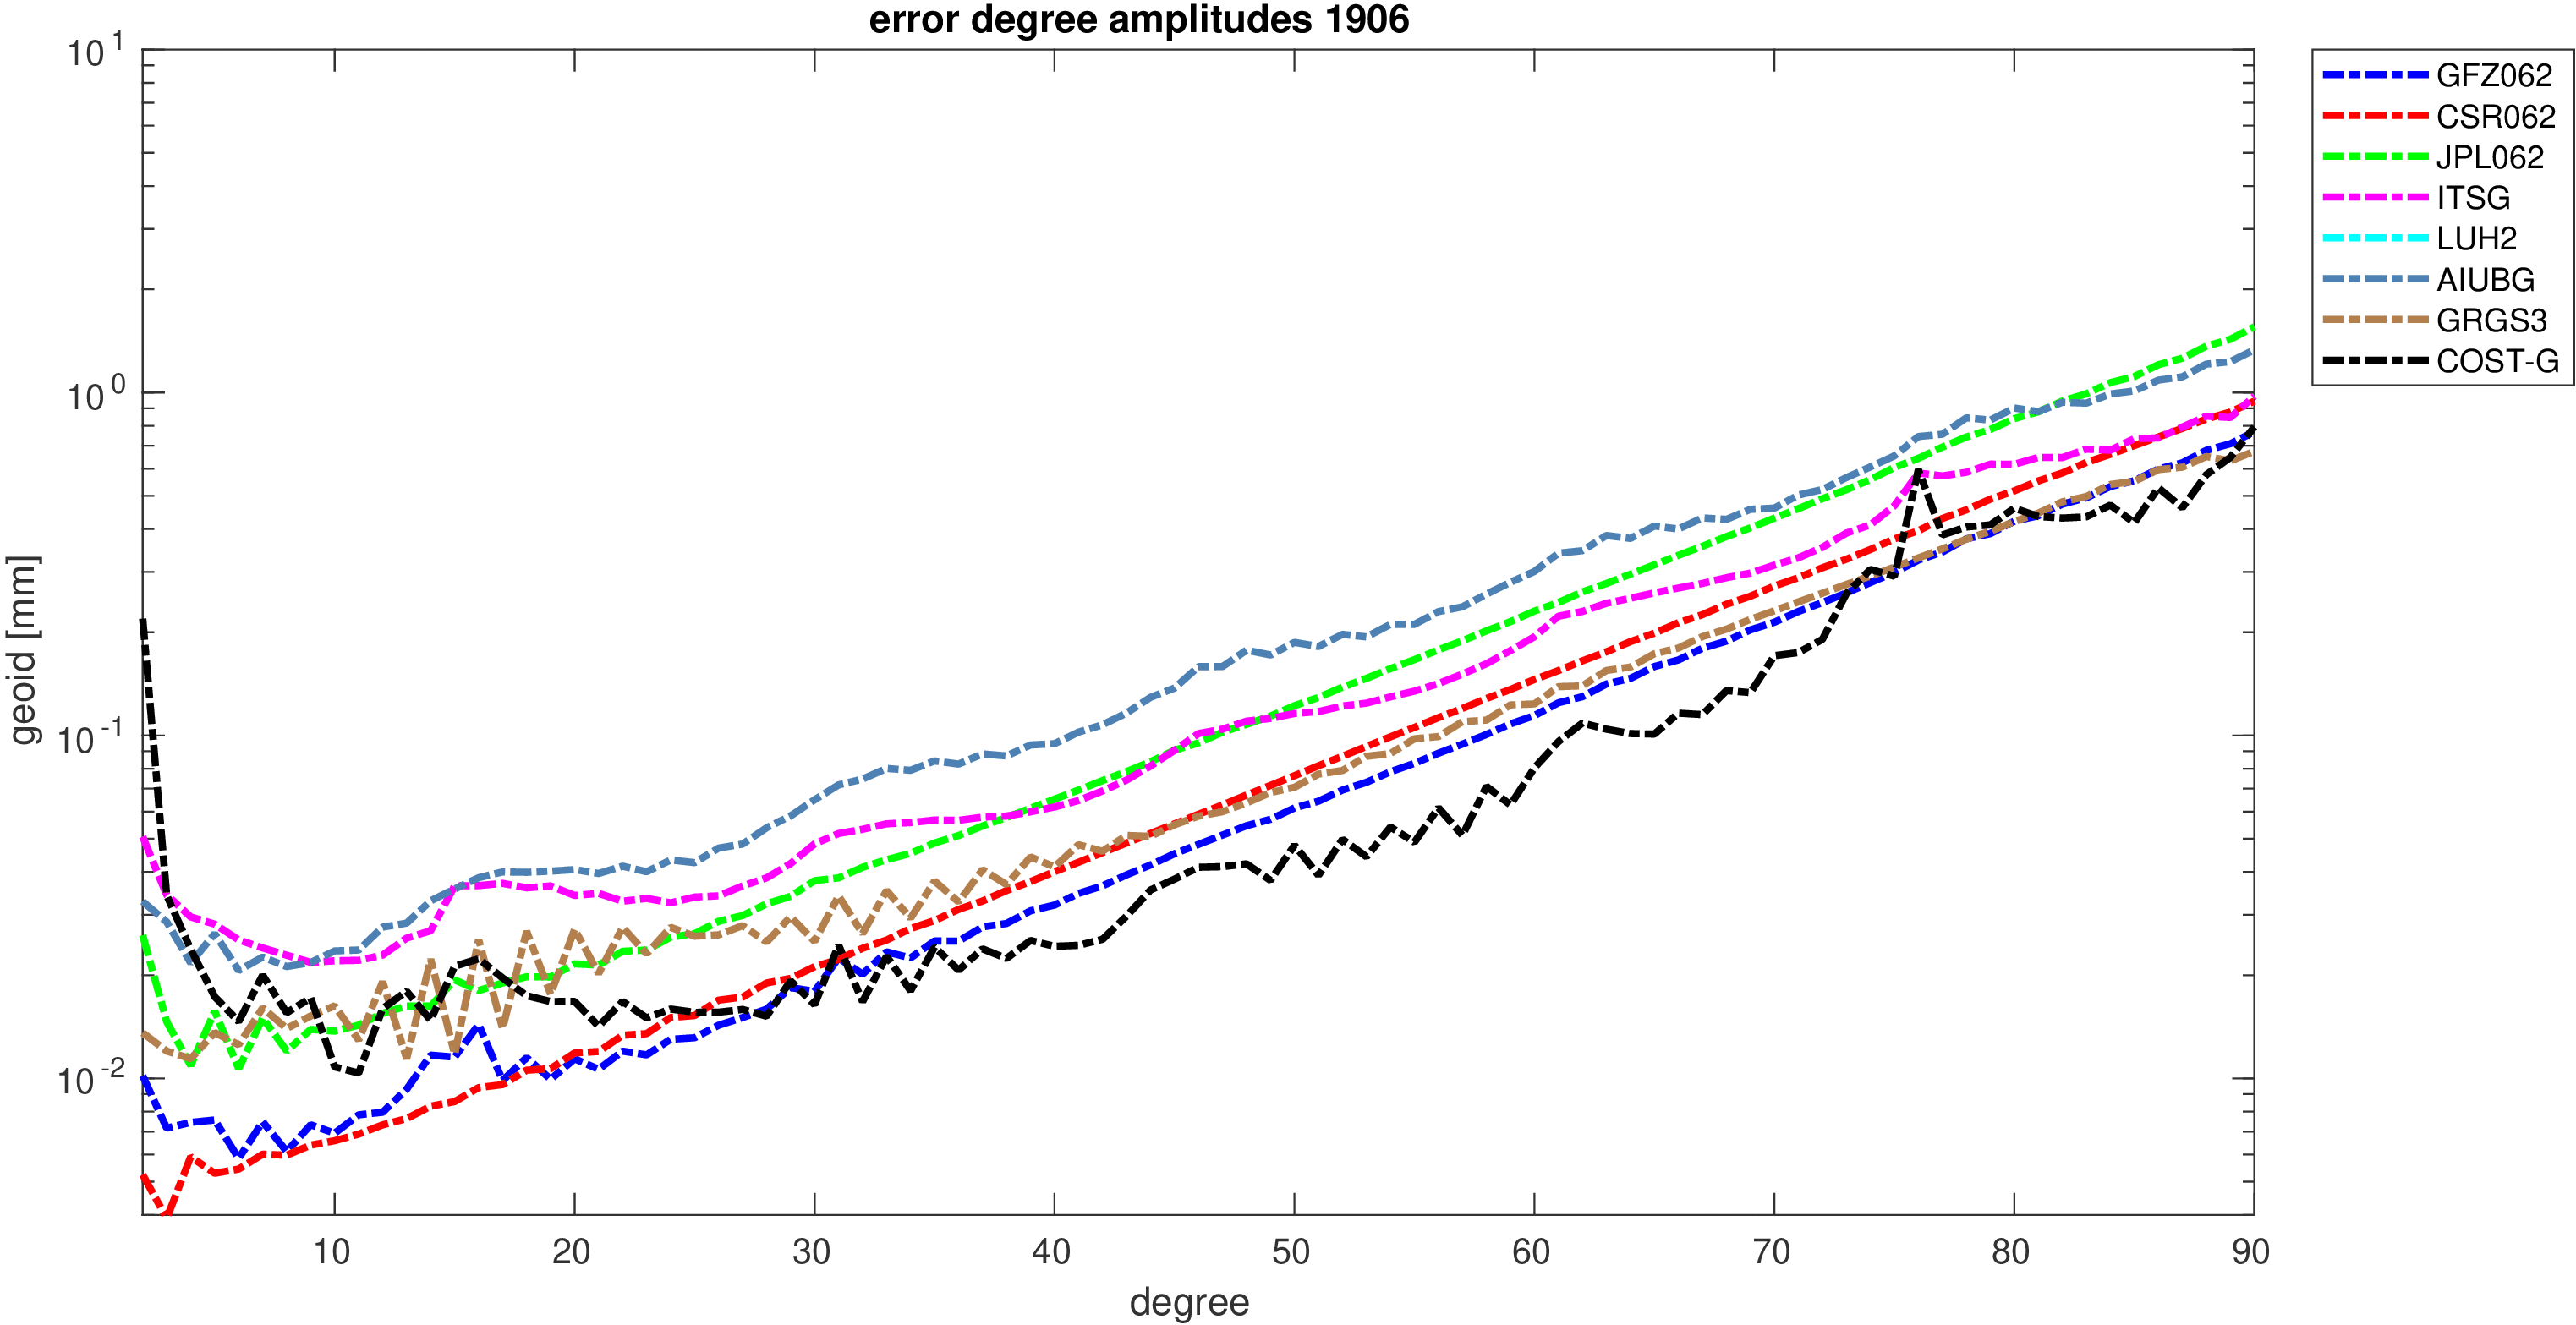
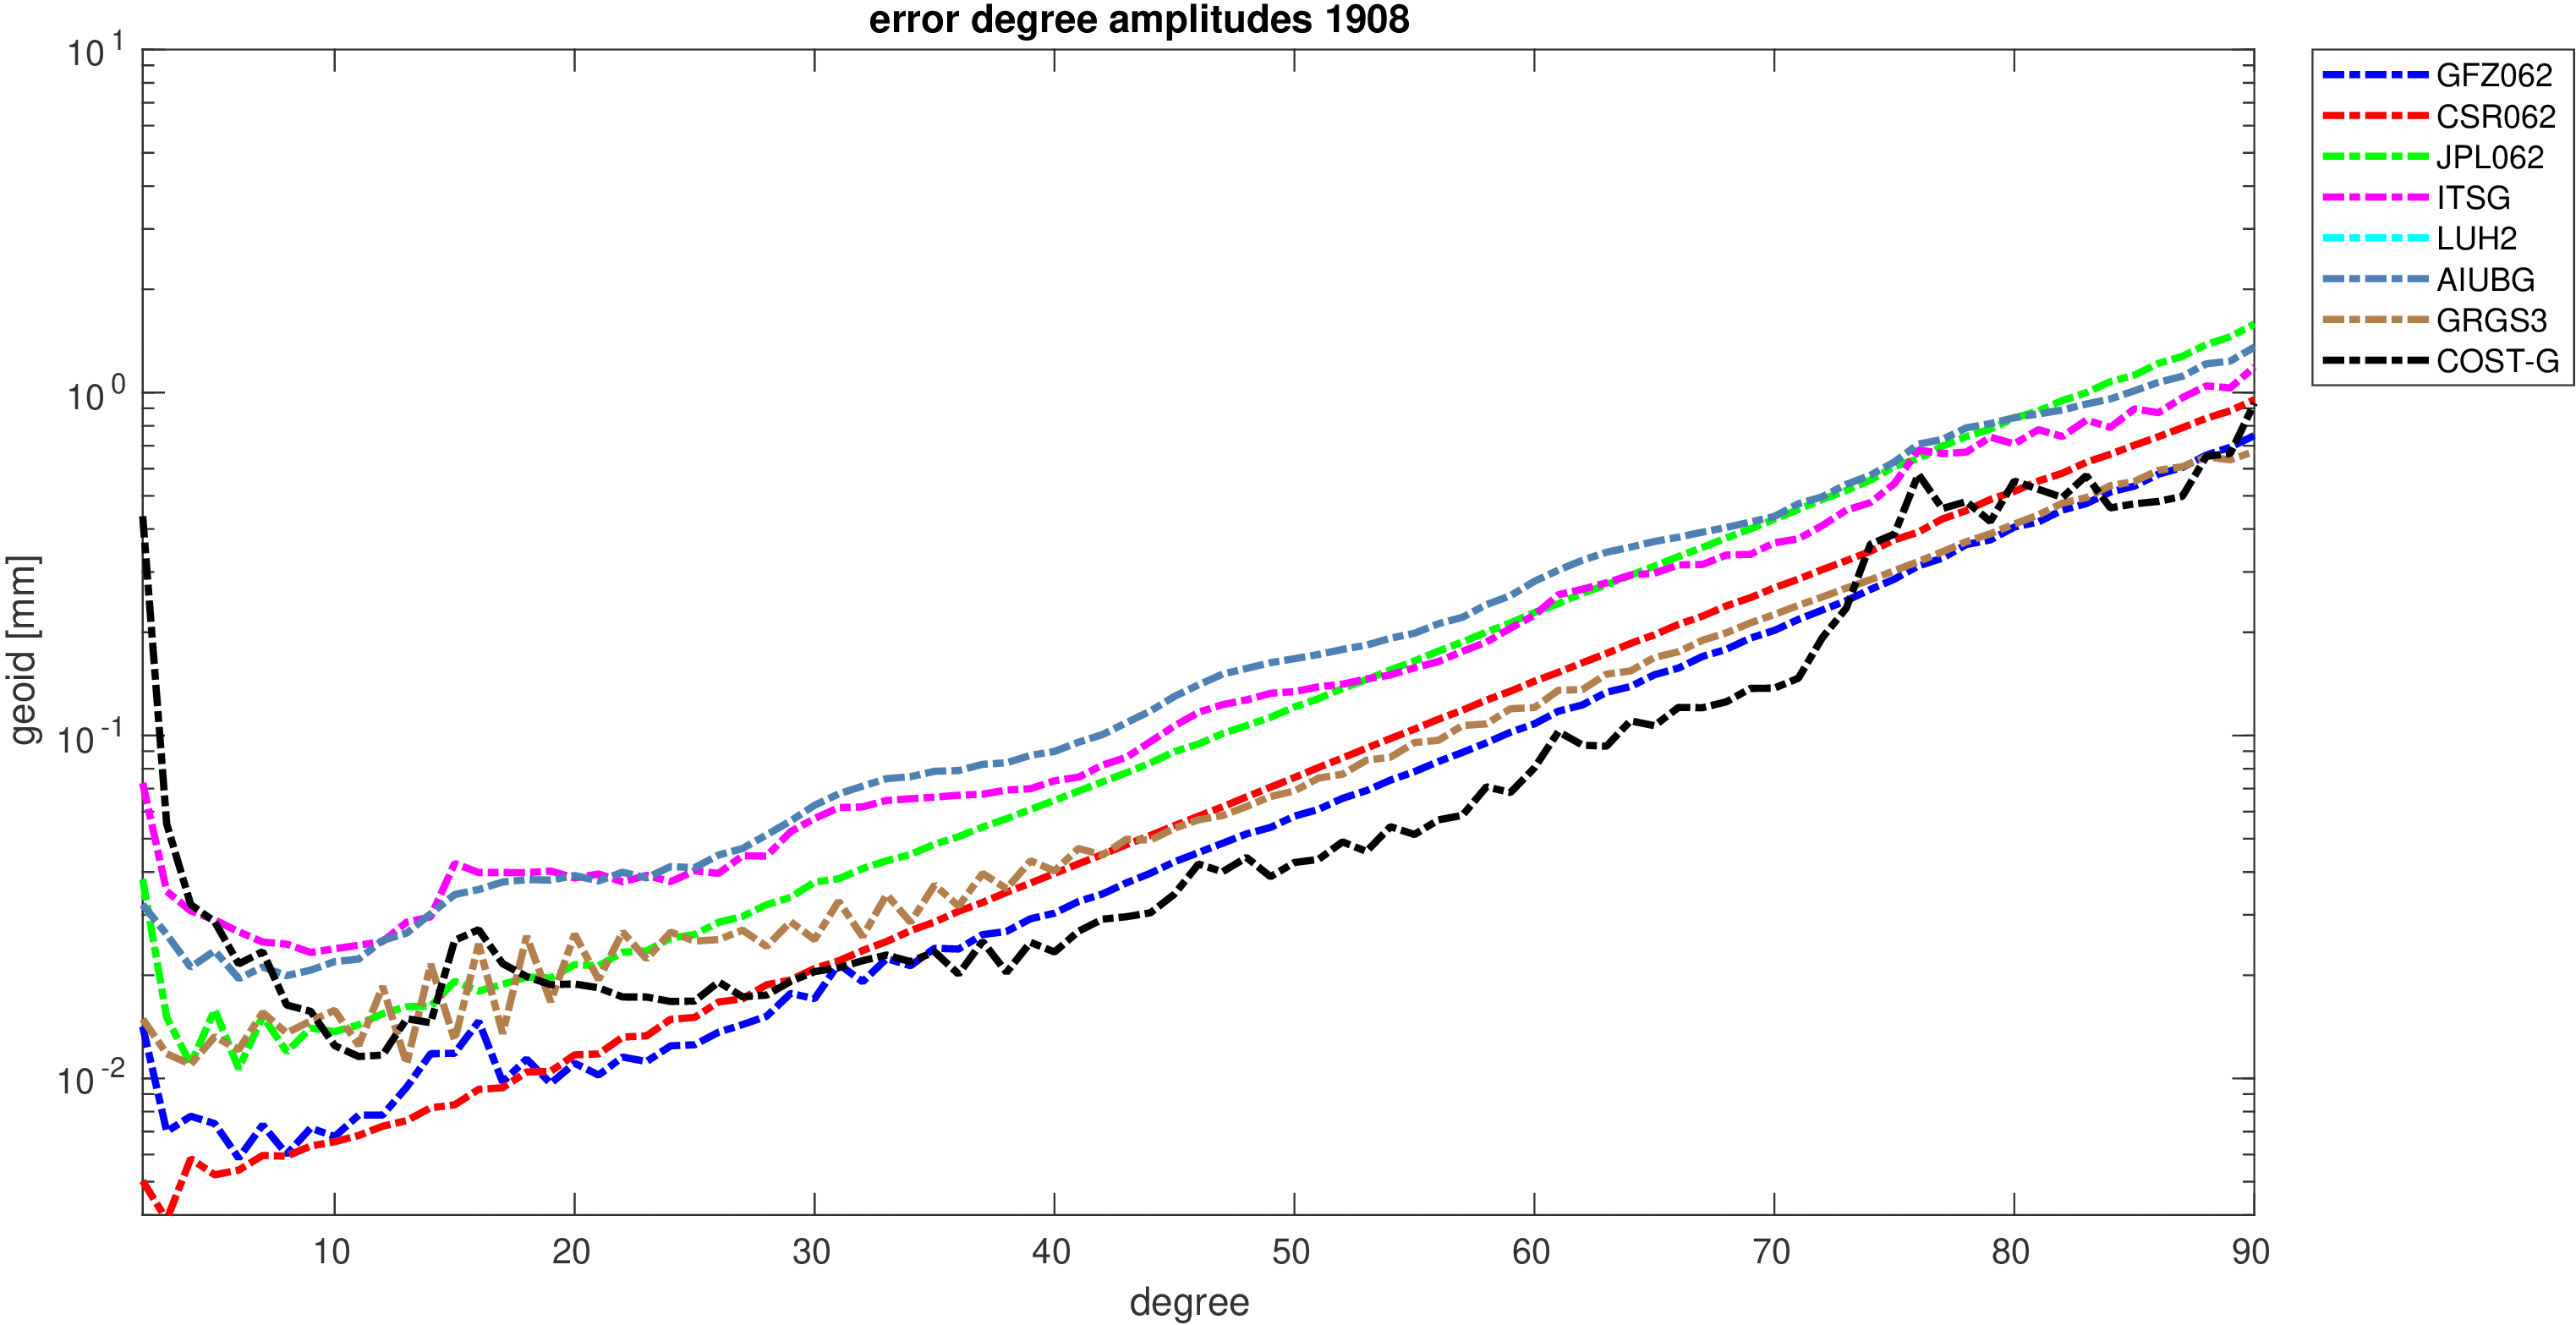
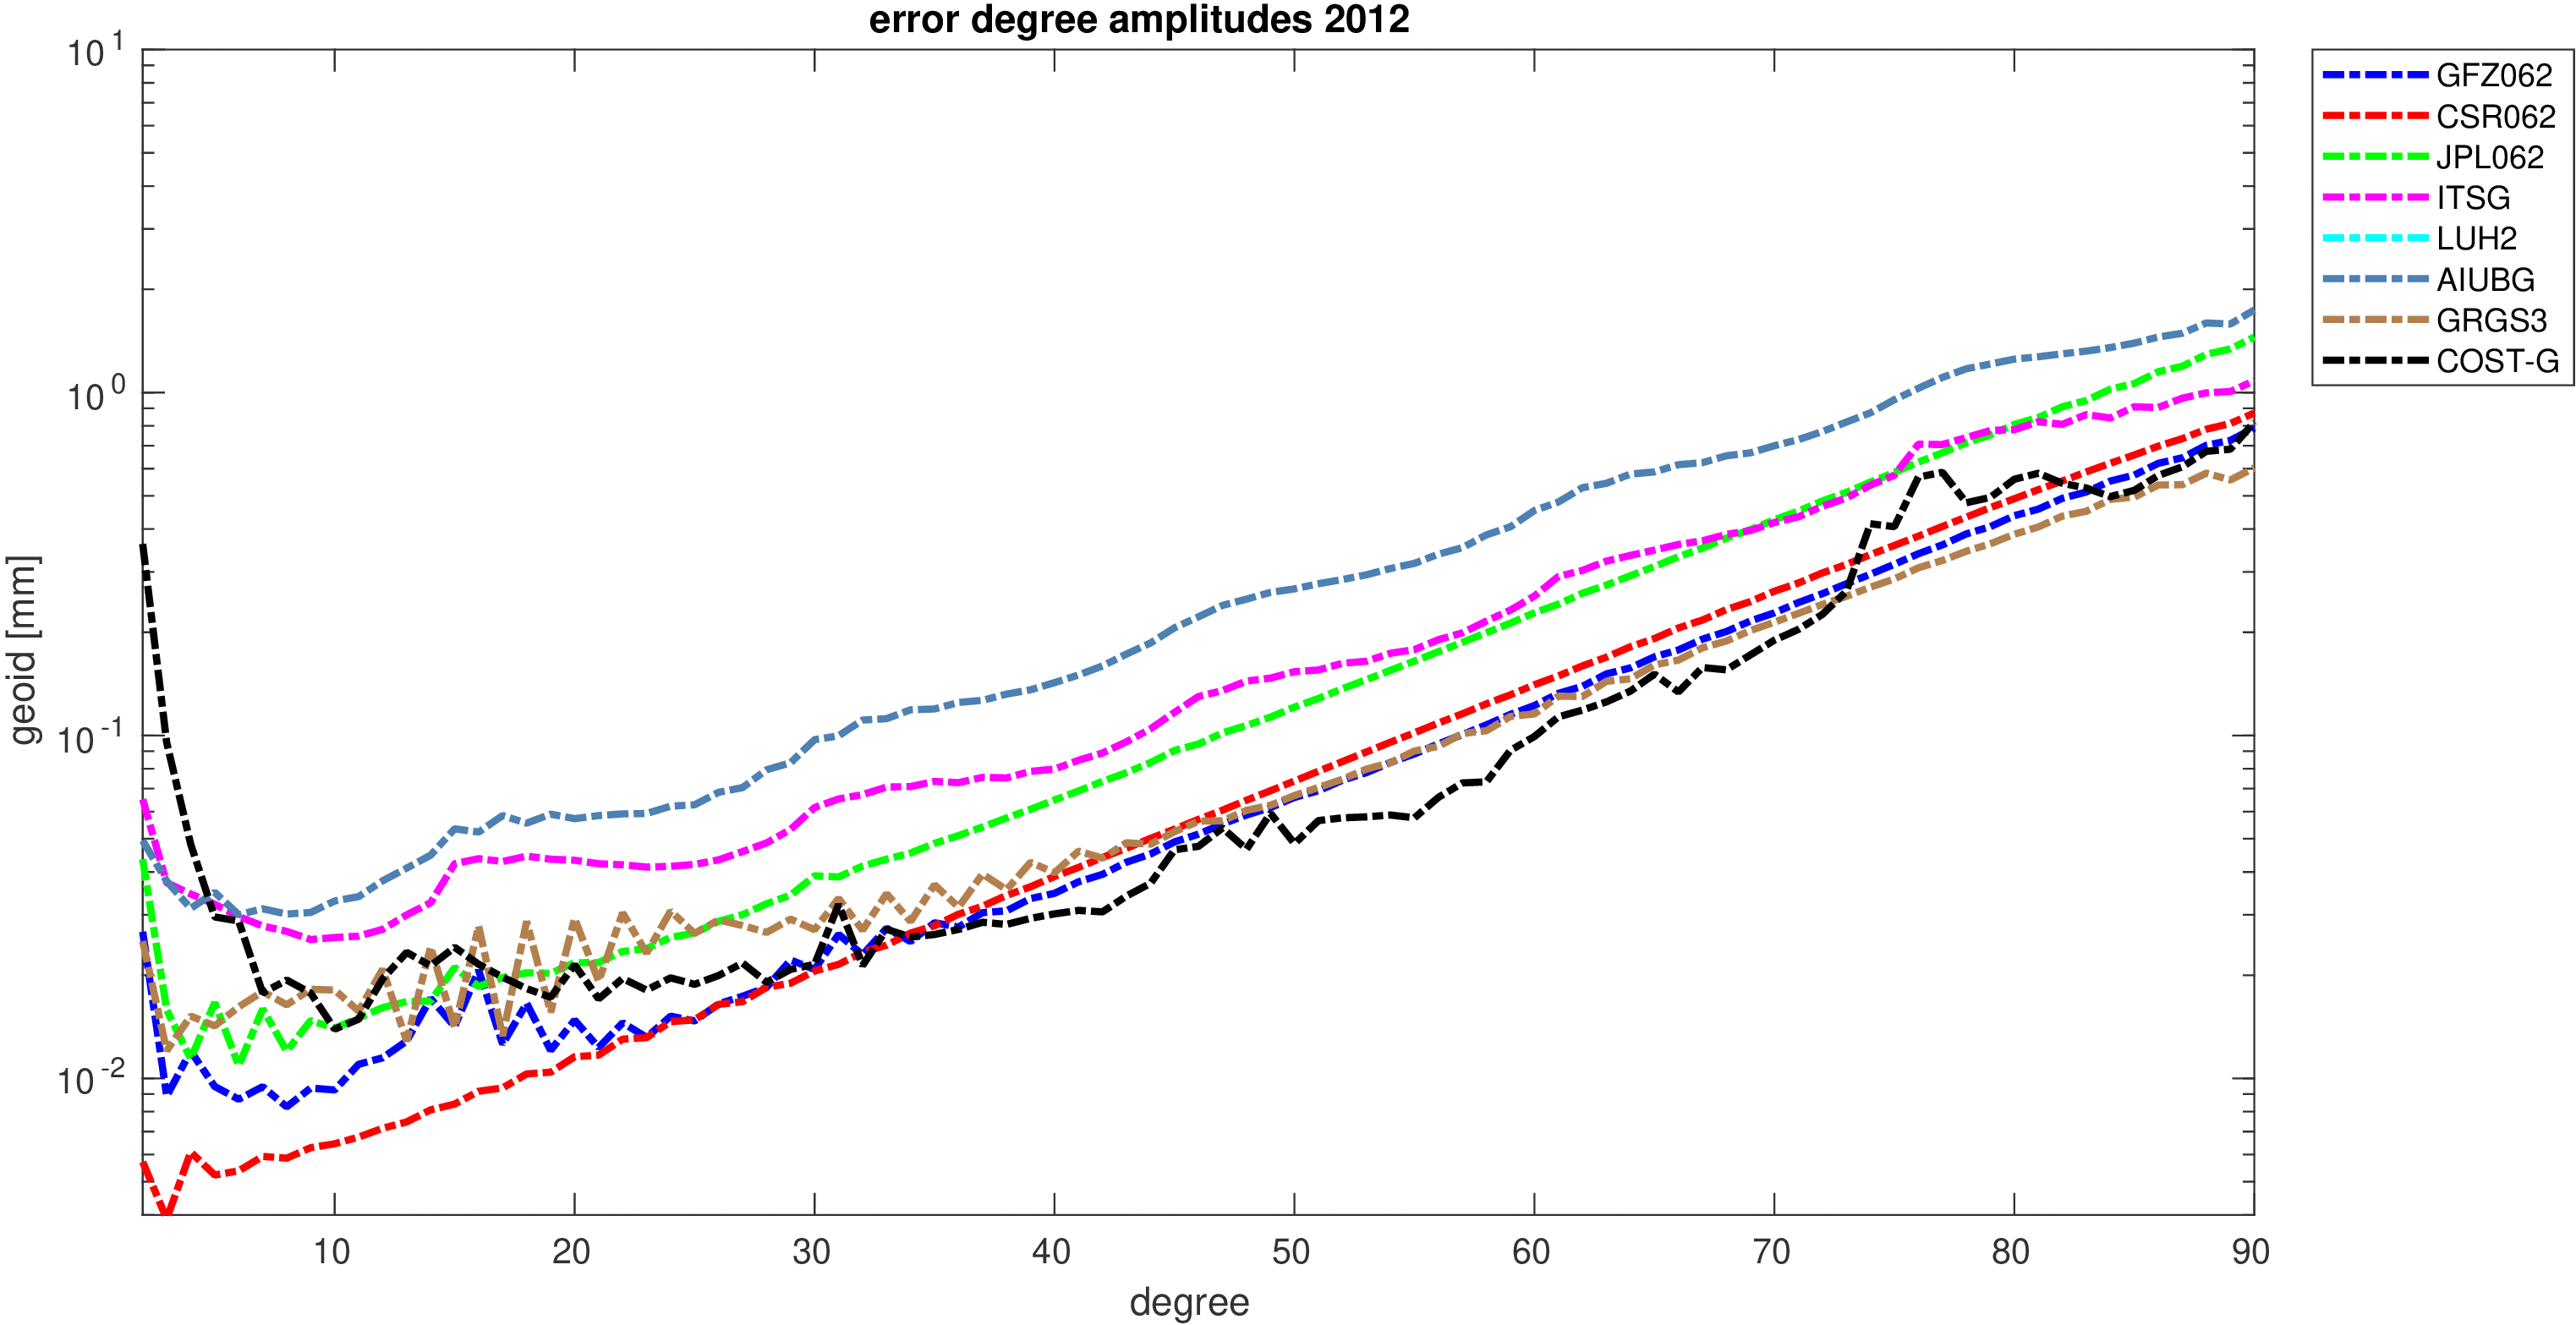
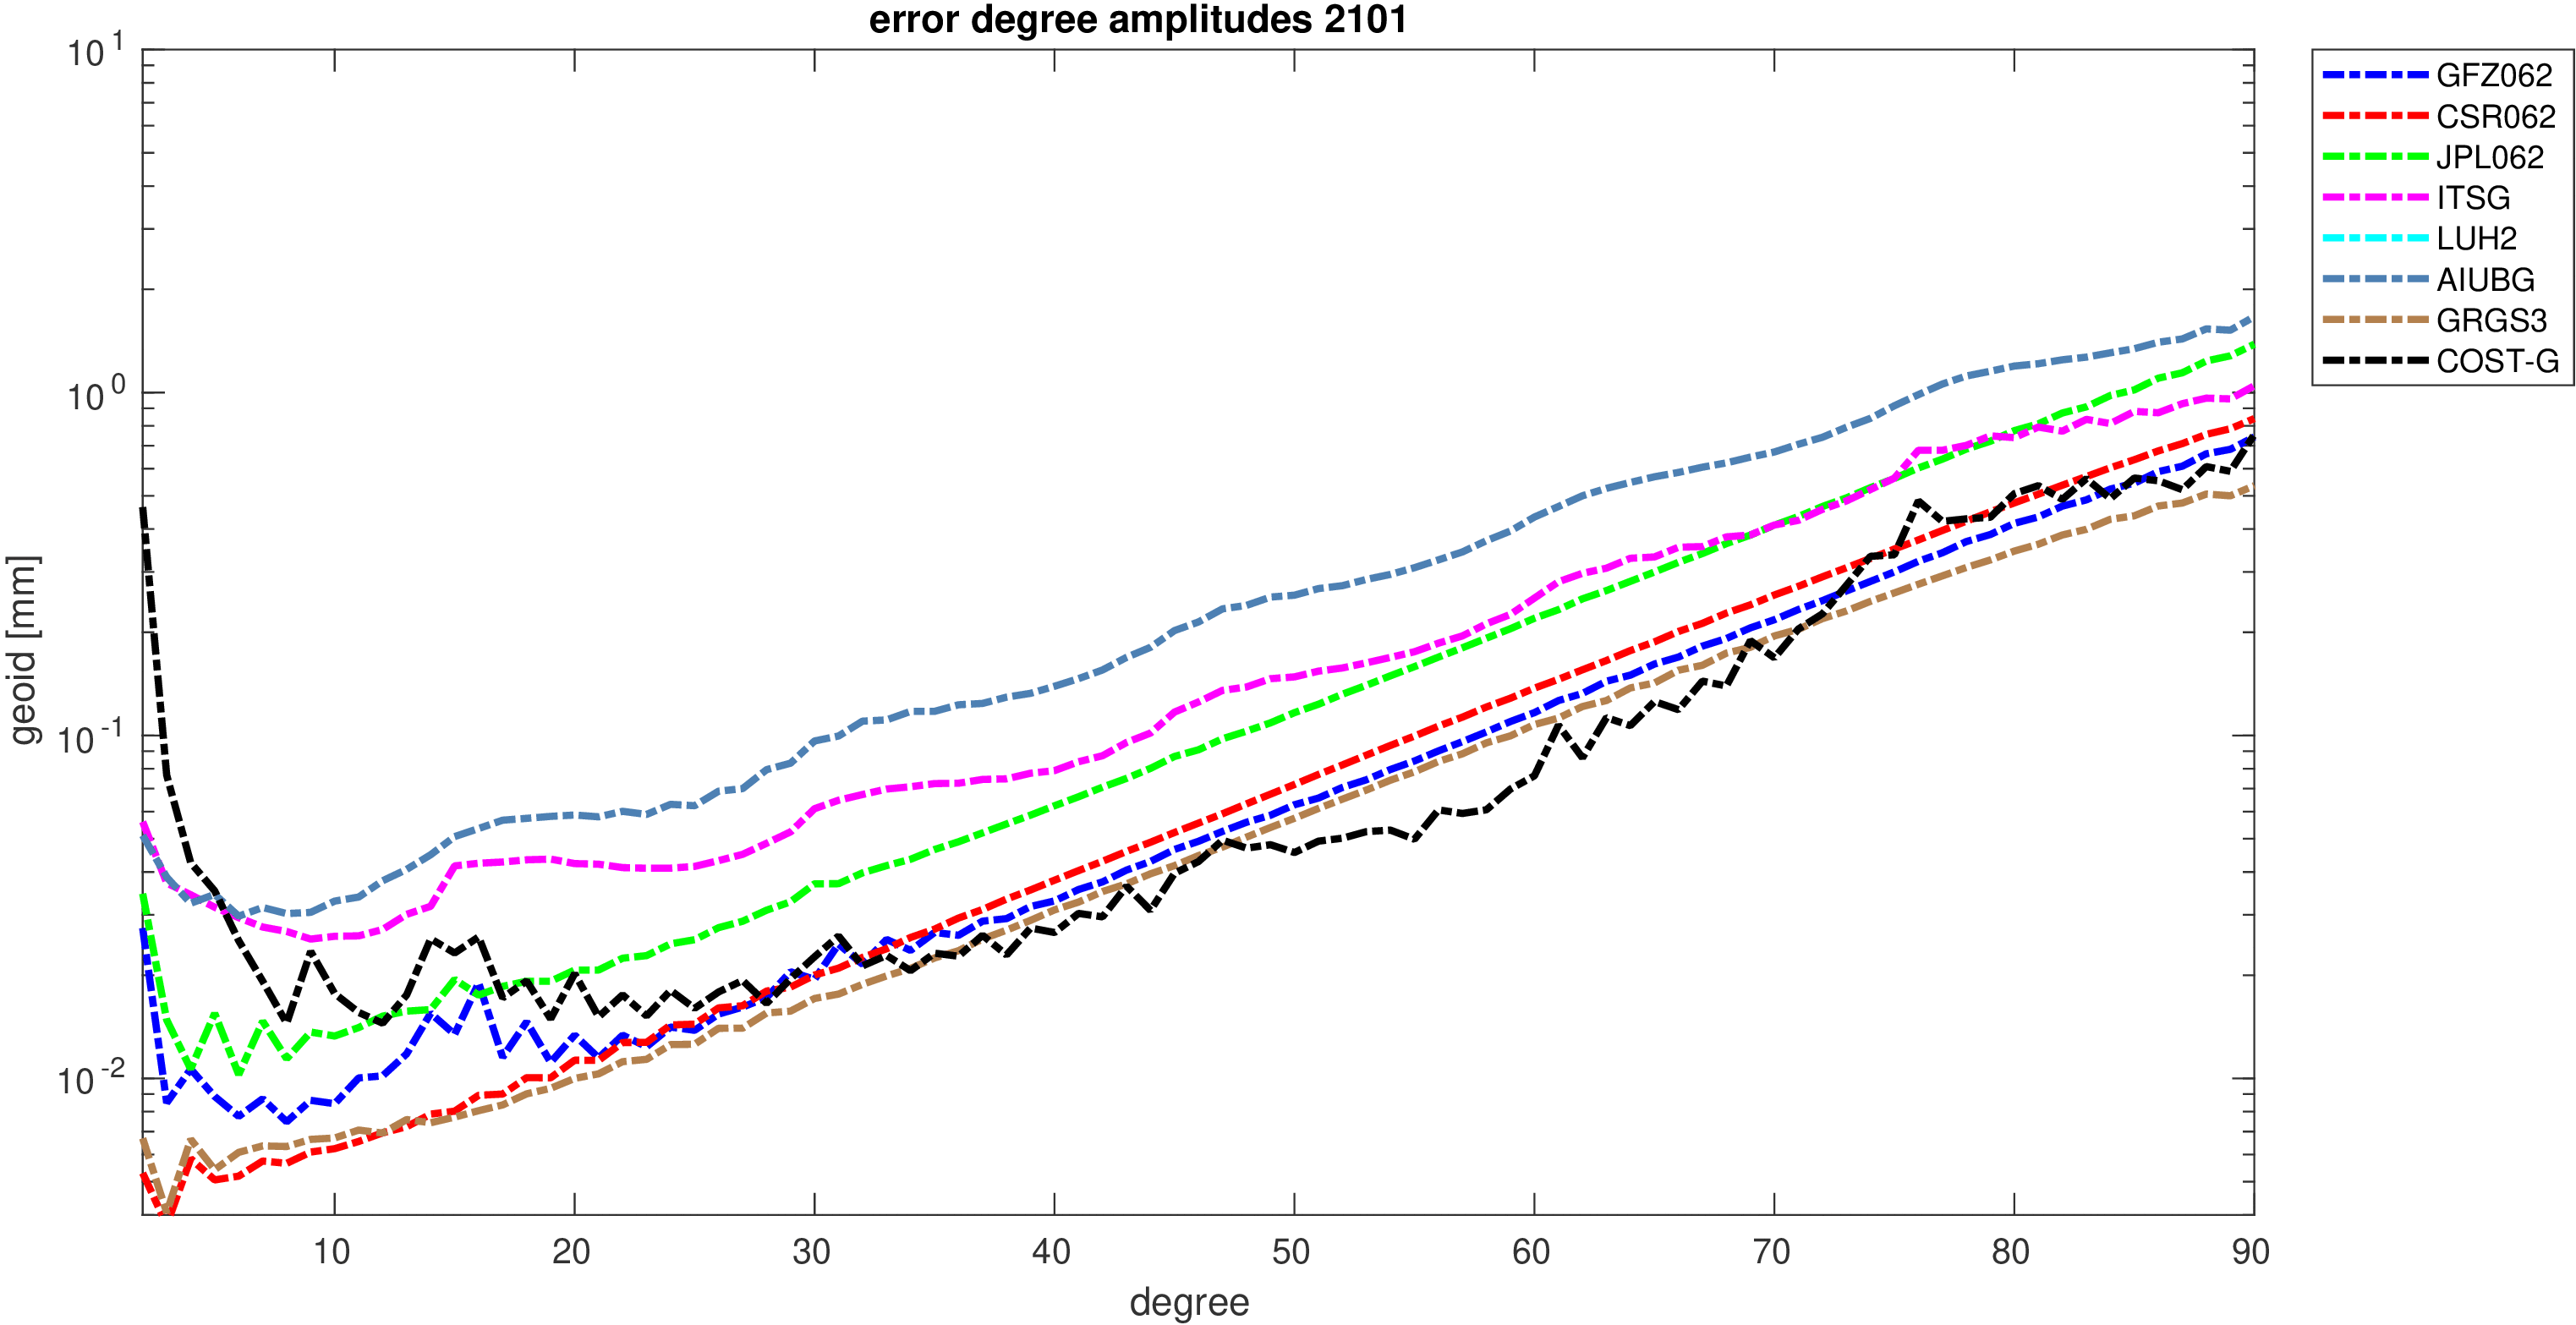
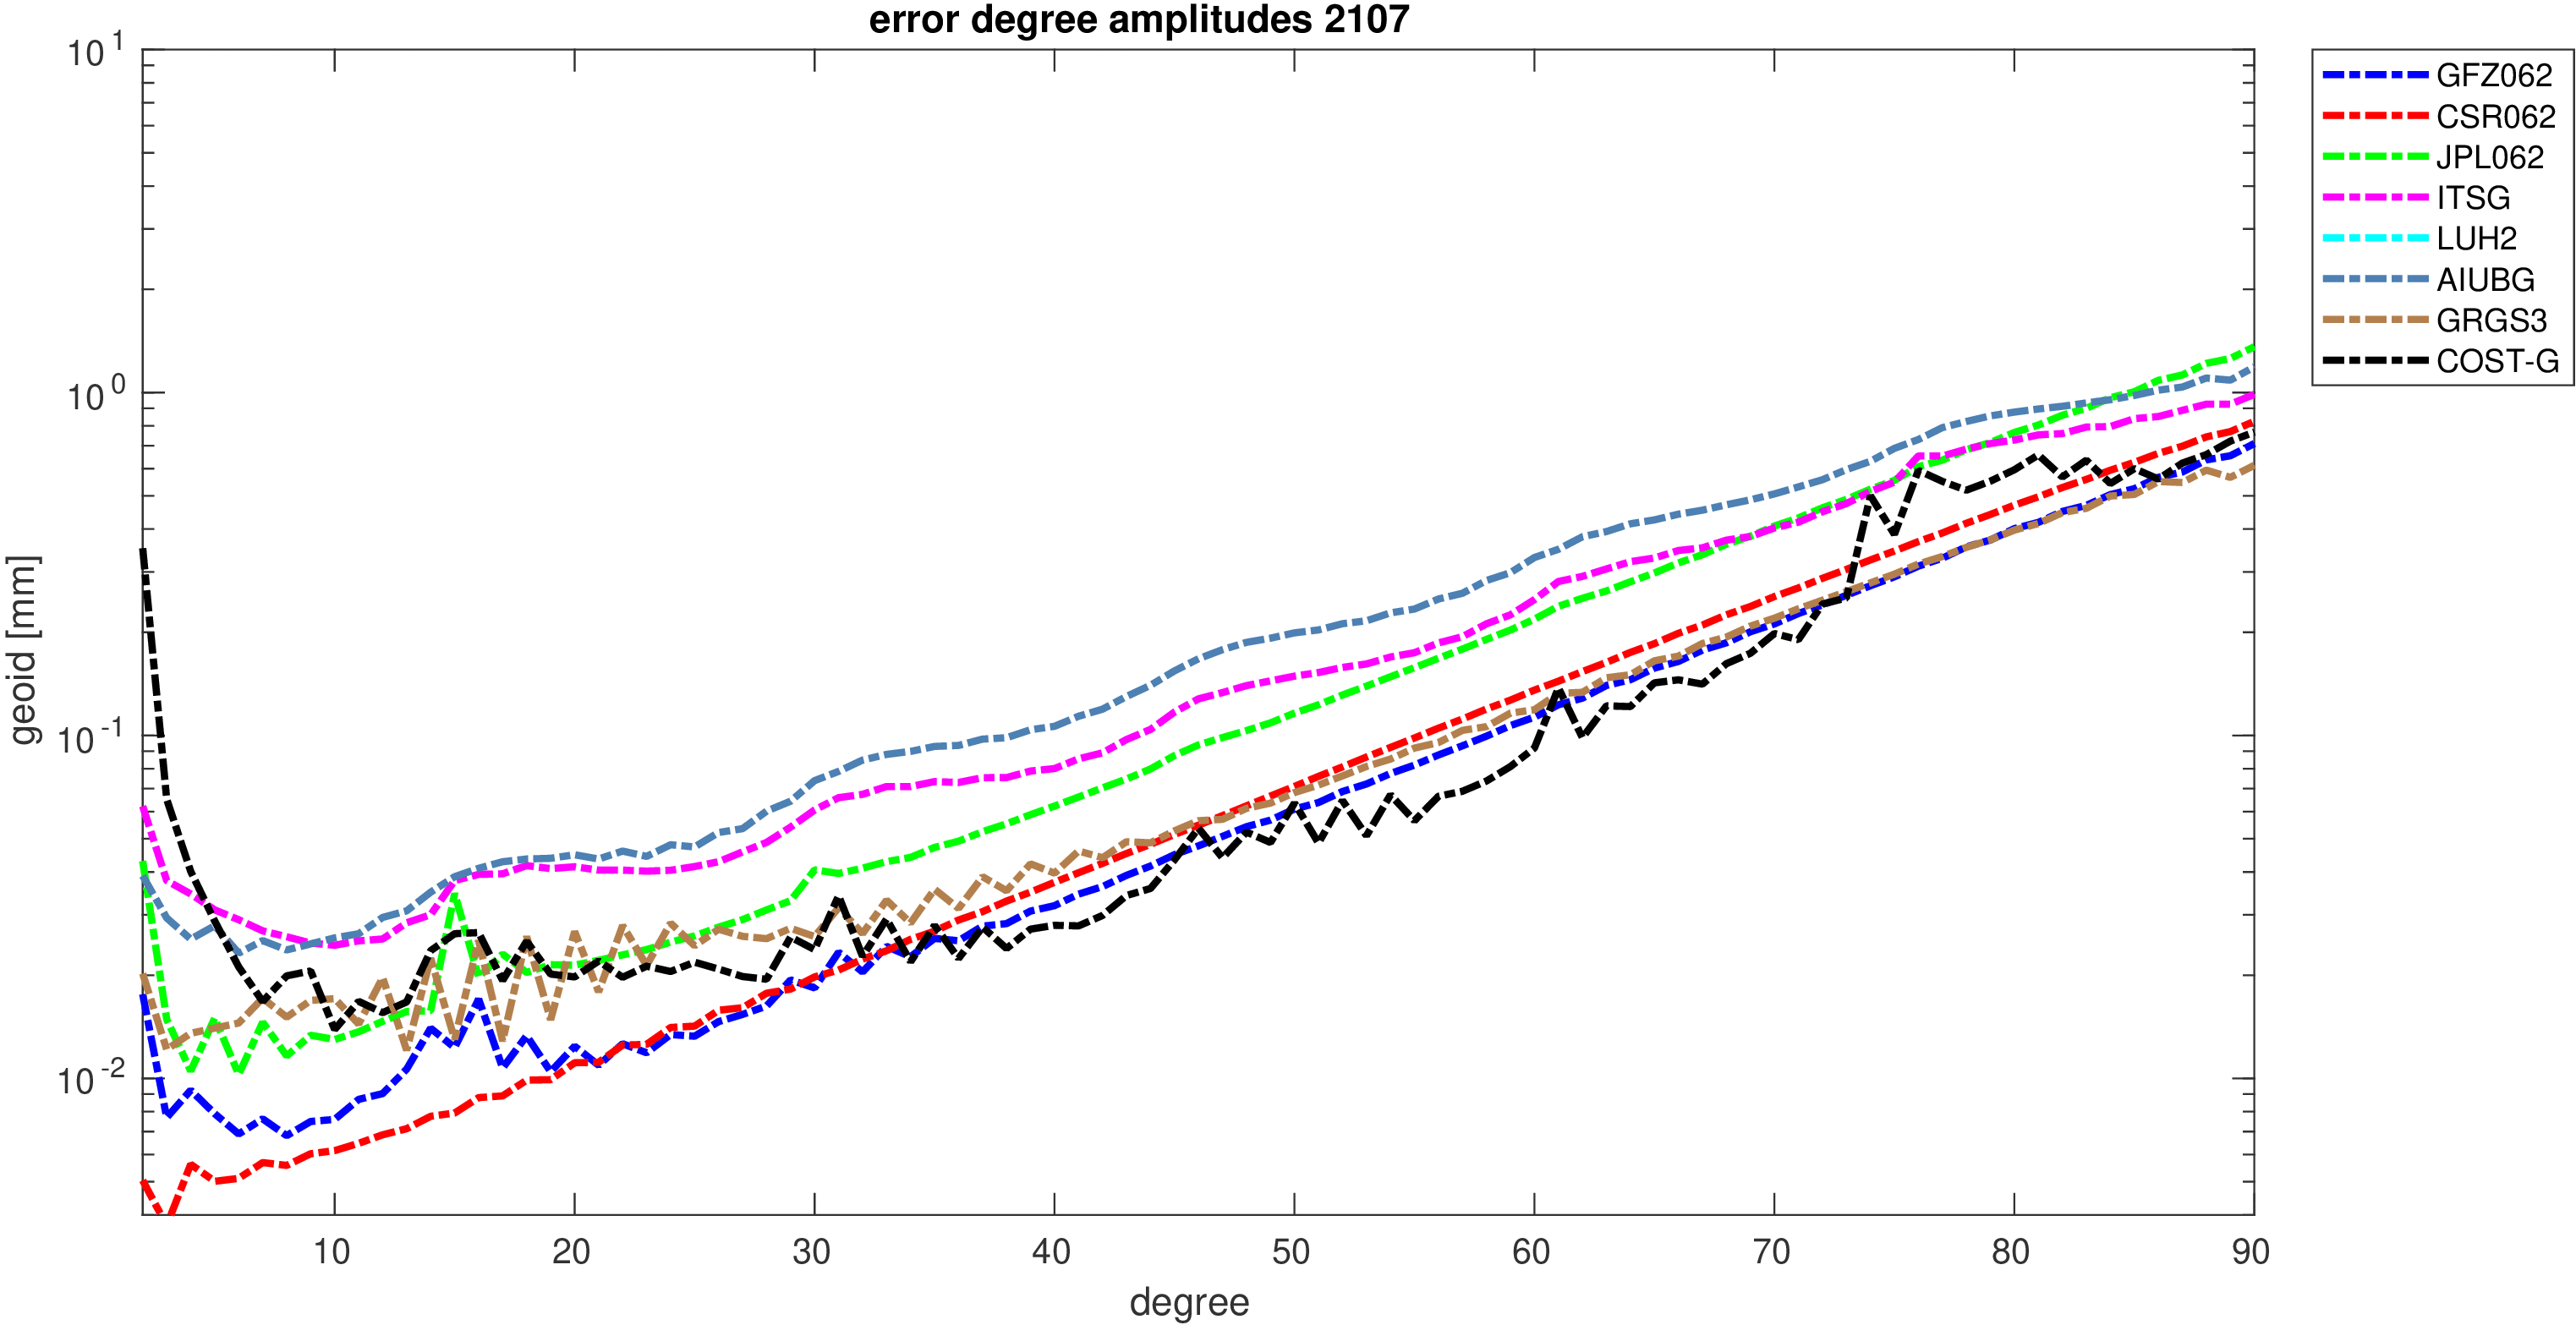
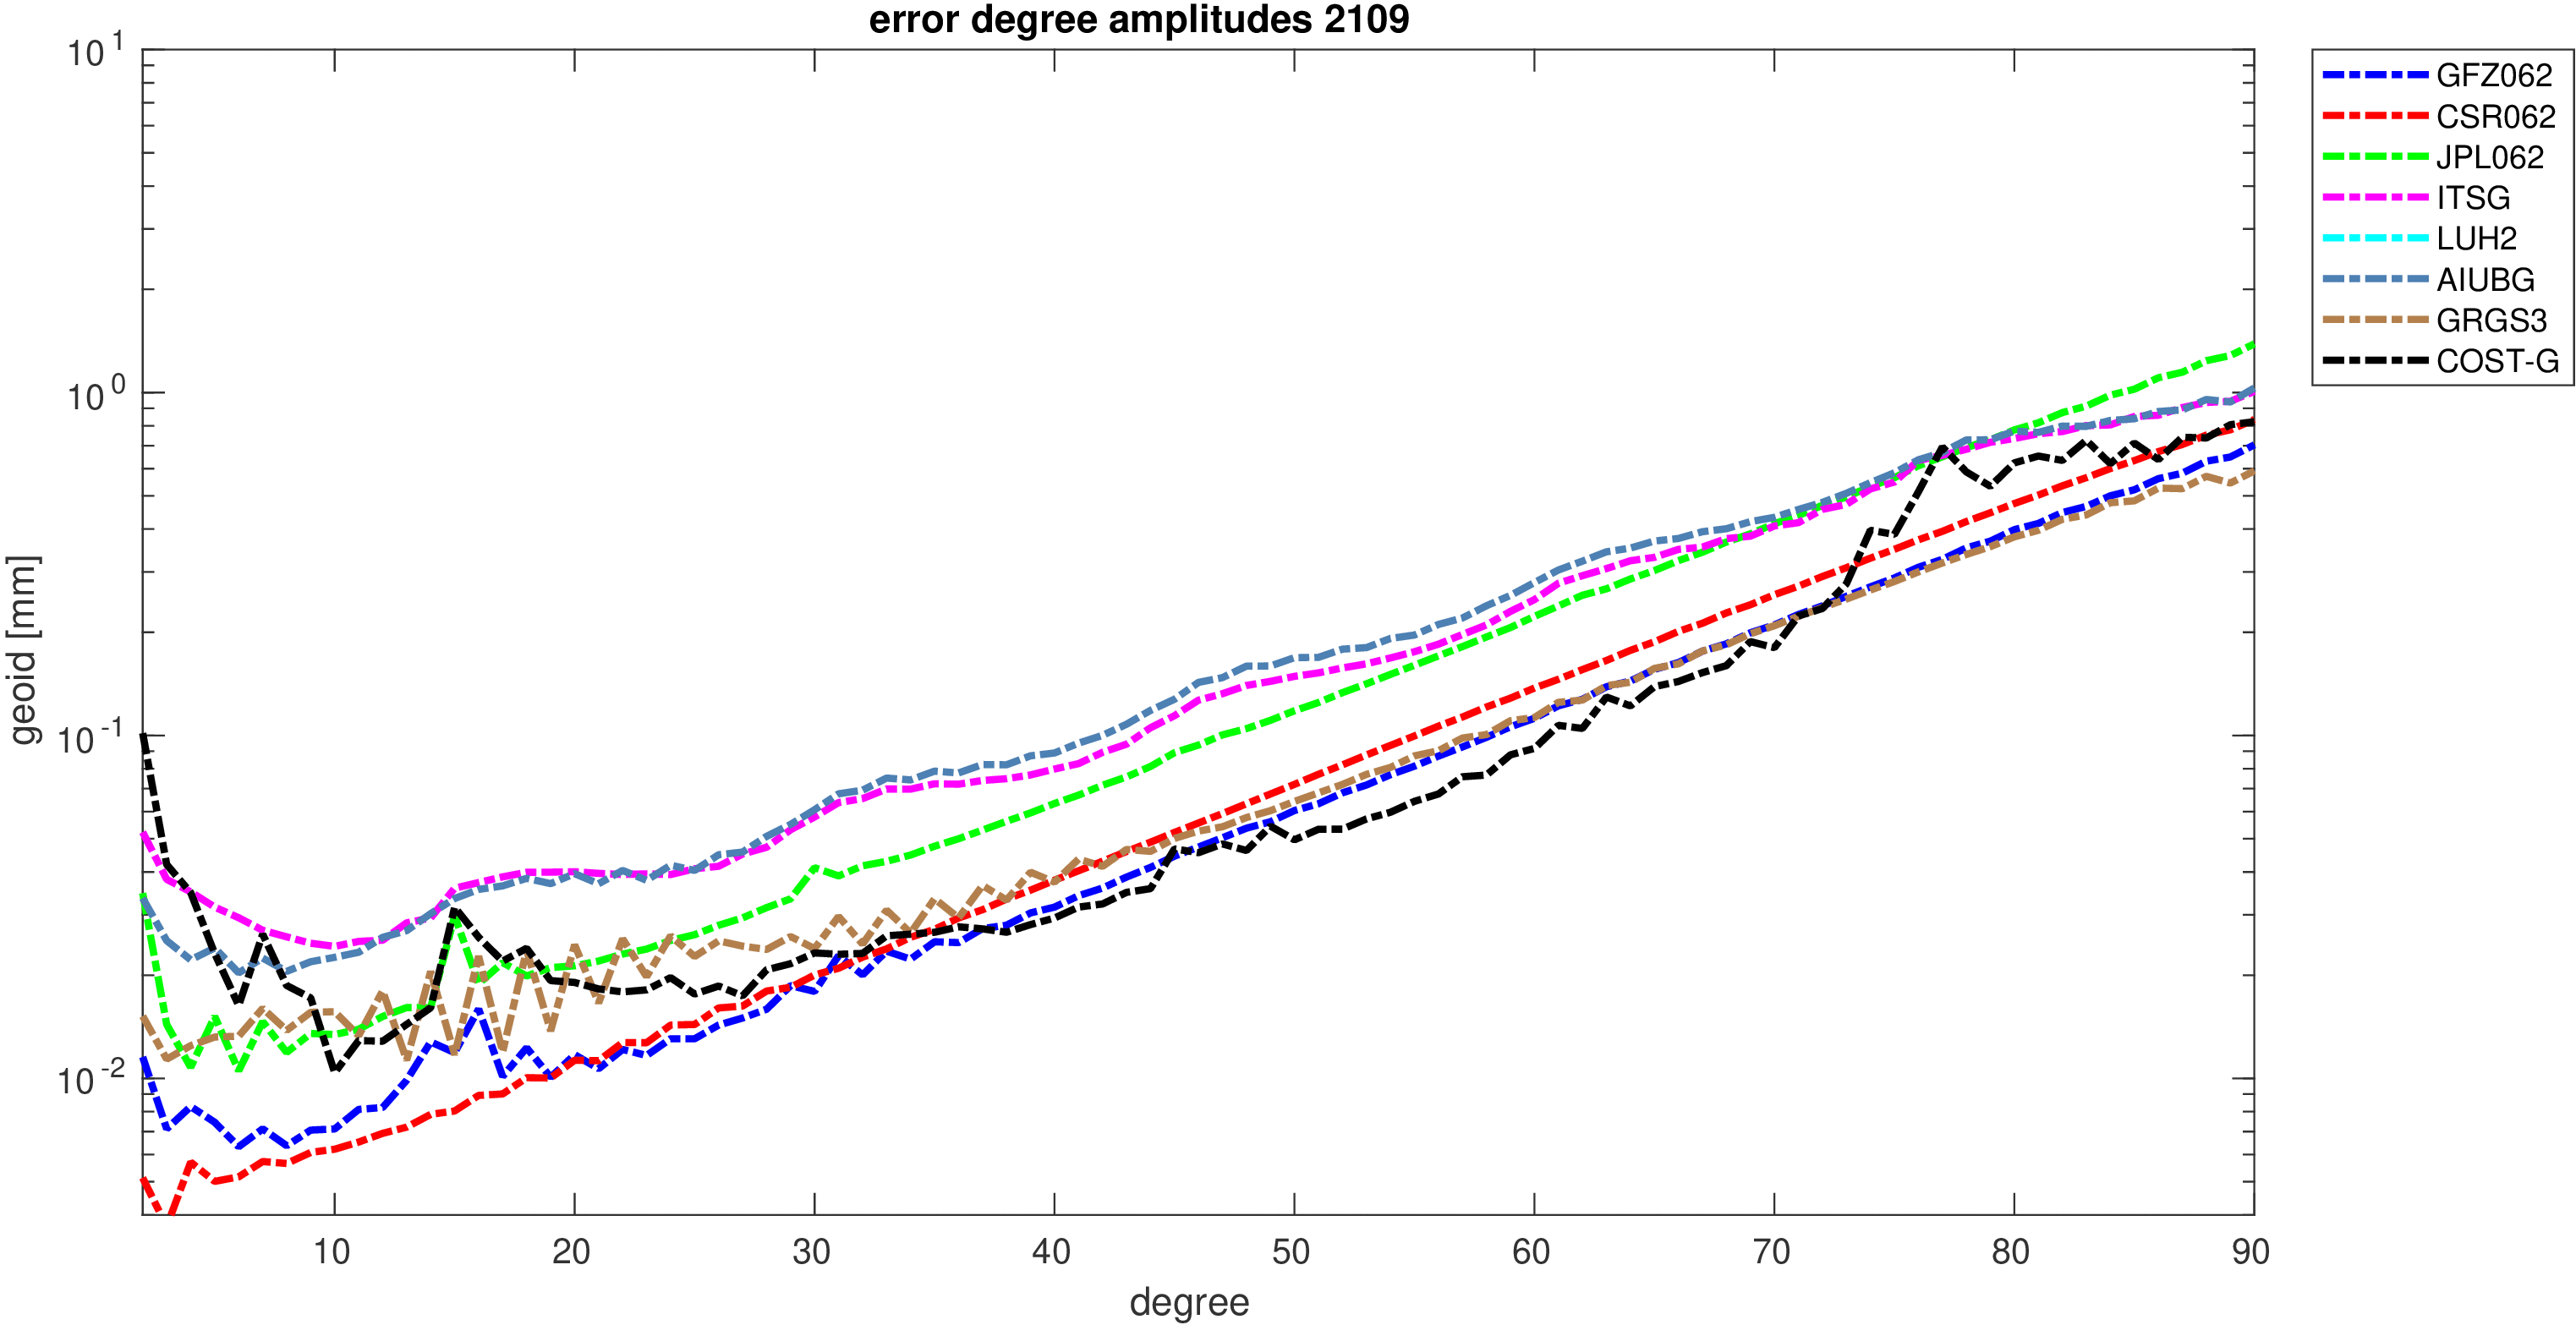
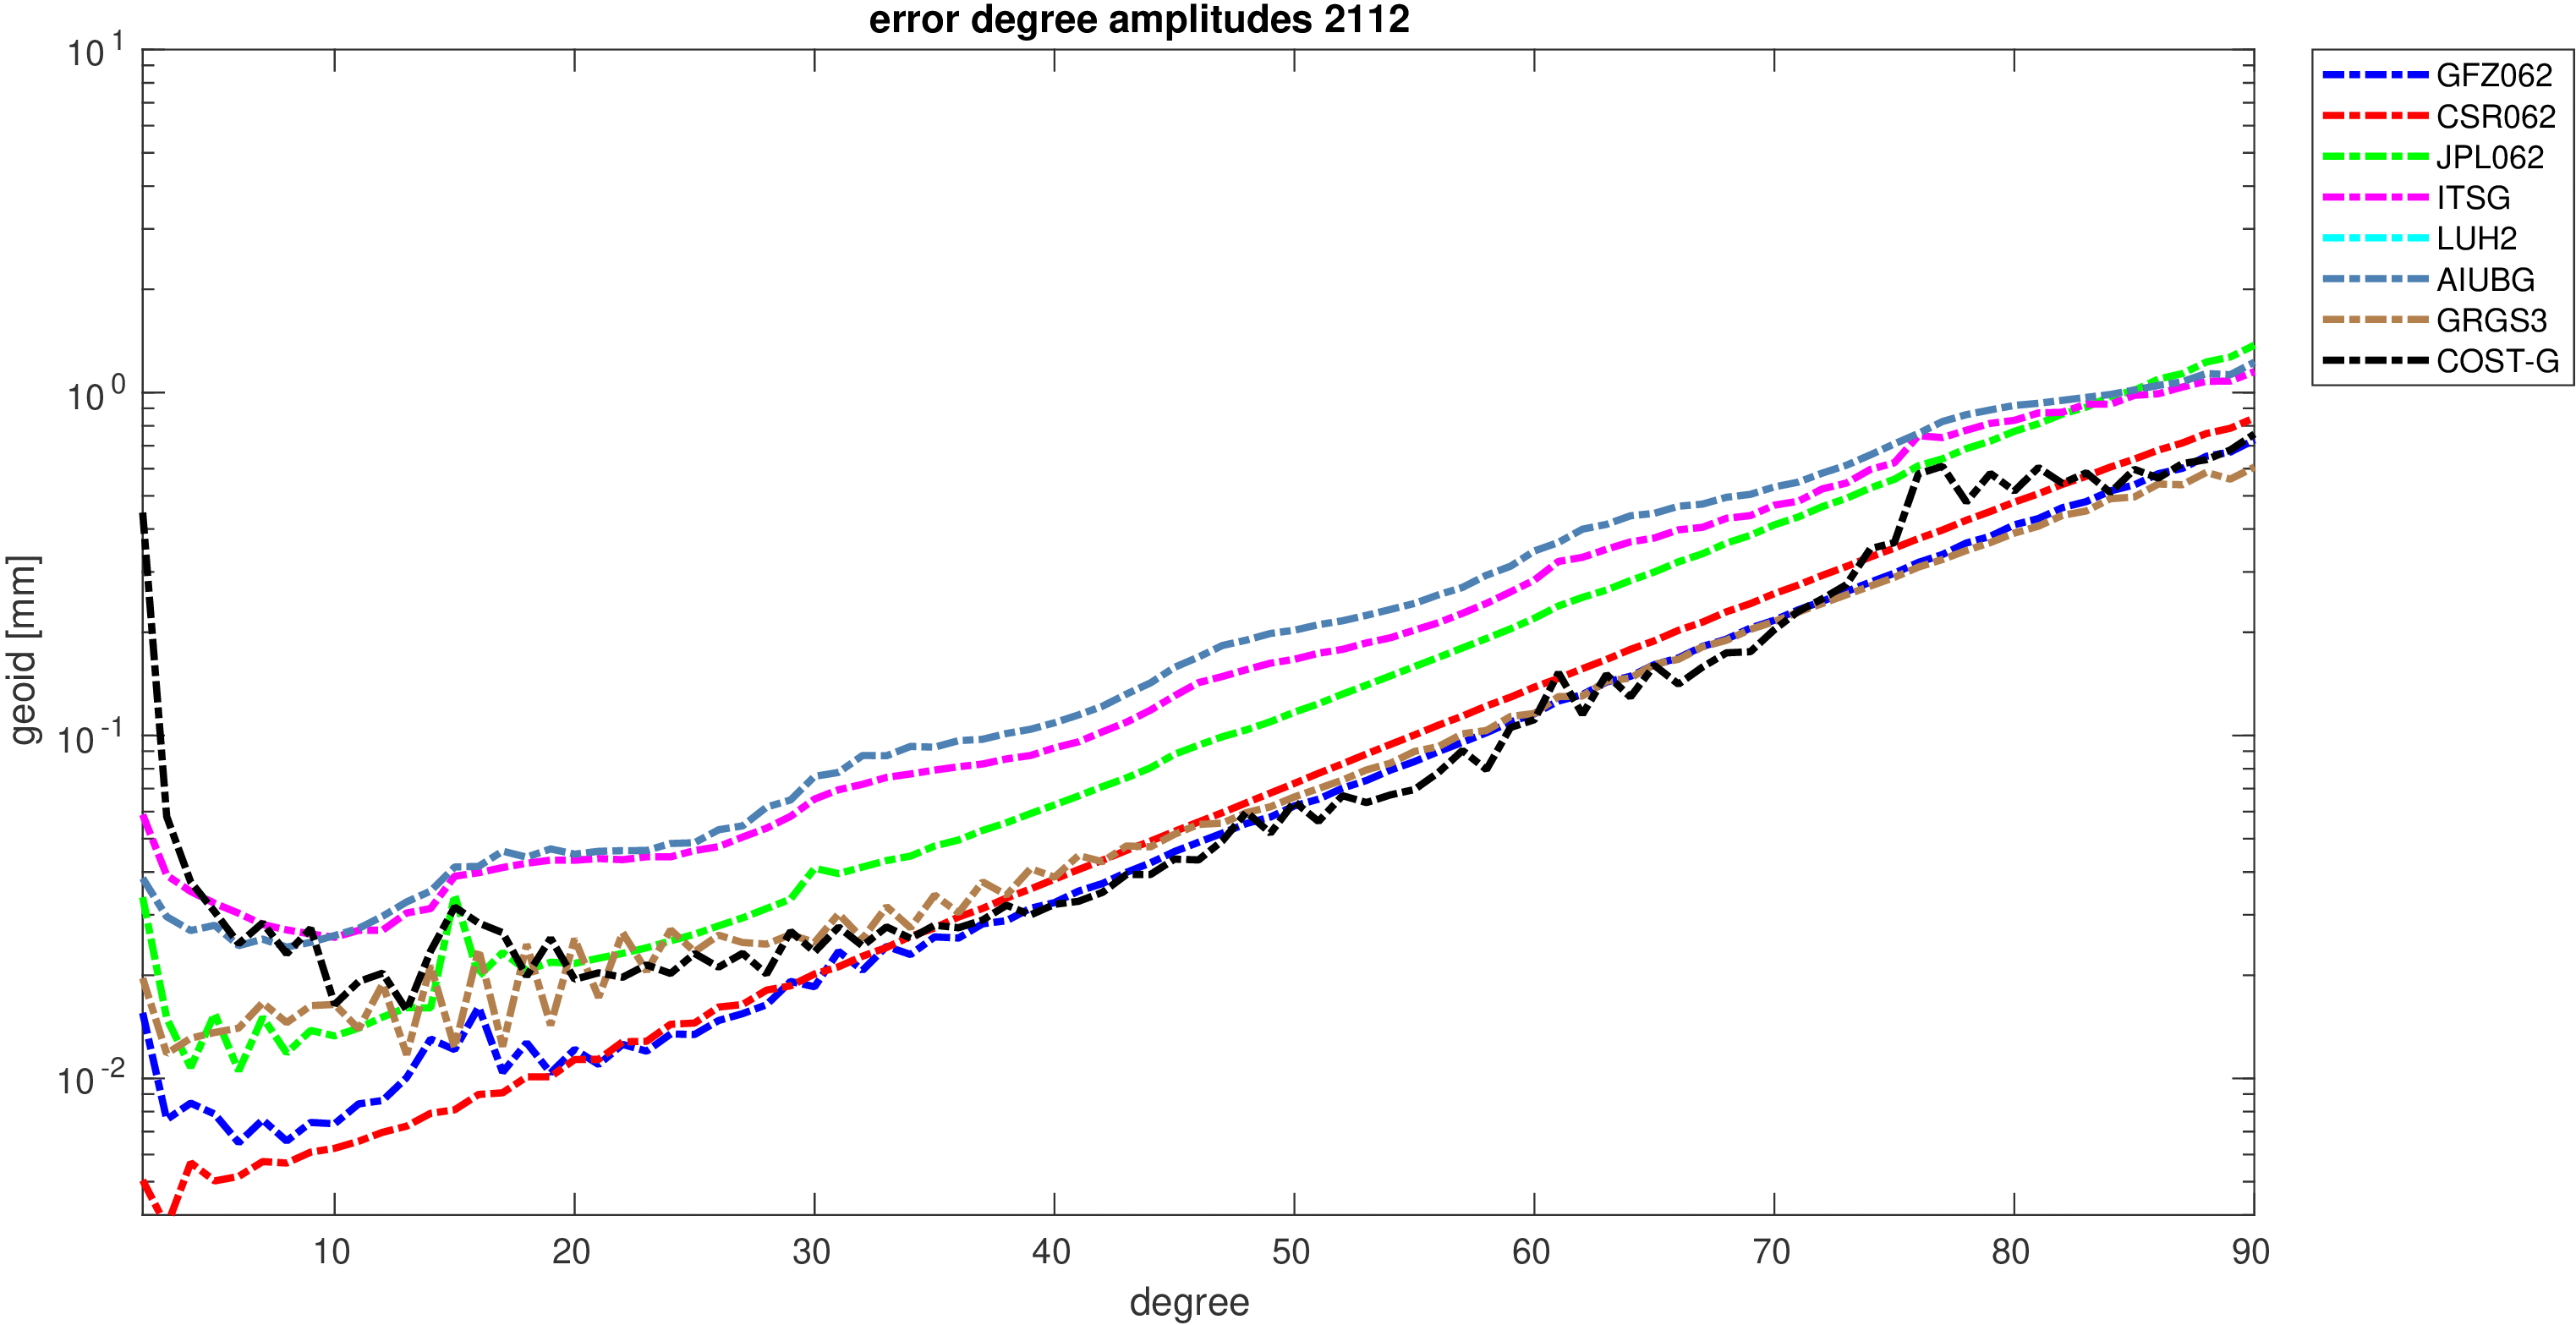
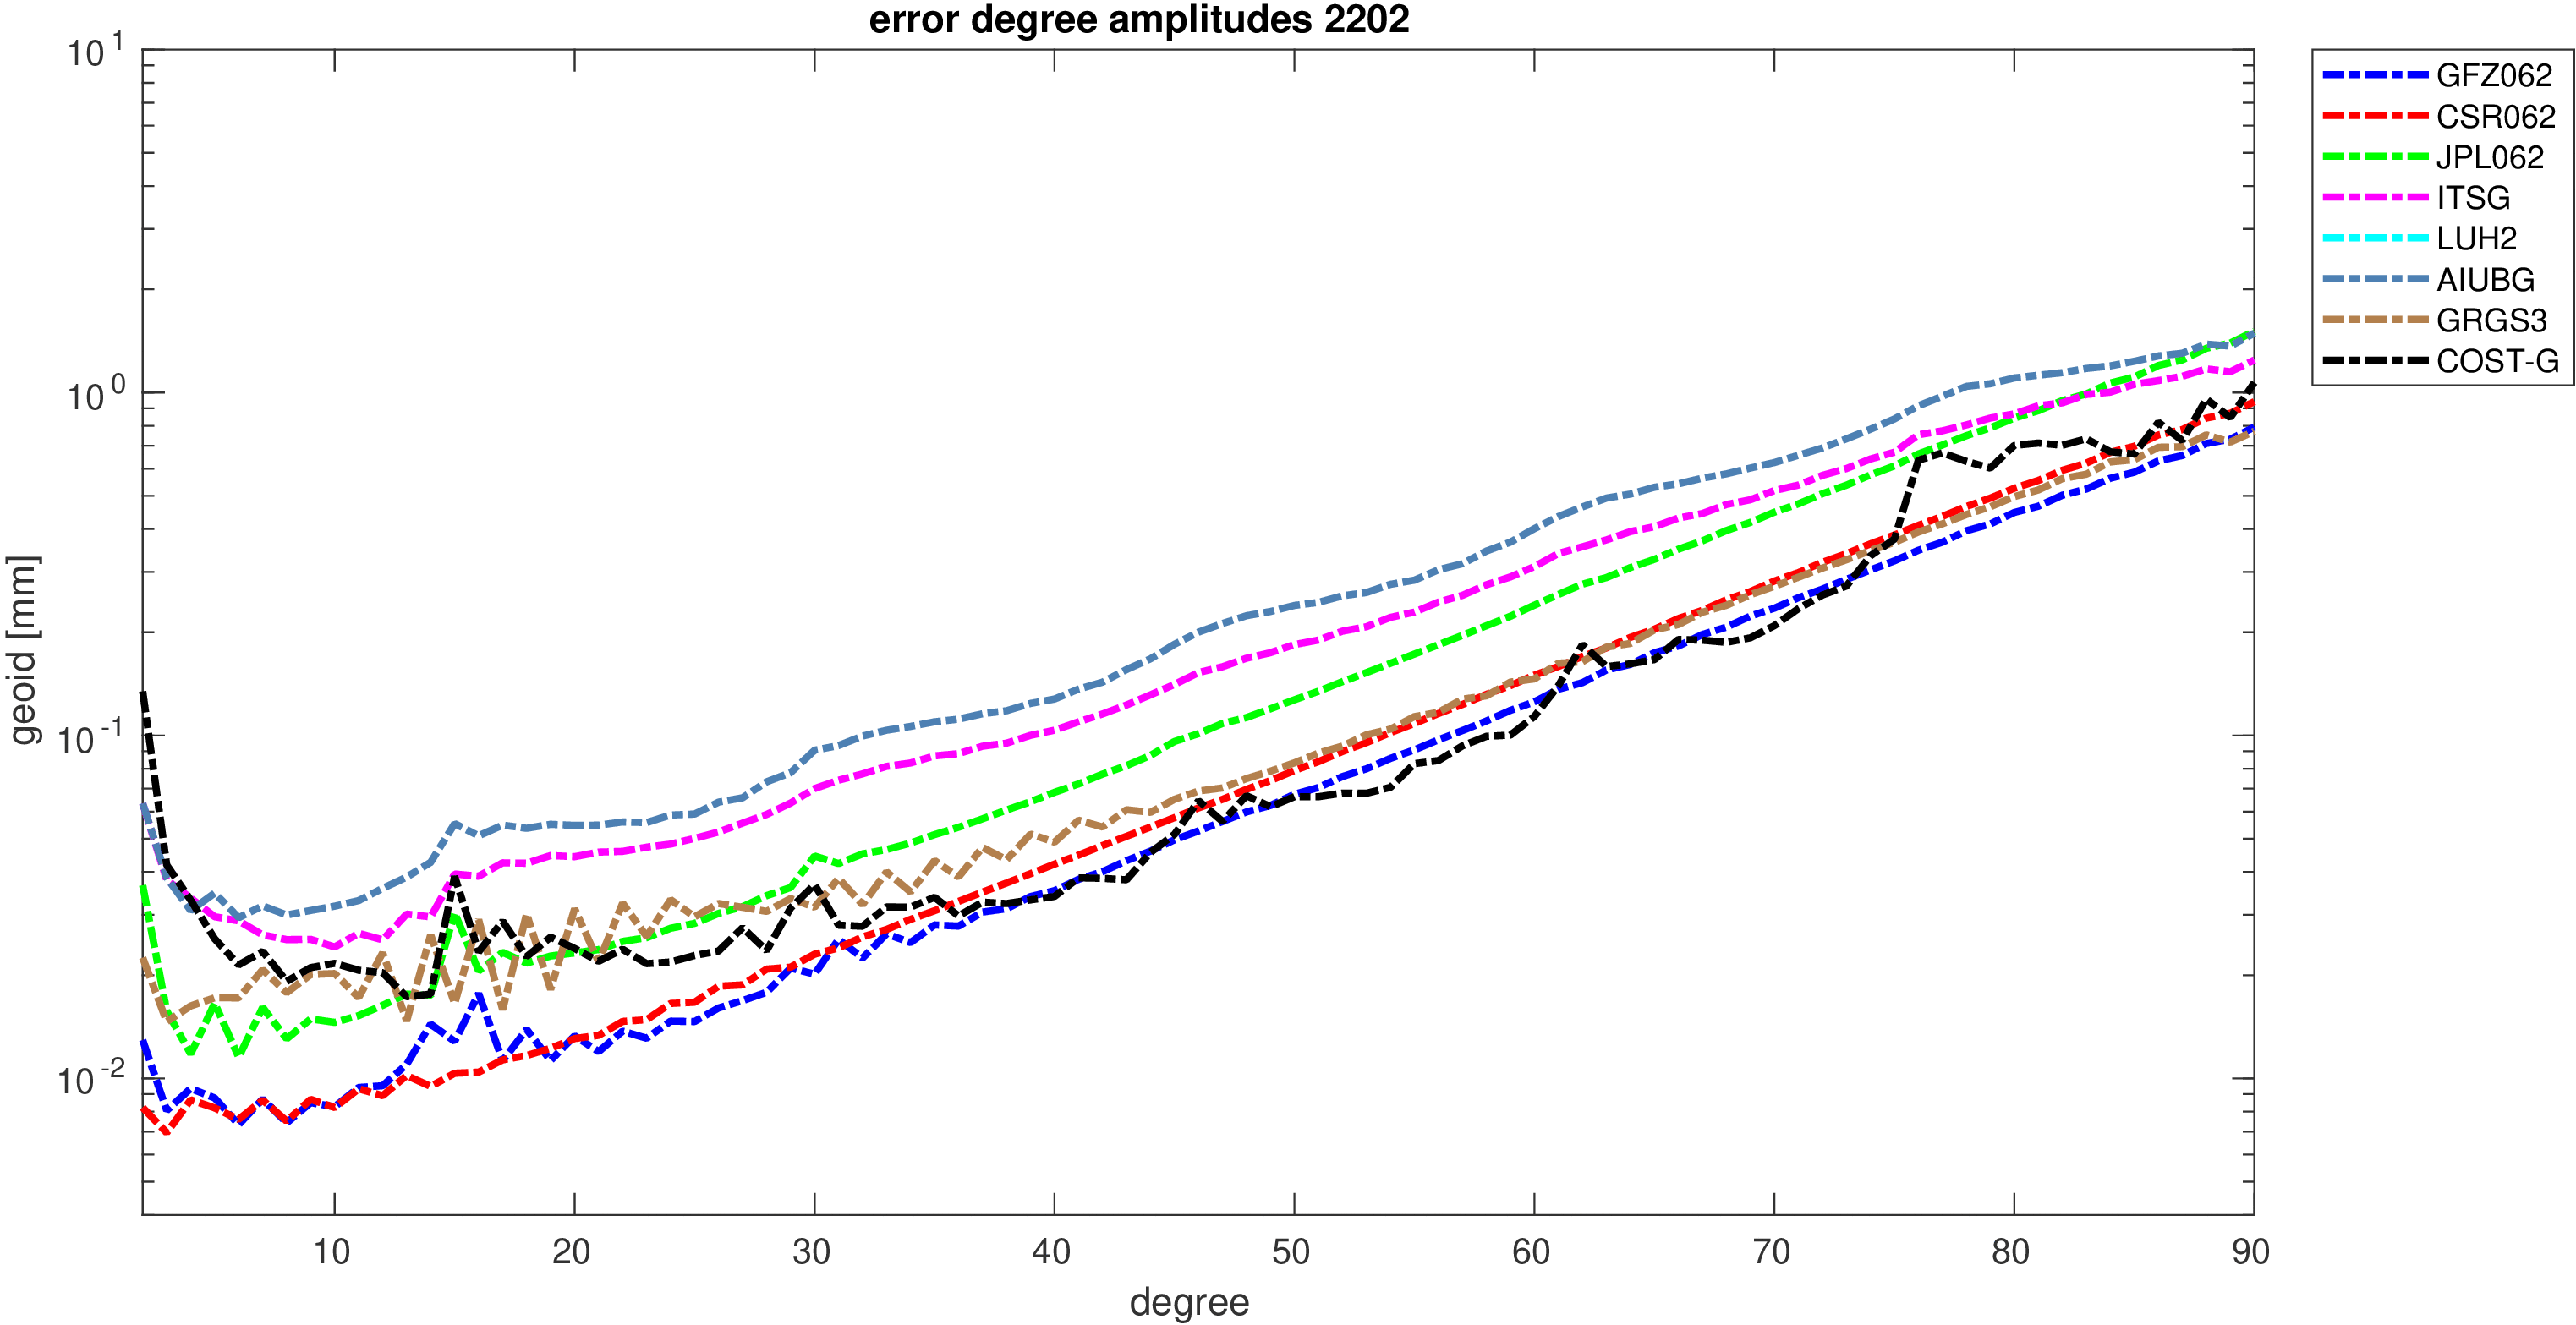
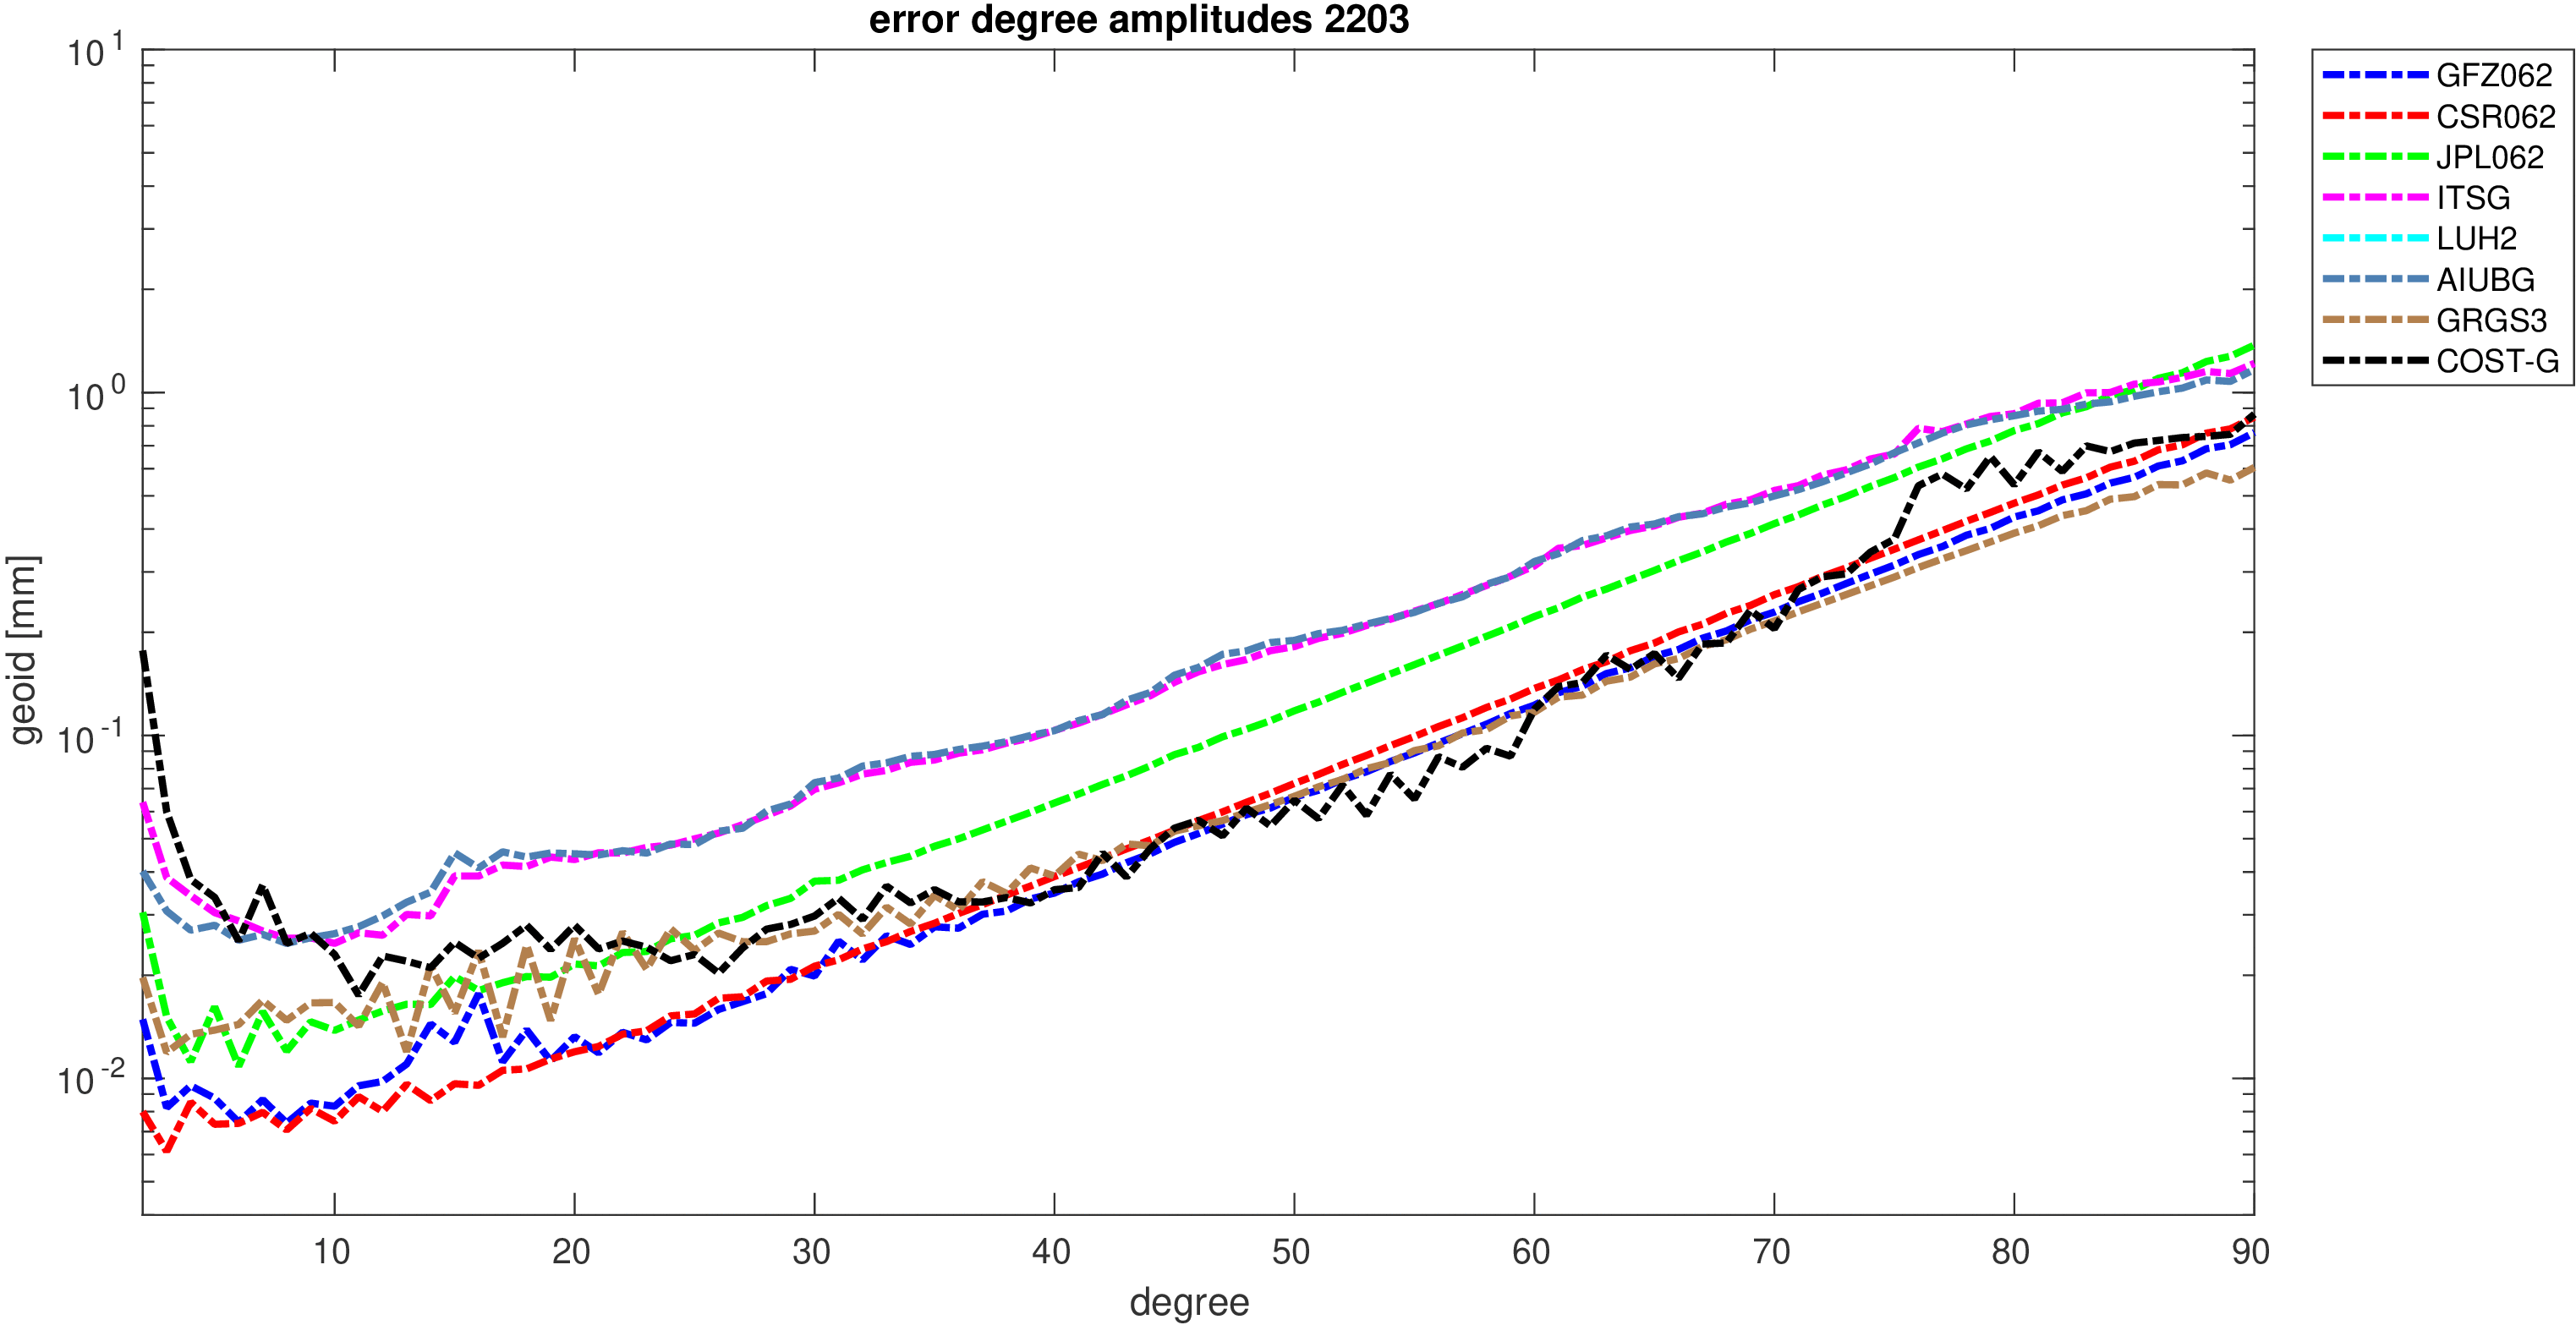
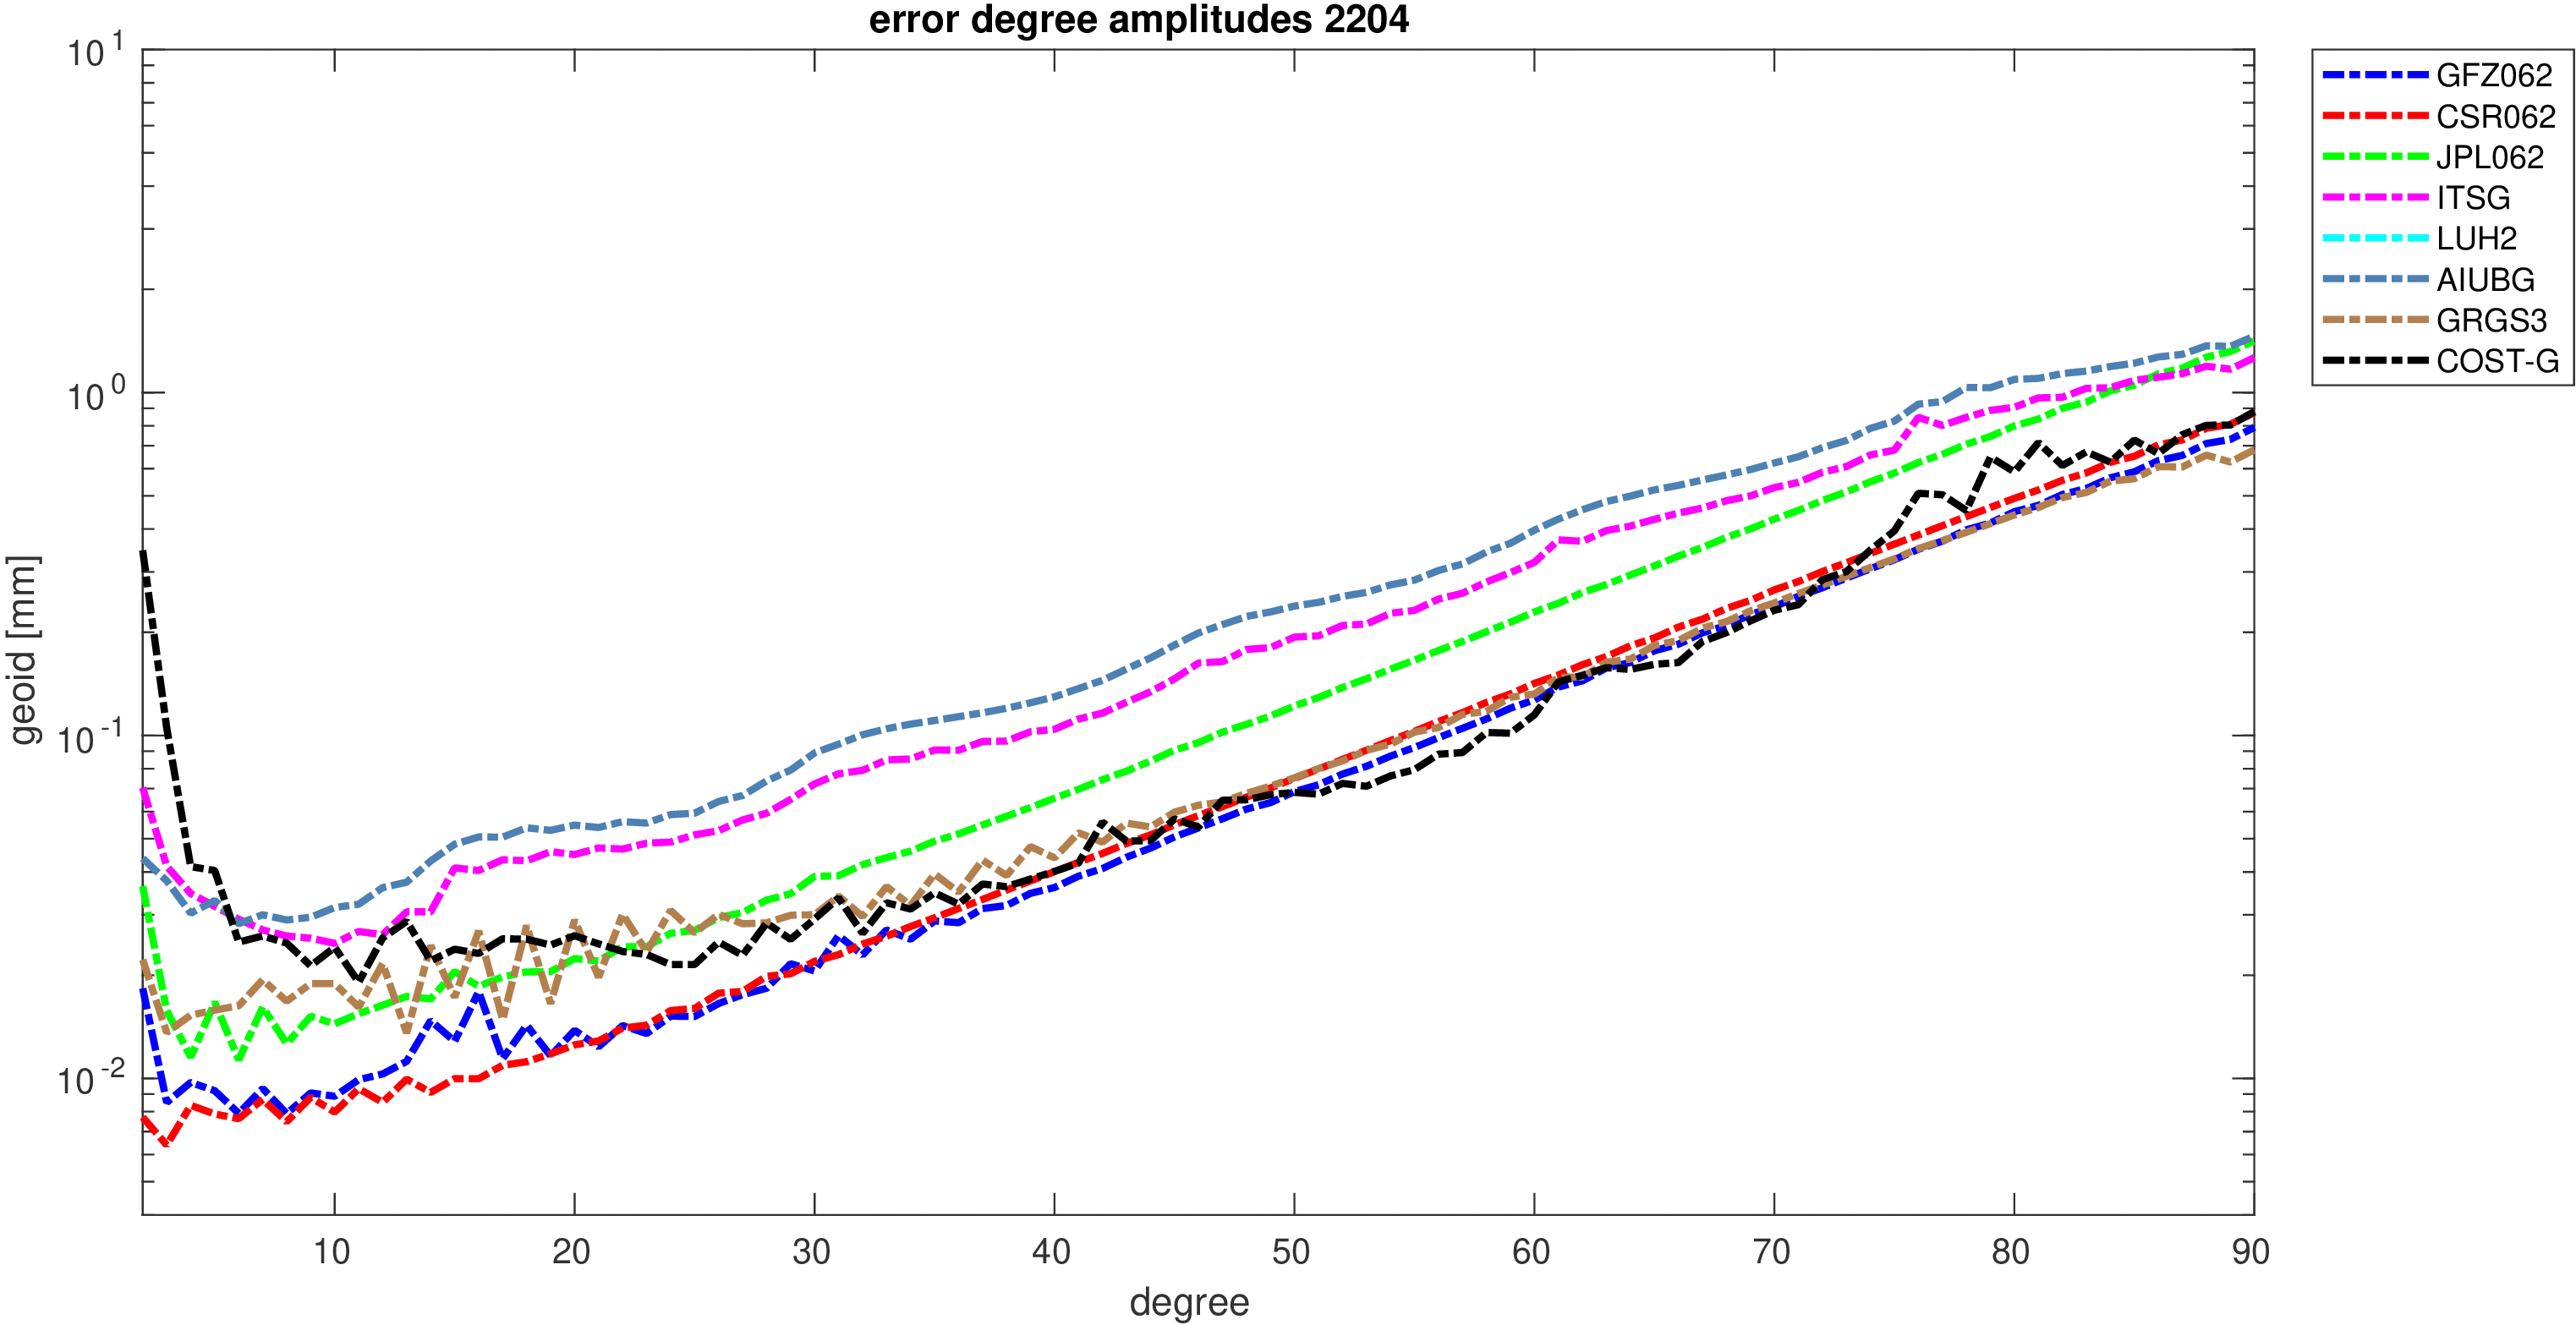
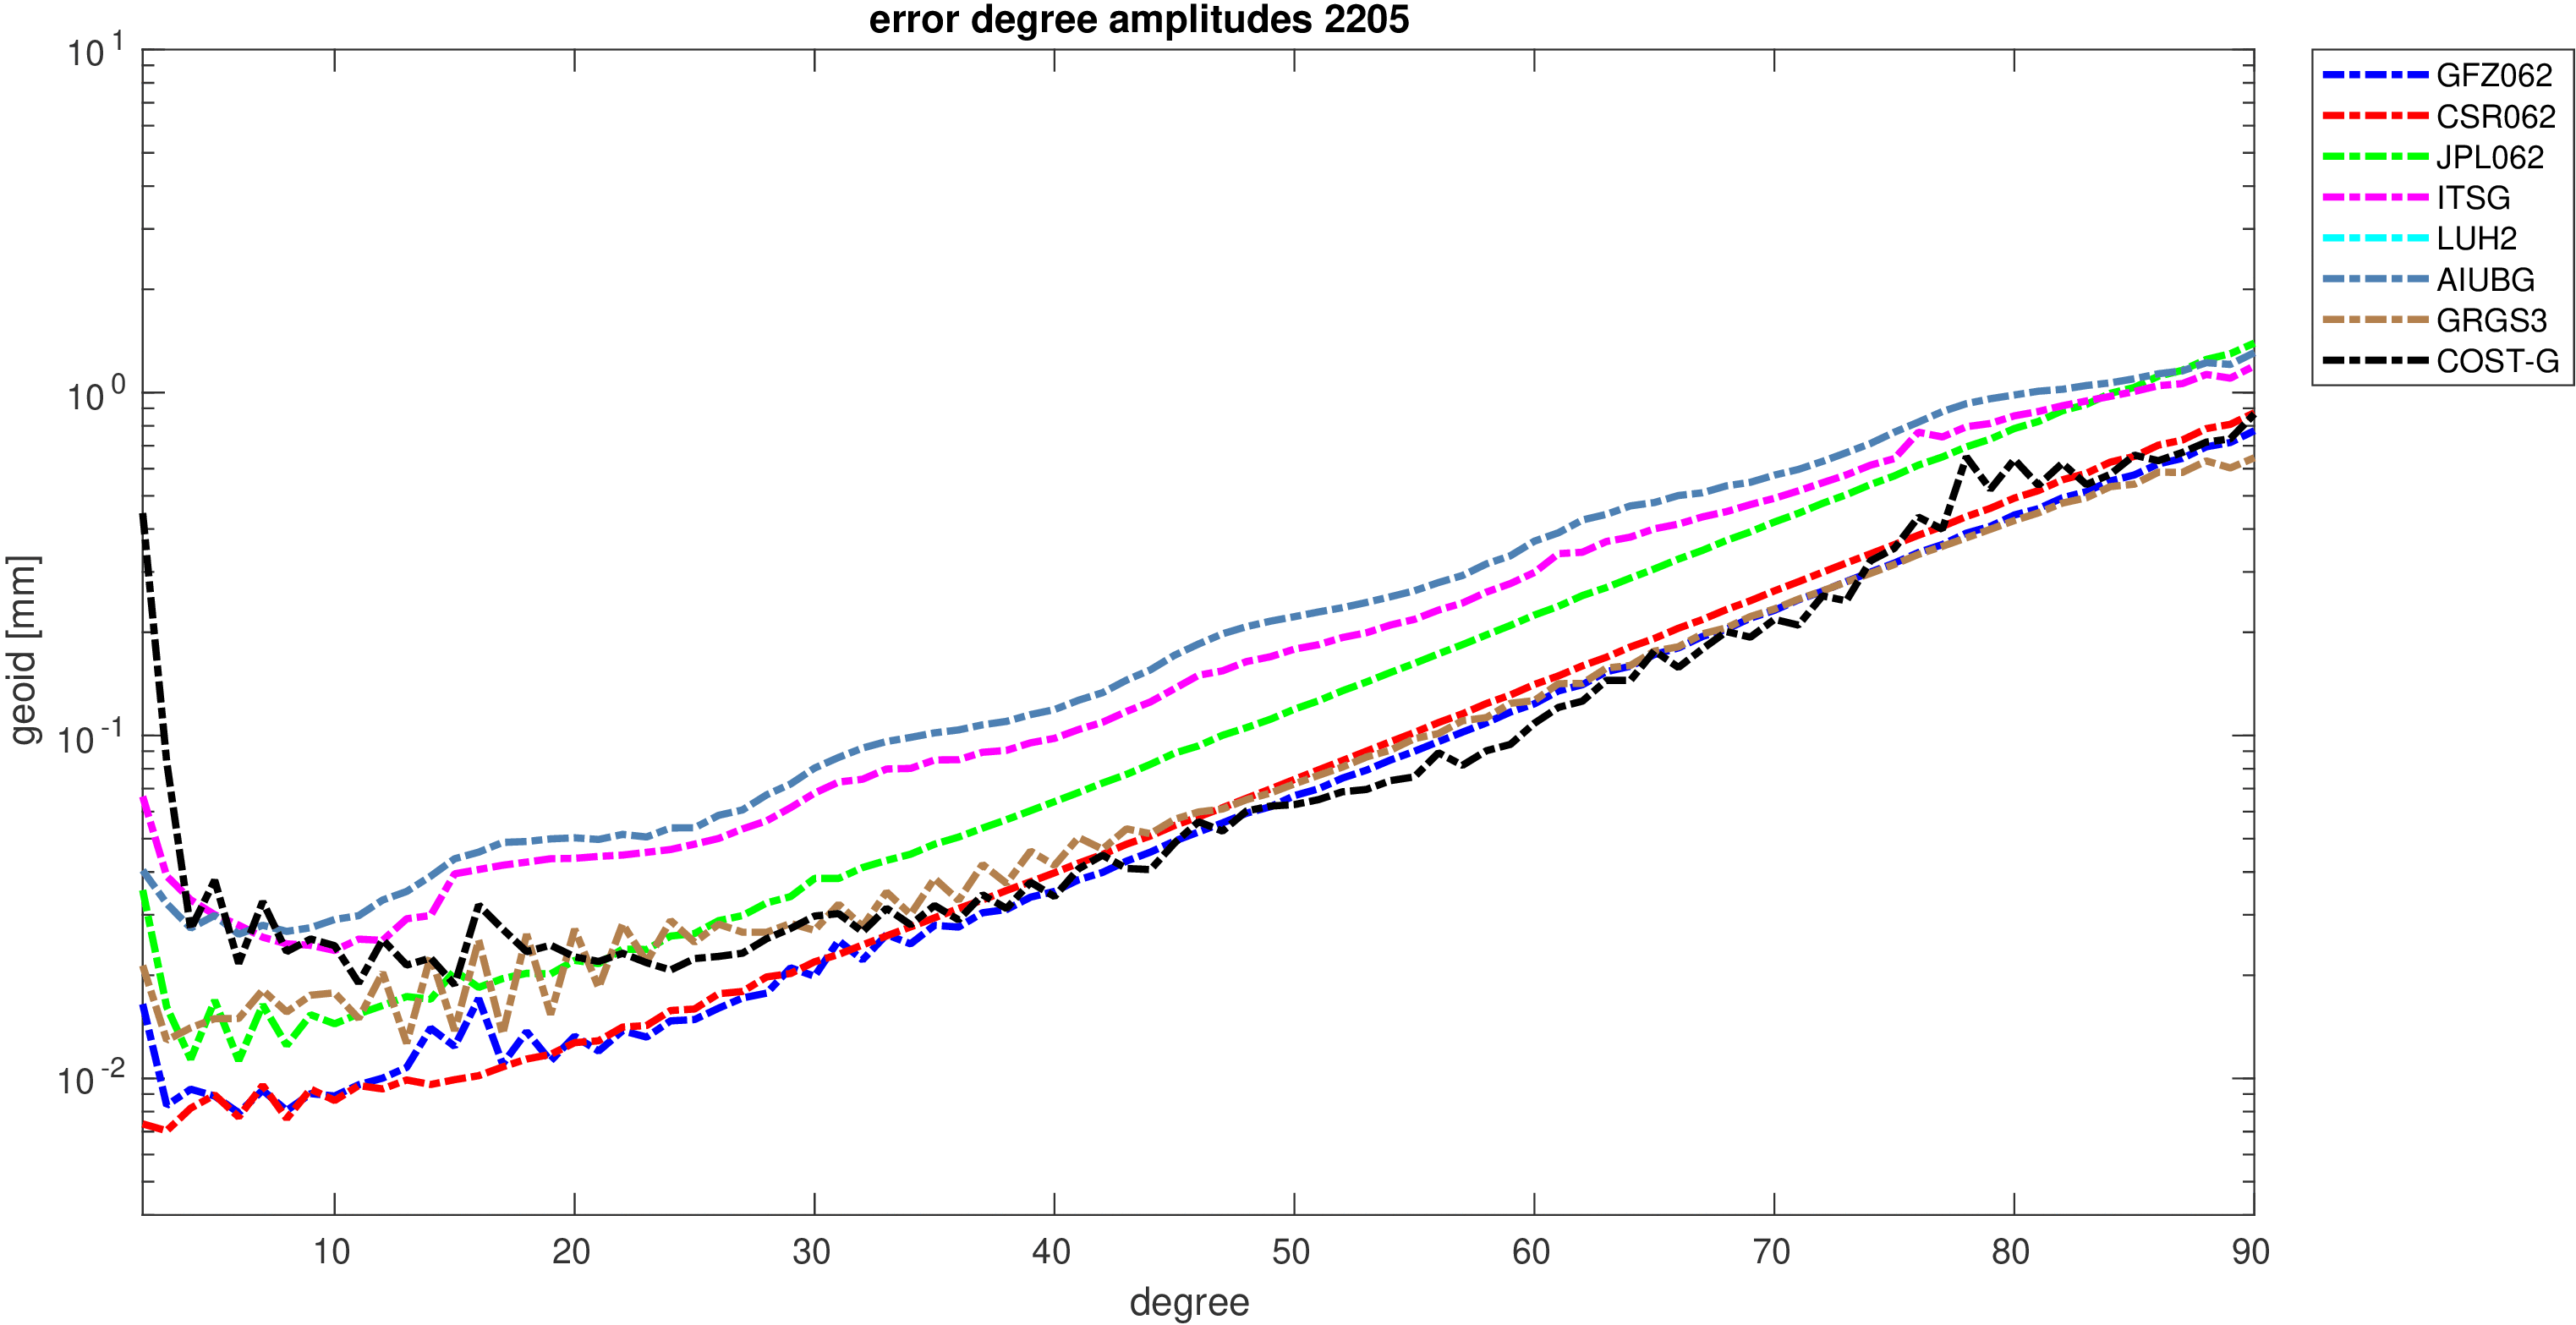
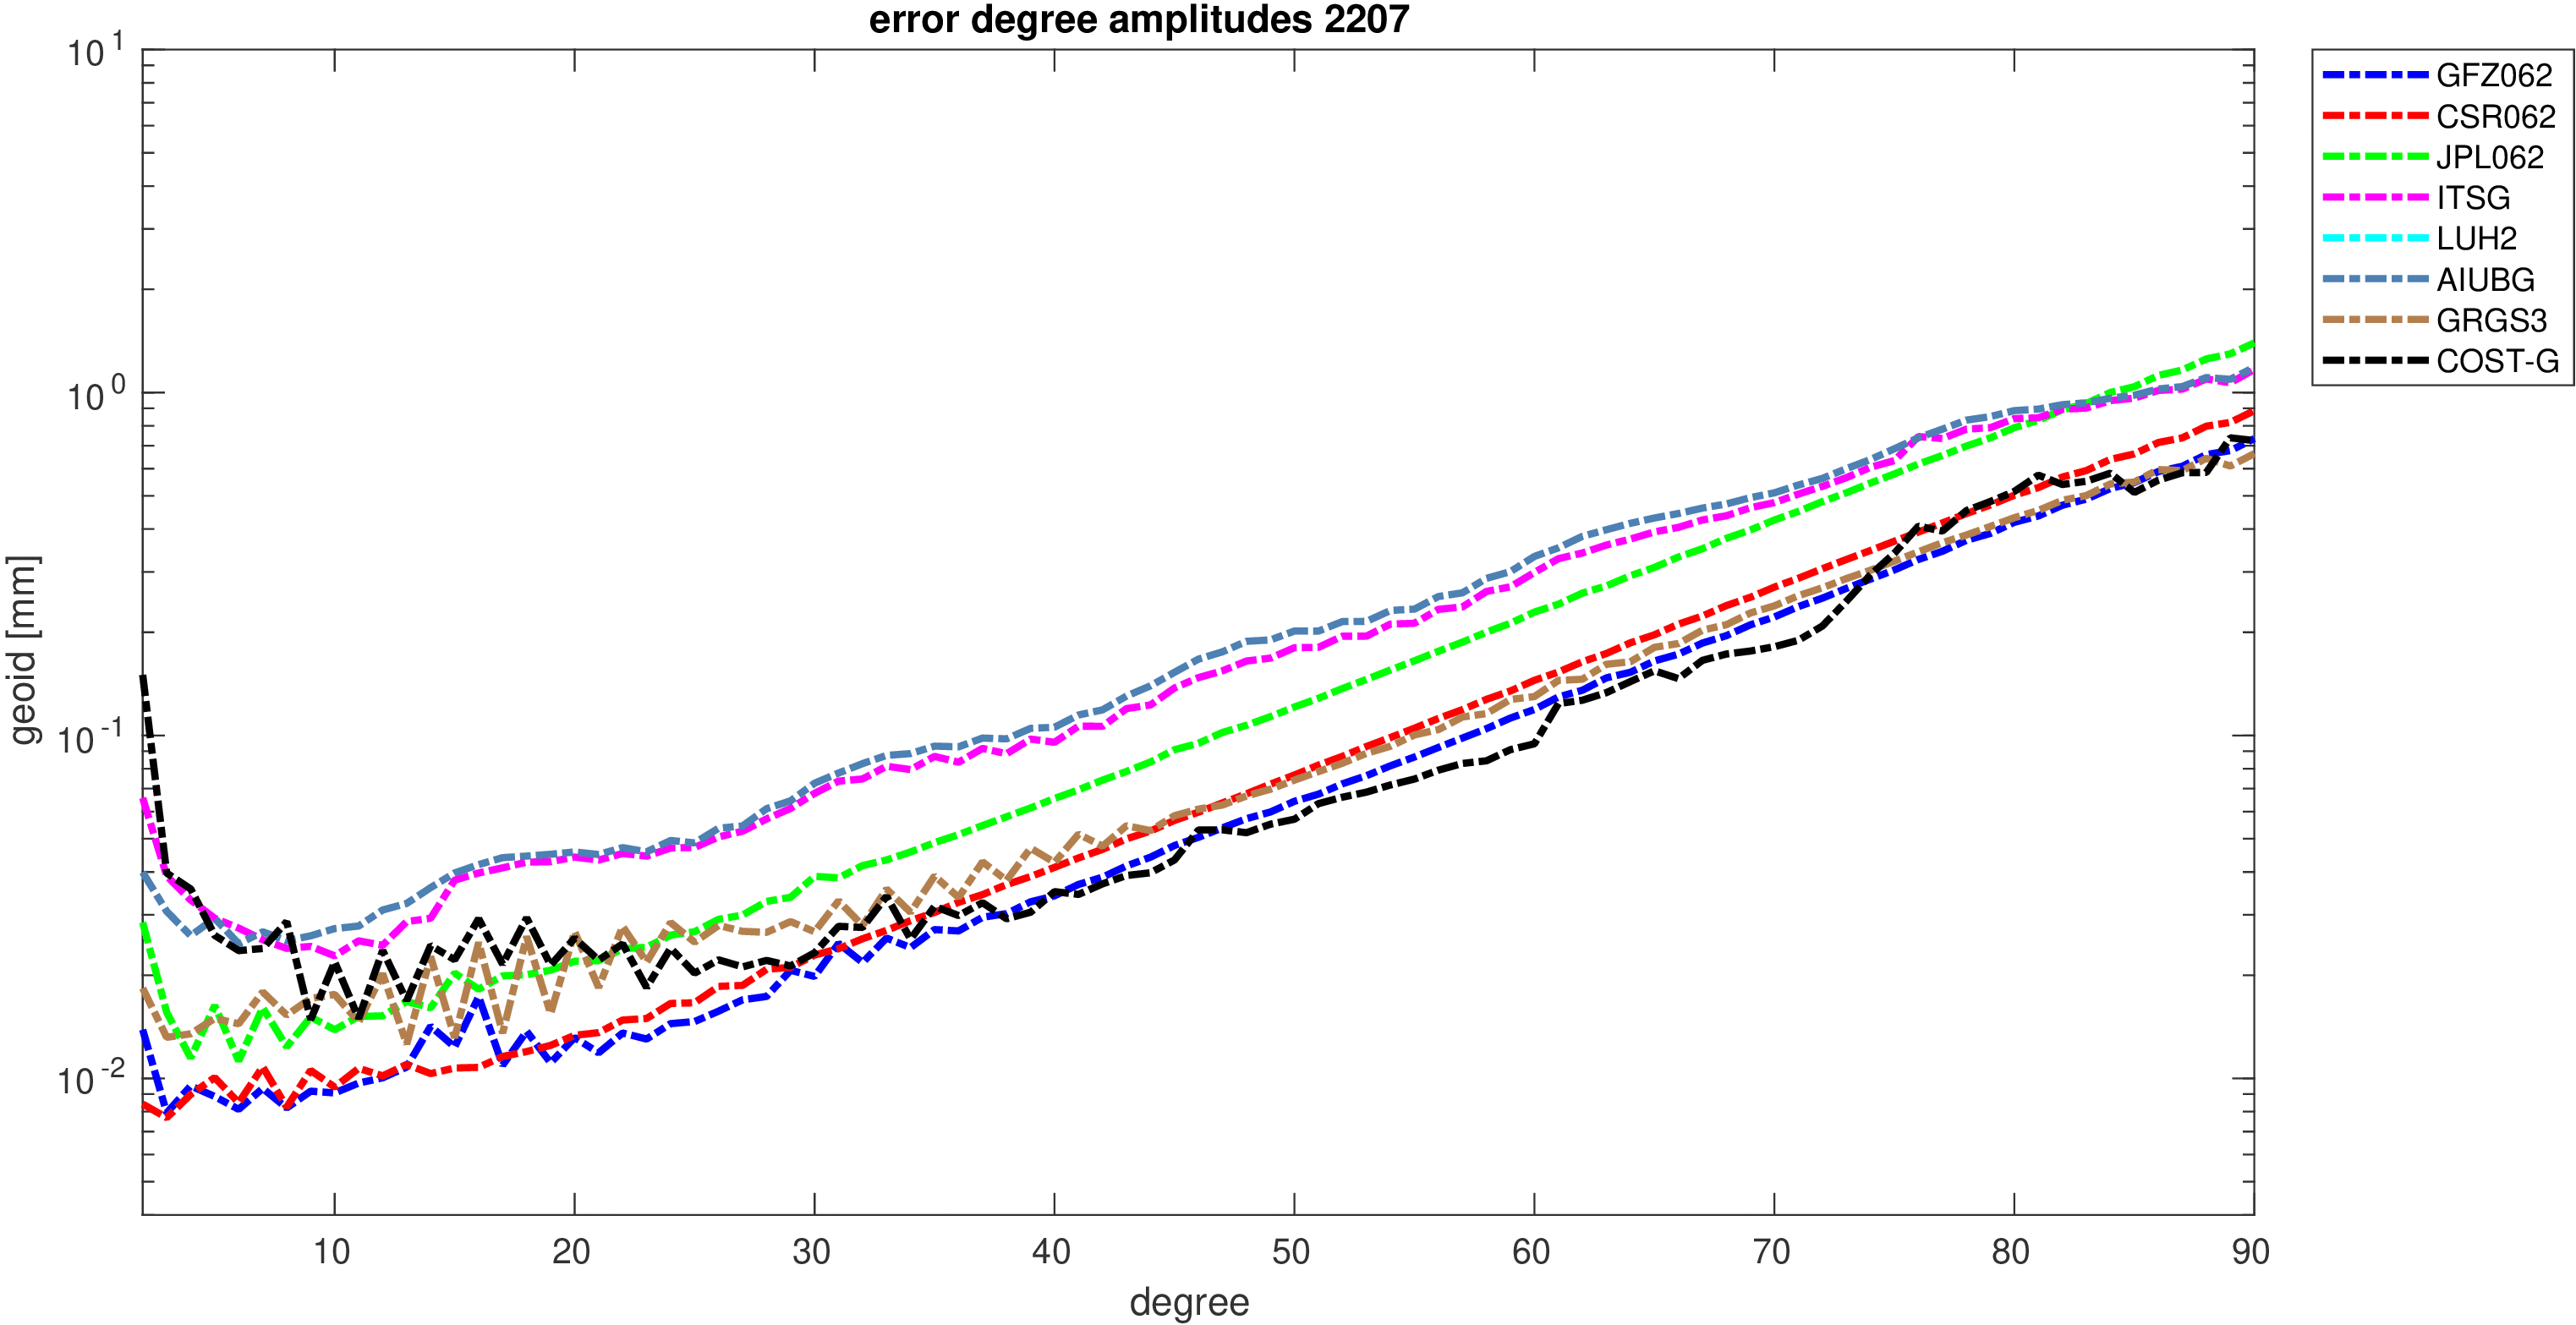
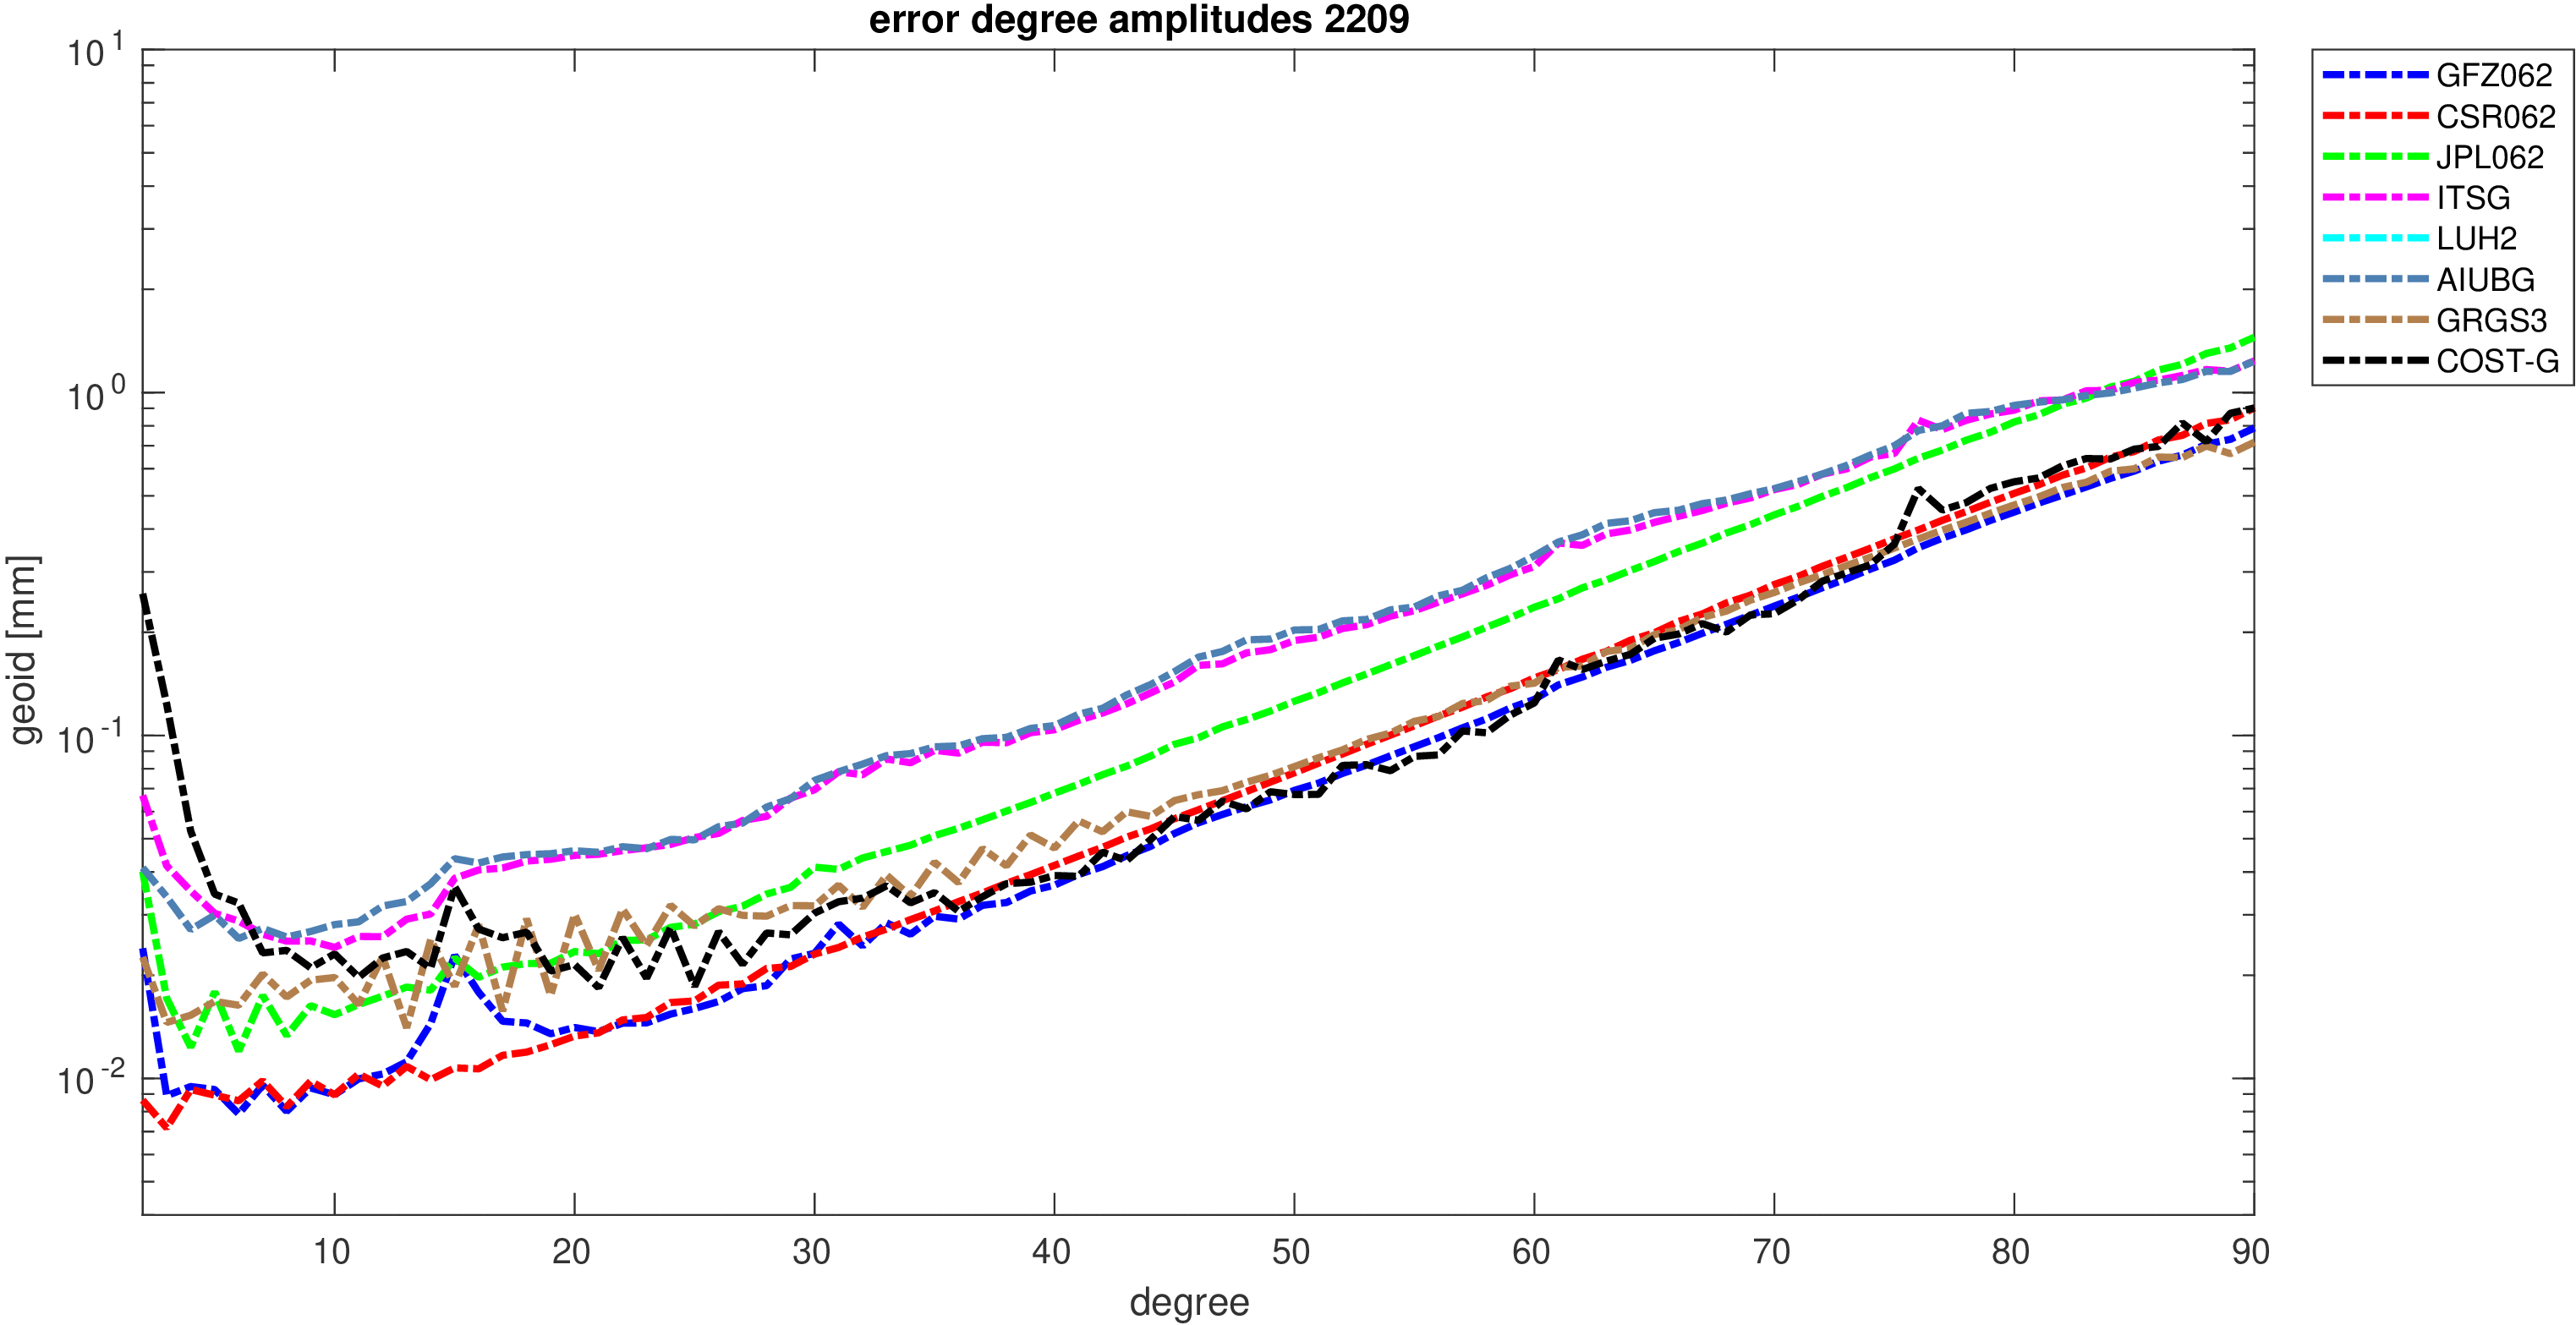
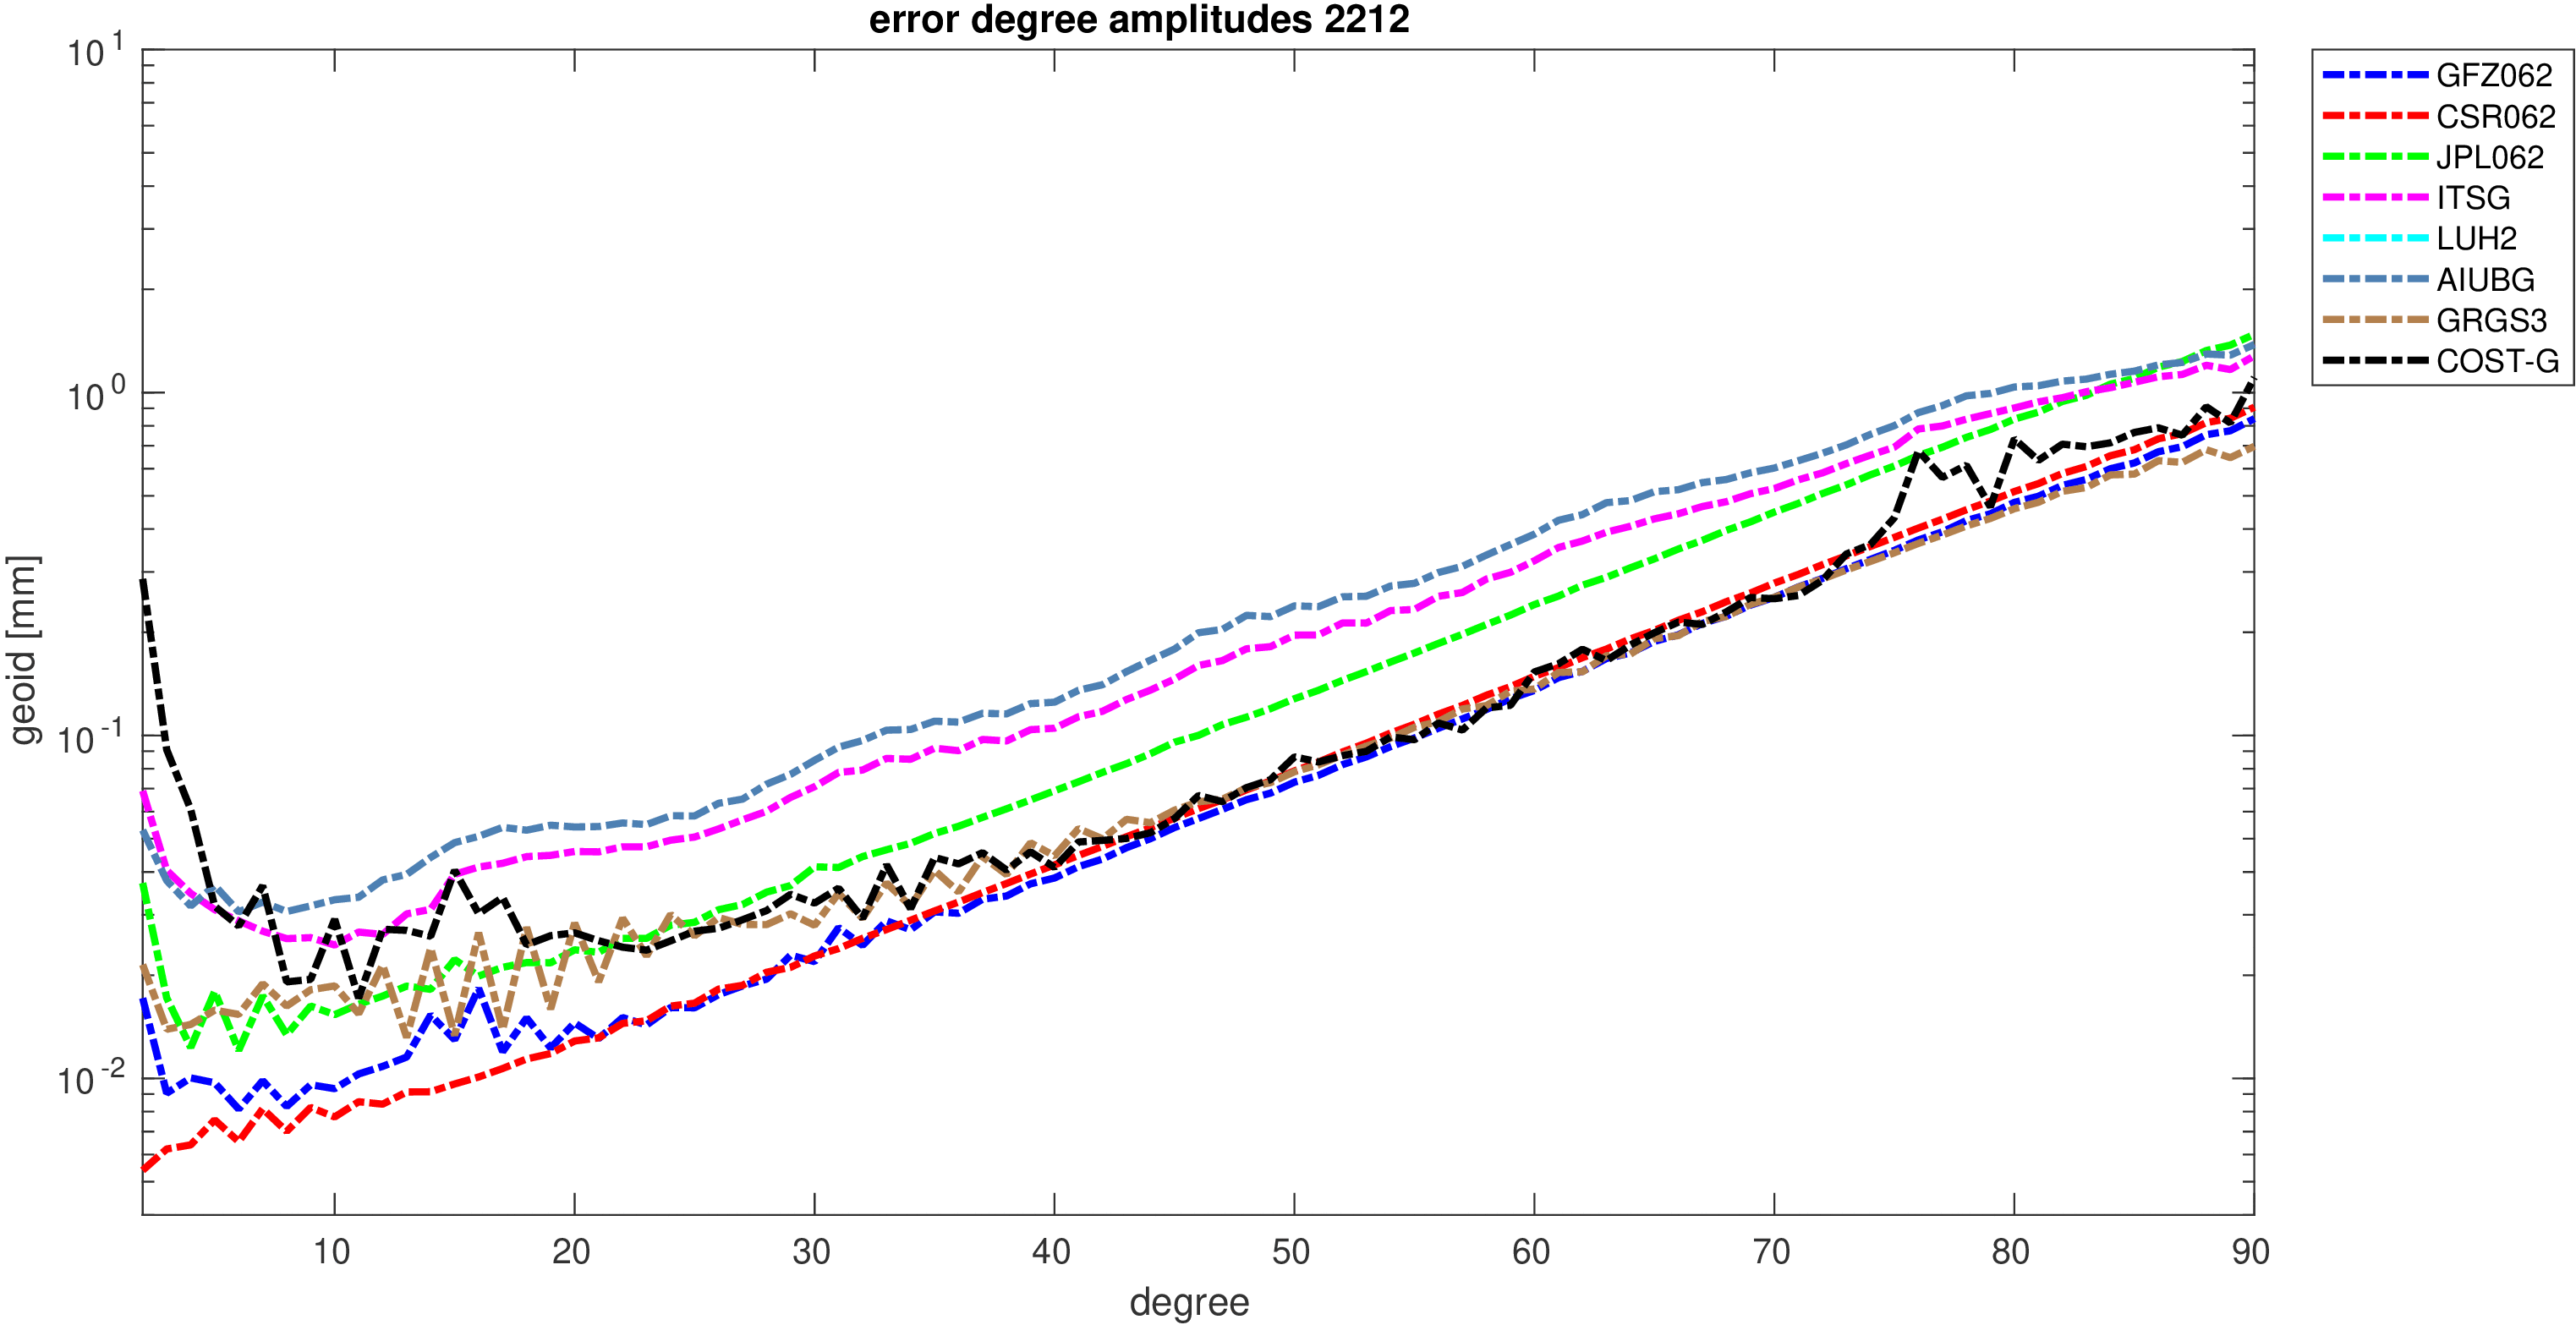
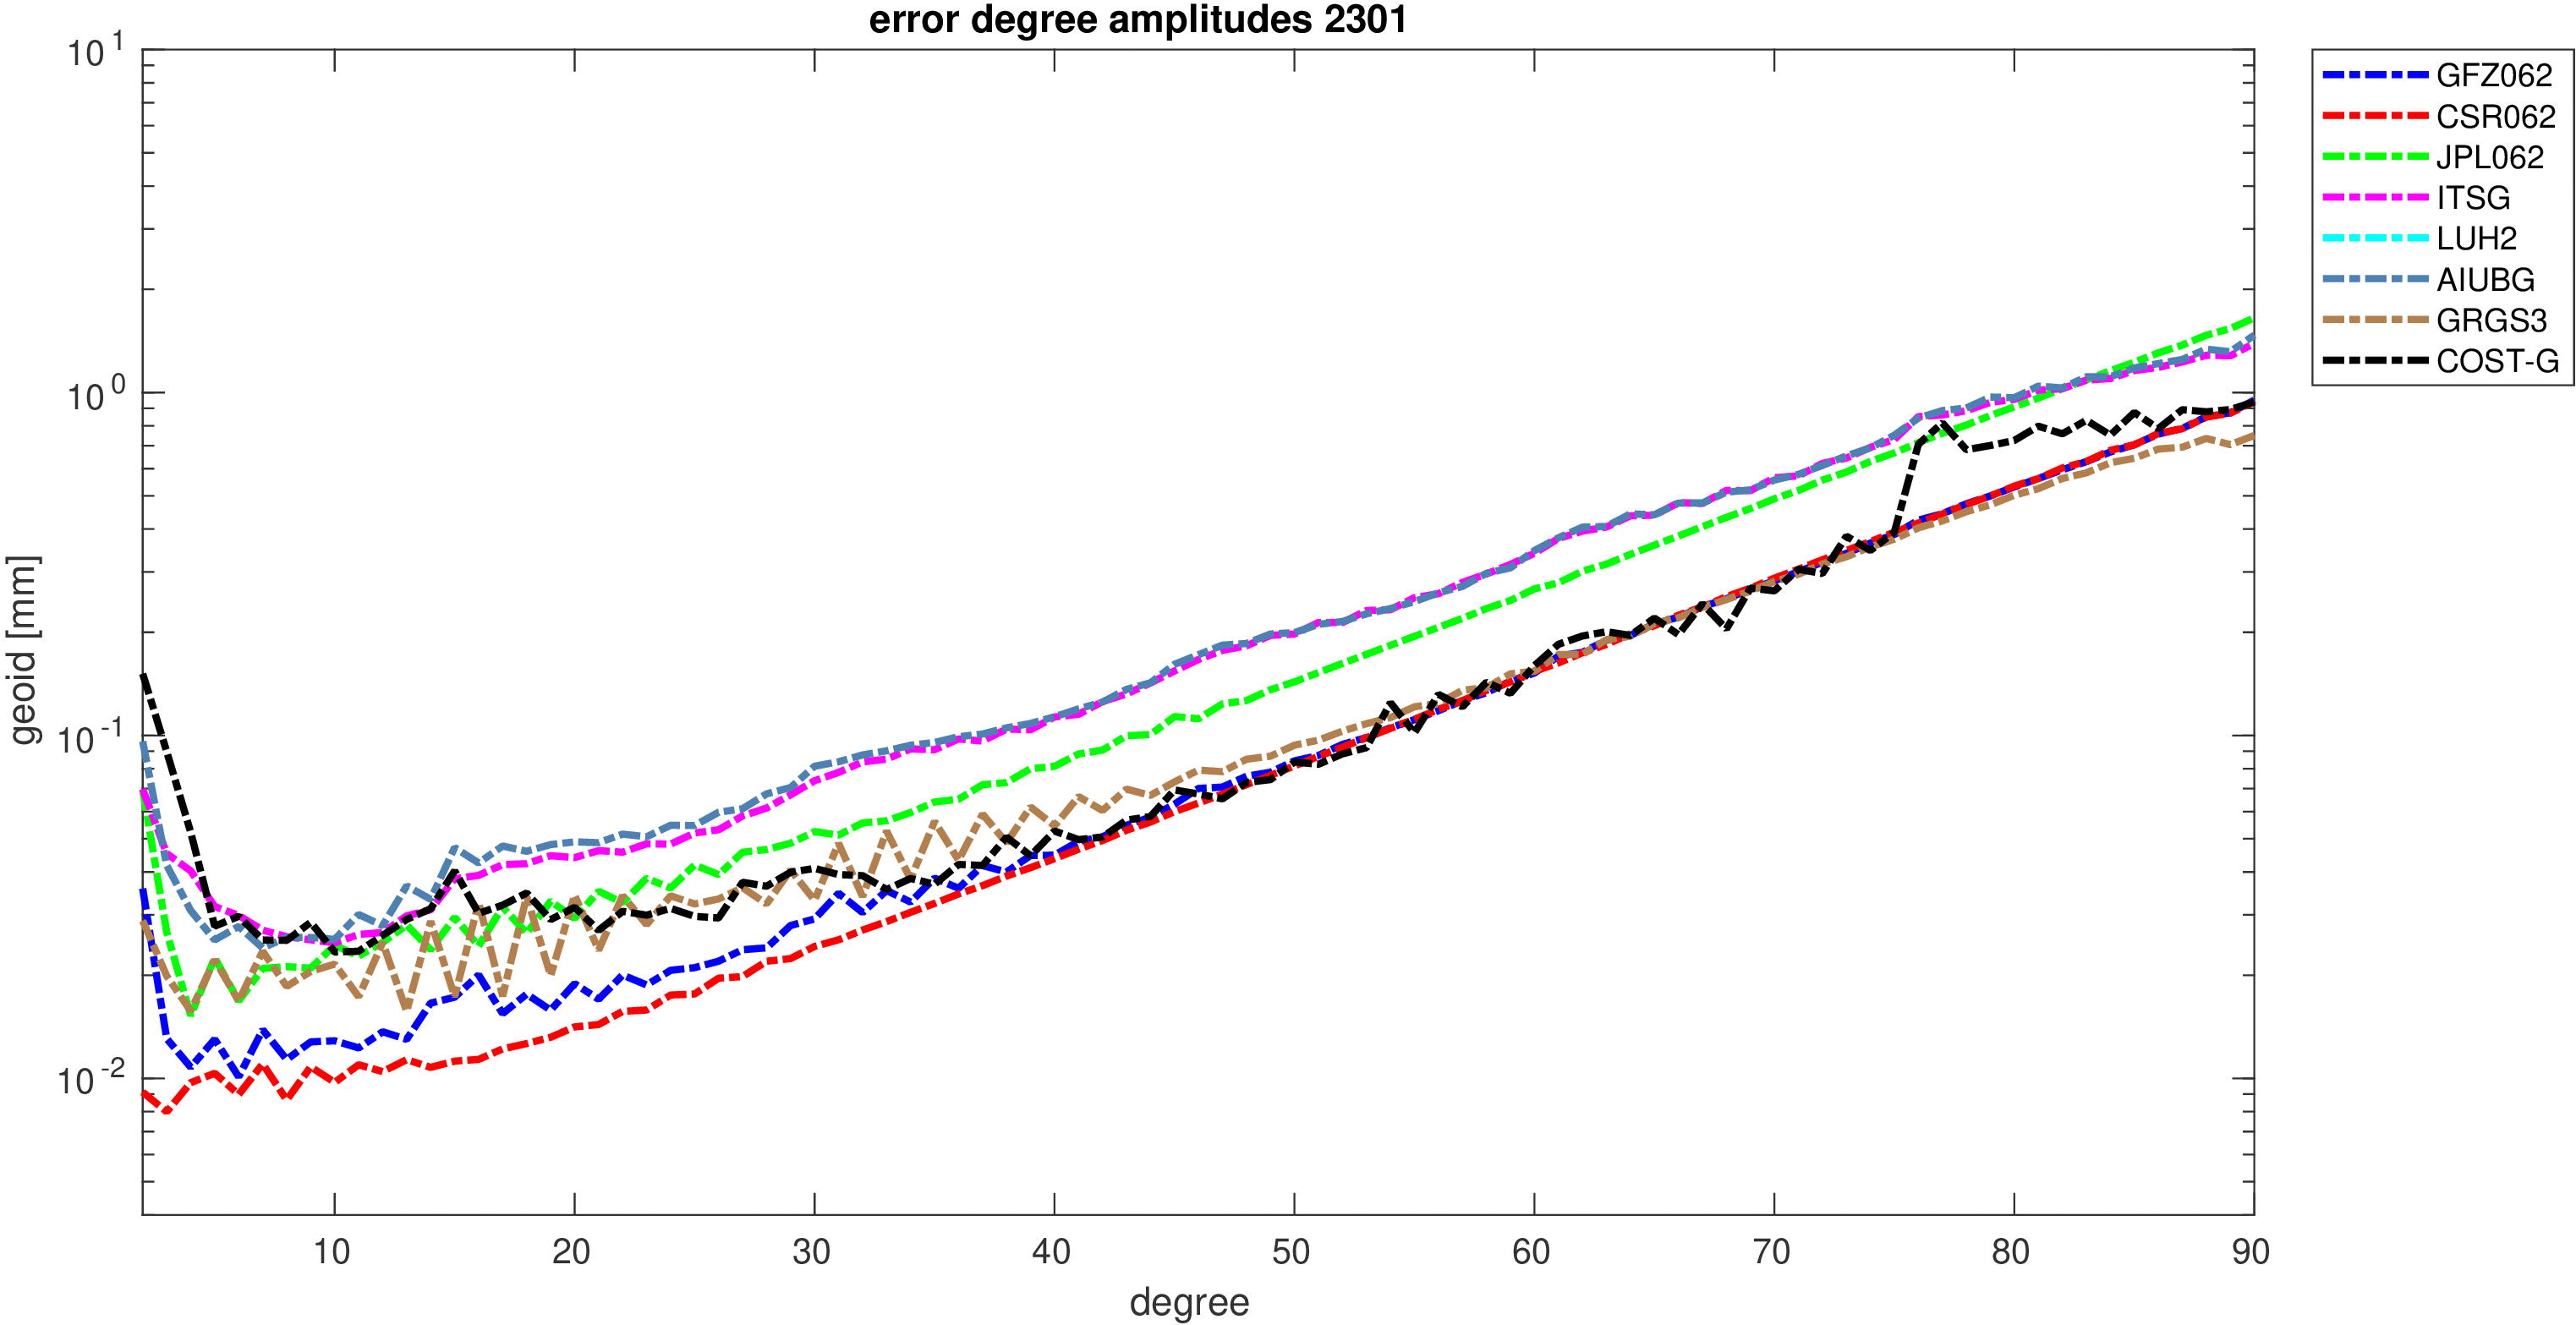
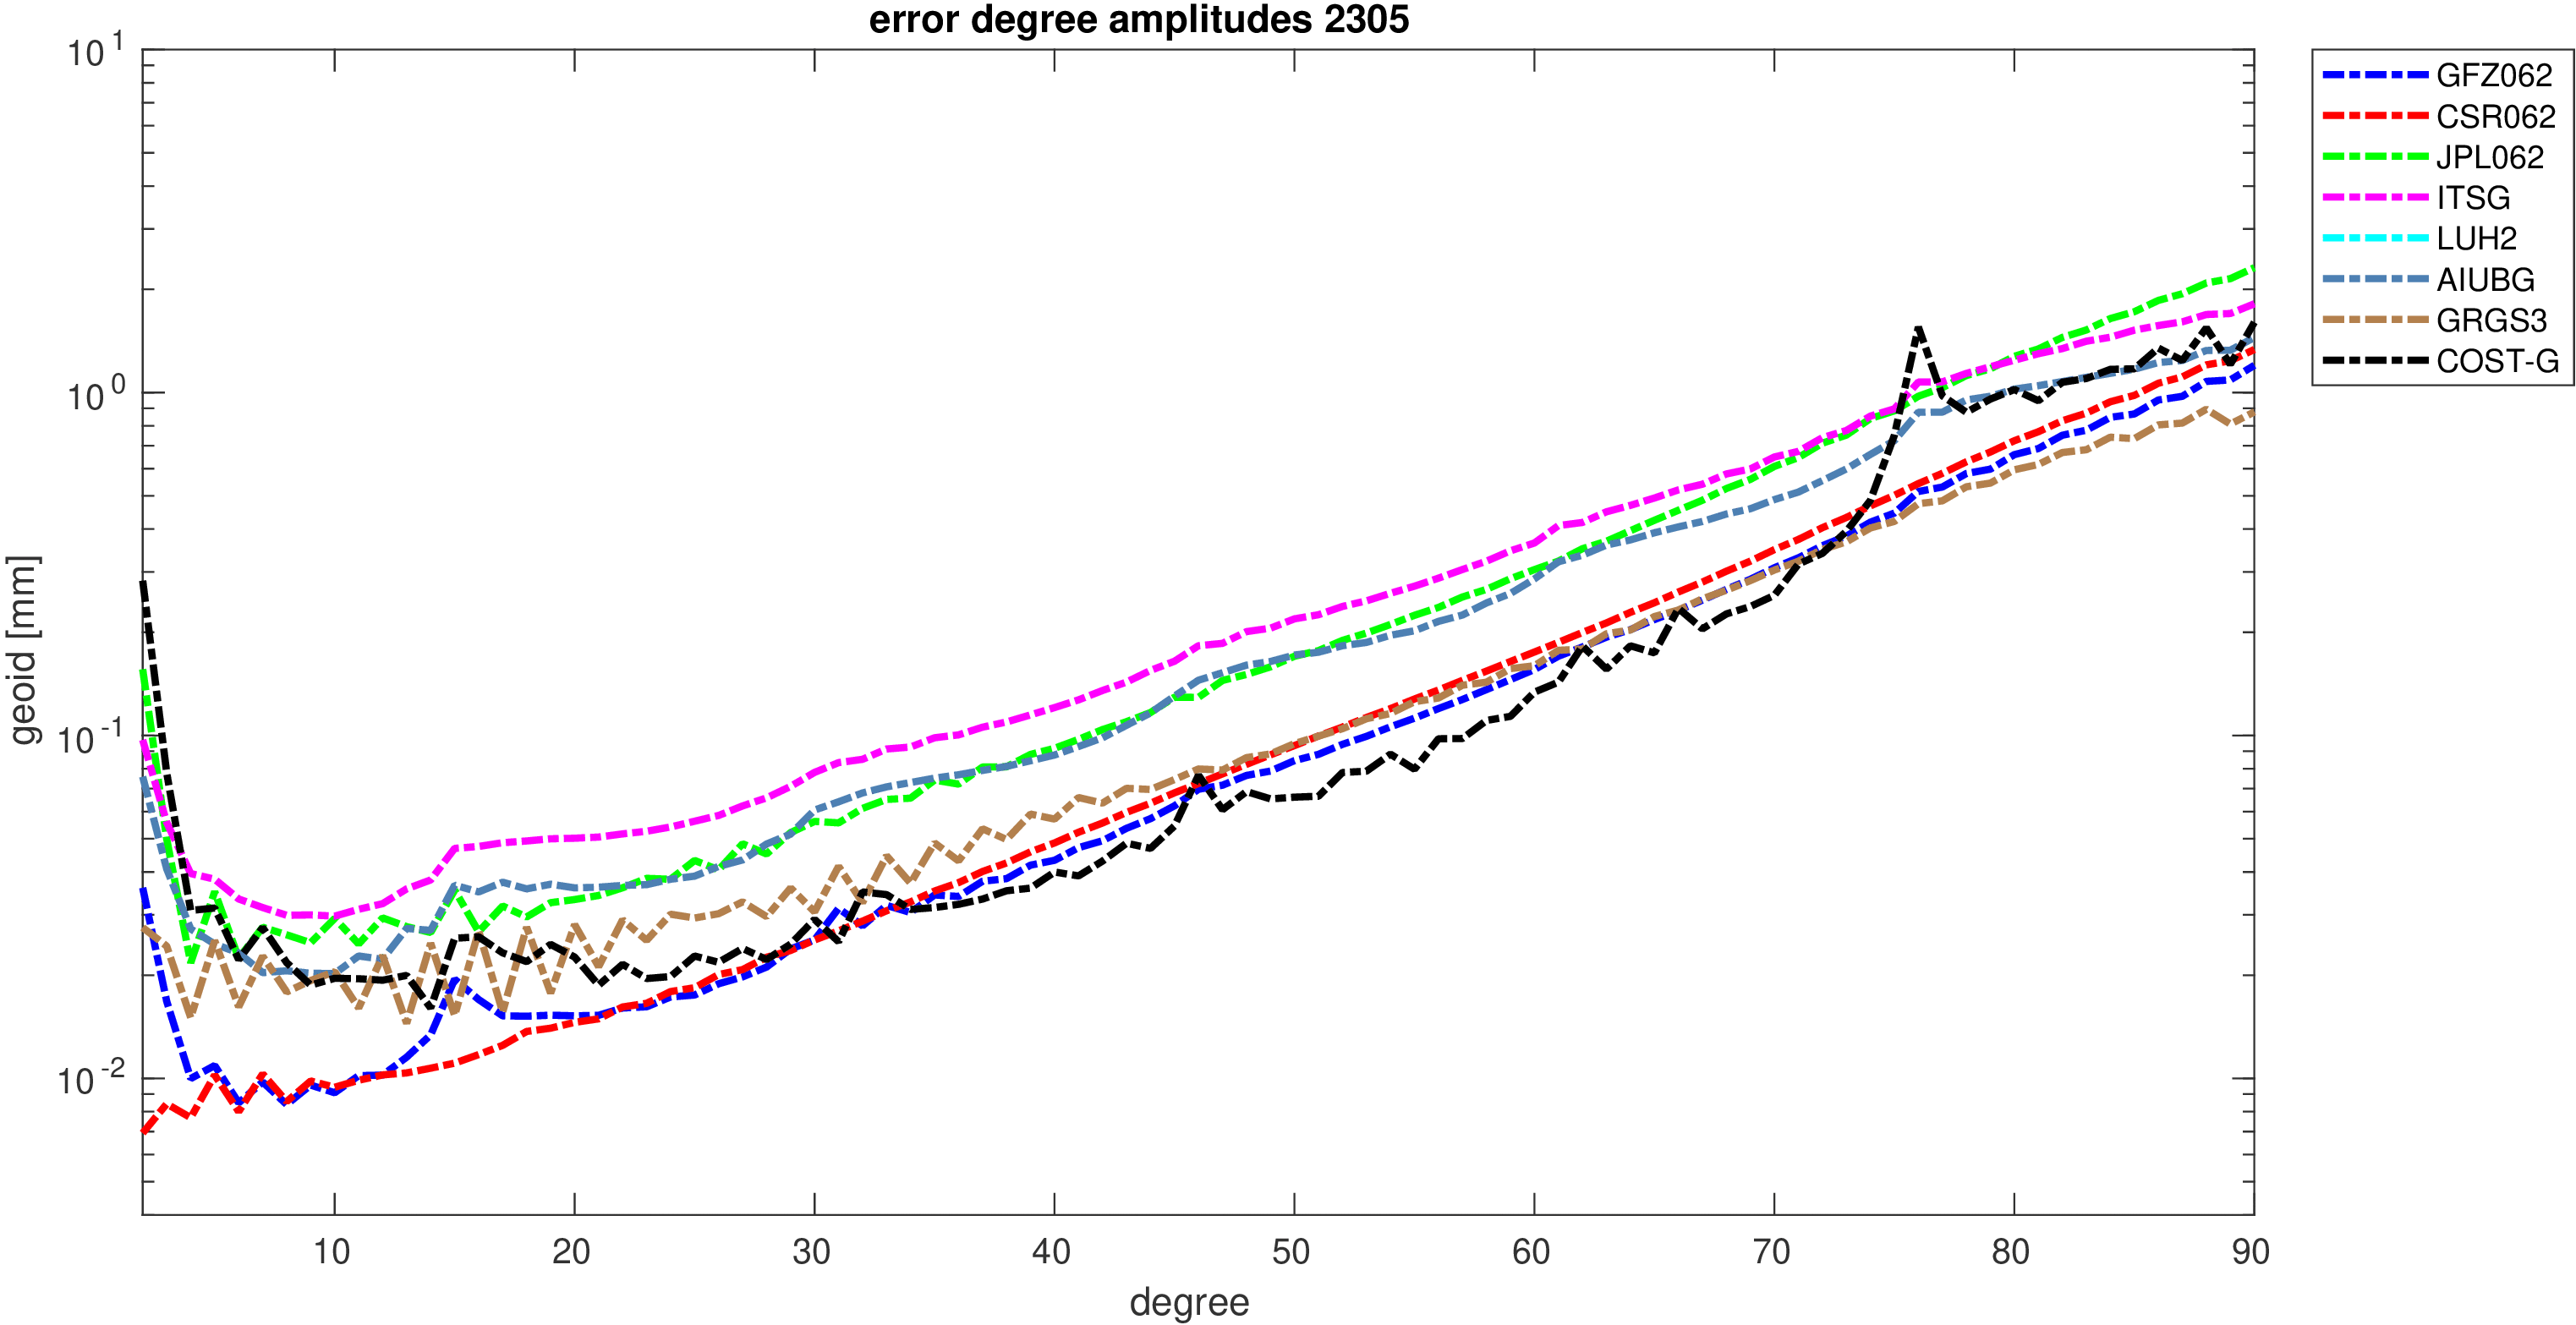
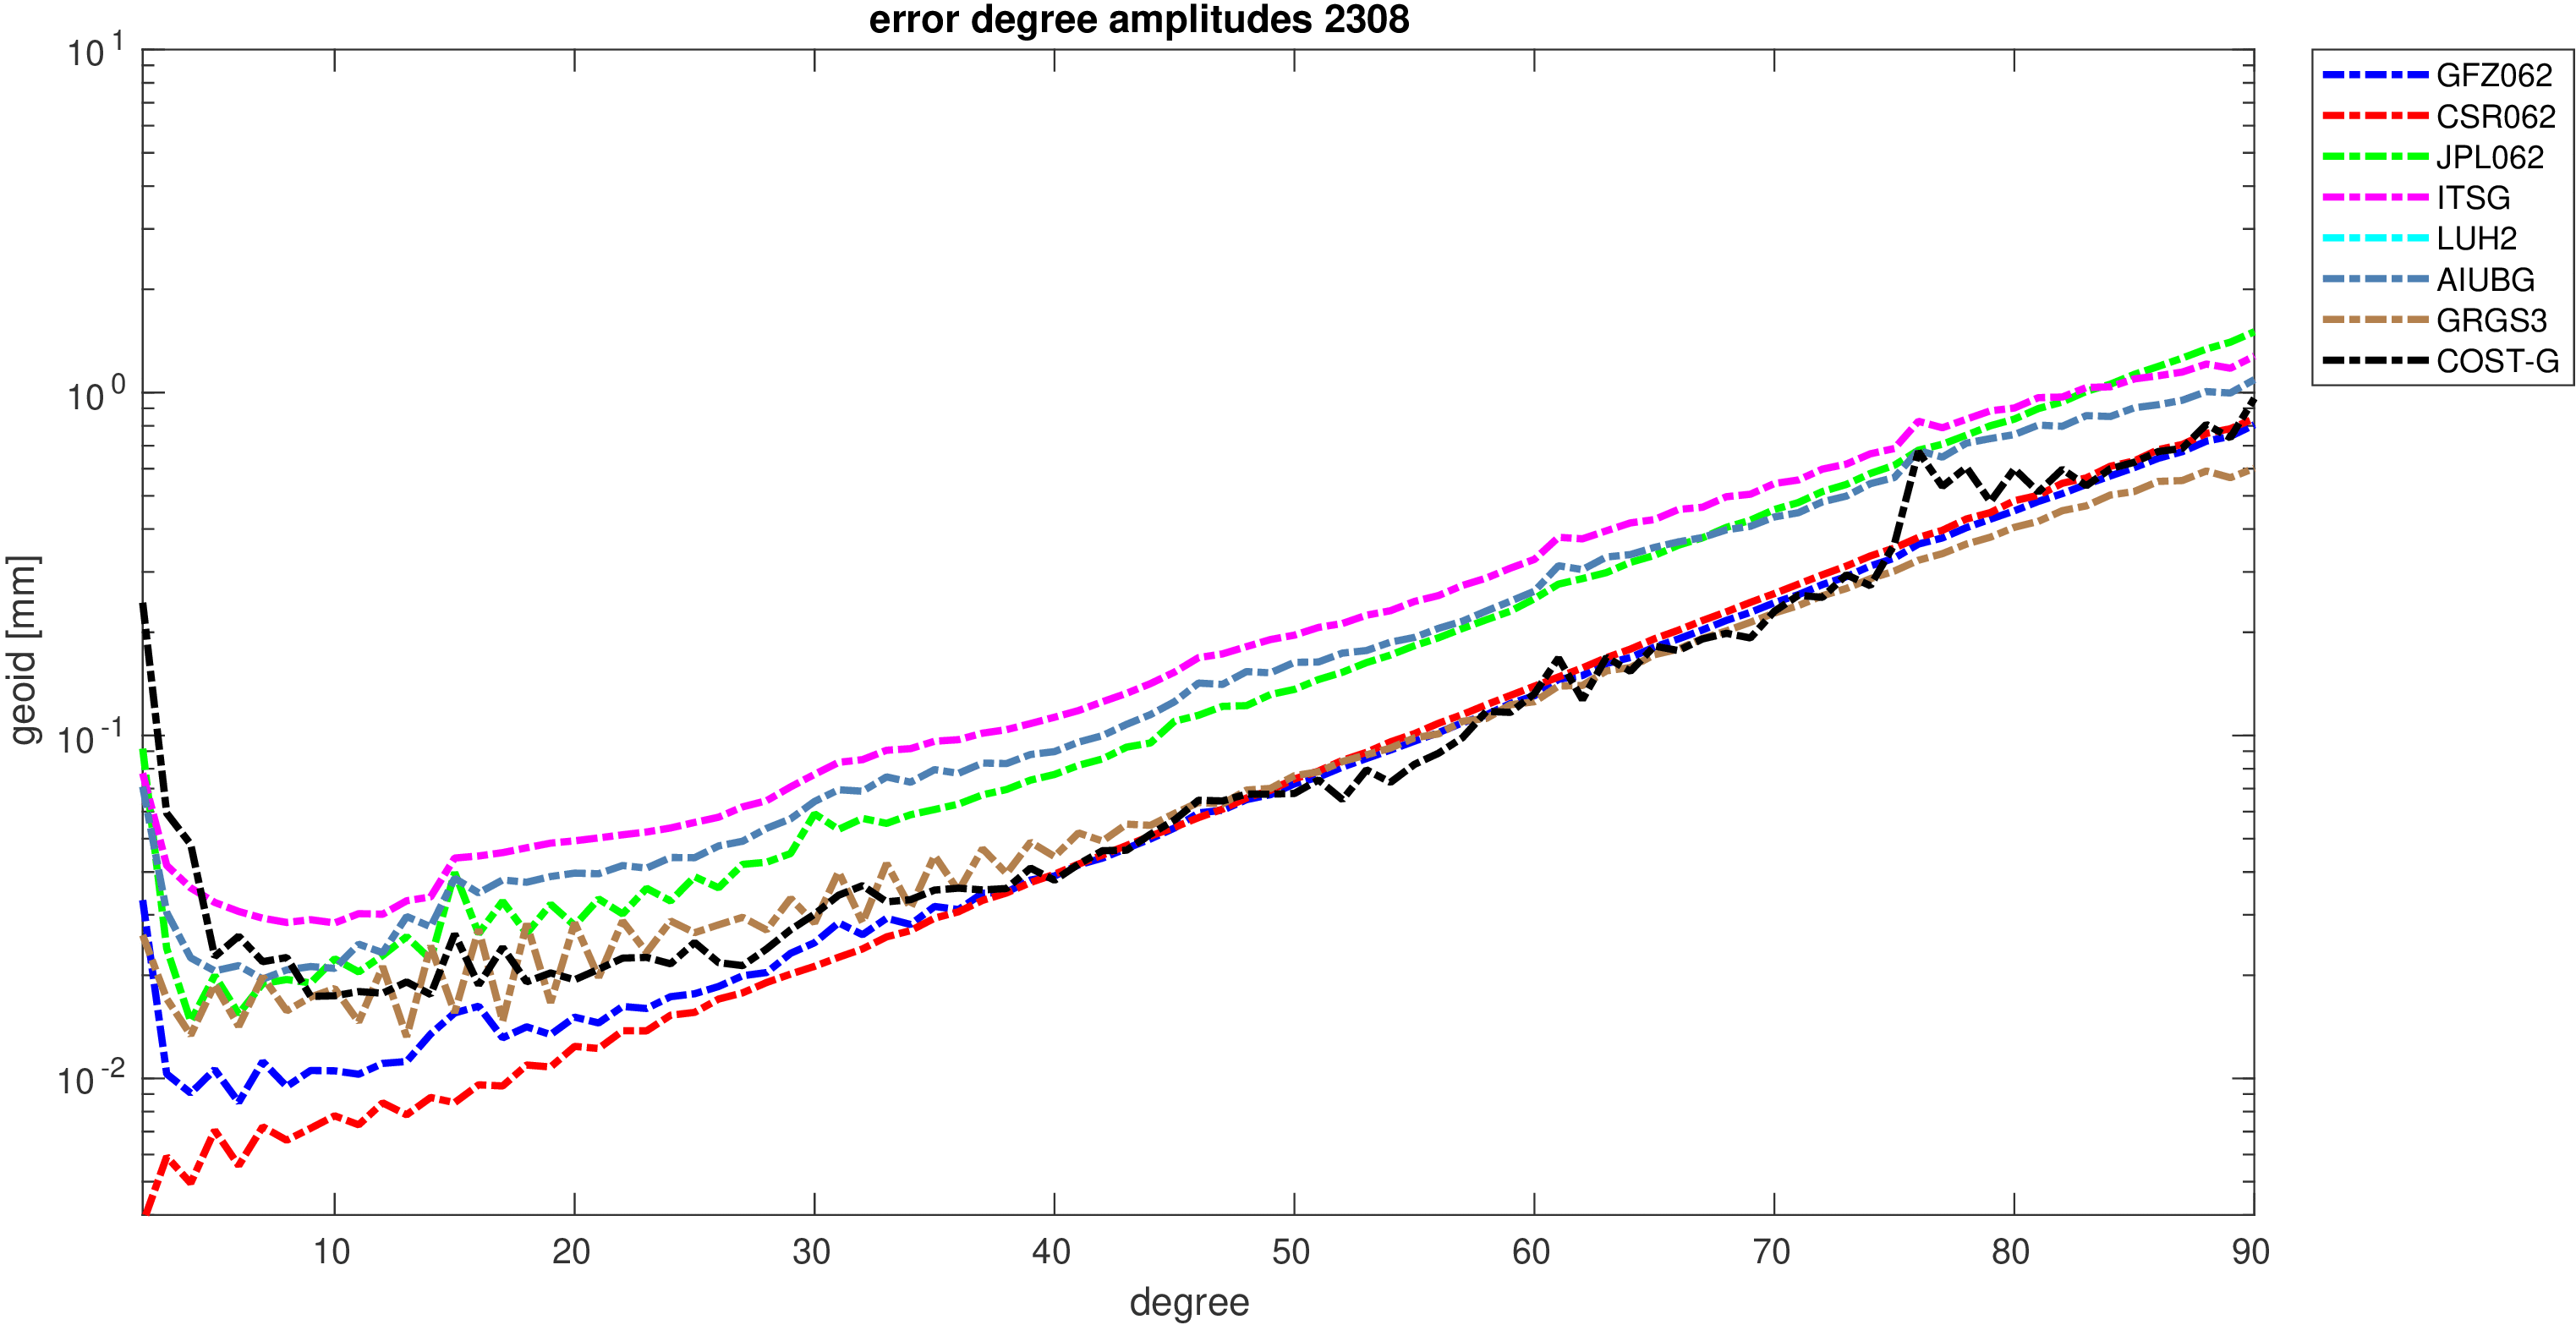
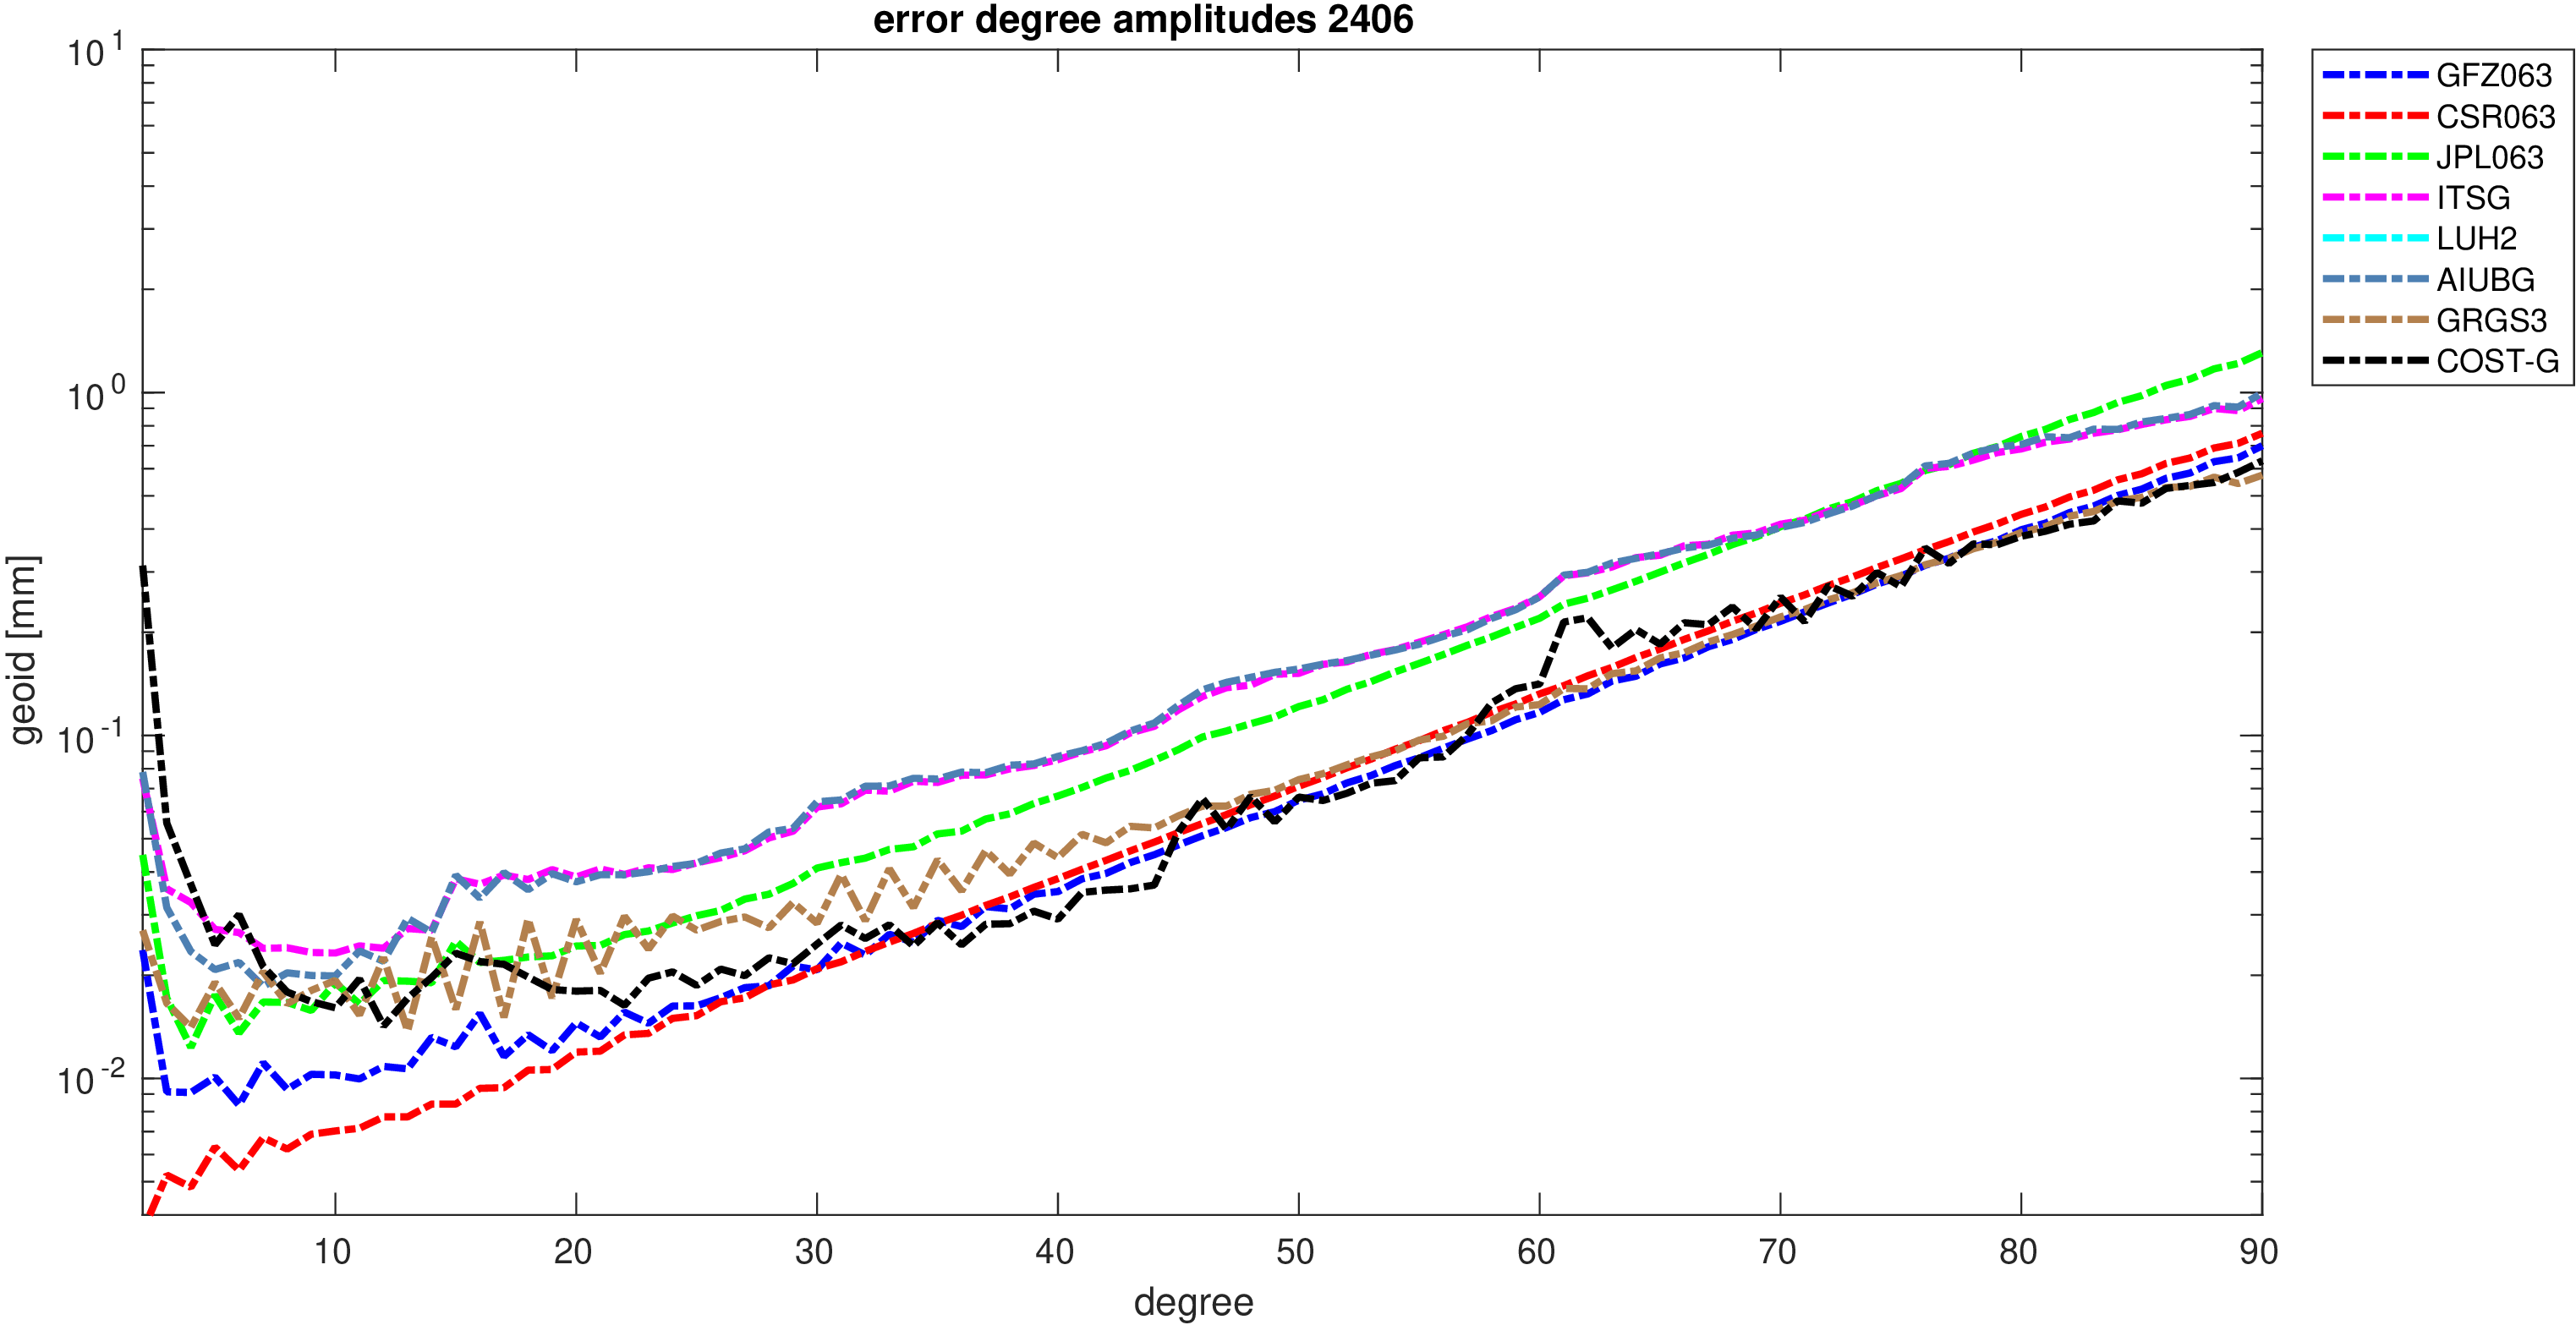
The accuracy assessment (errors) of the combined solutions is derived empirically from the differences to the individual
contributions.
| month |
anomalies |
formal errors |
| 06/2018 |

|

|
| 07/2018 |

|
|
| 10/2018 |

|

|
| 11/2018 |
|
|
| 12/2018 |

|

|
| 01/2019 |
|

|
| 02/2019 |
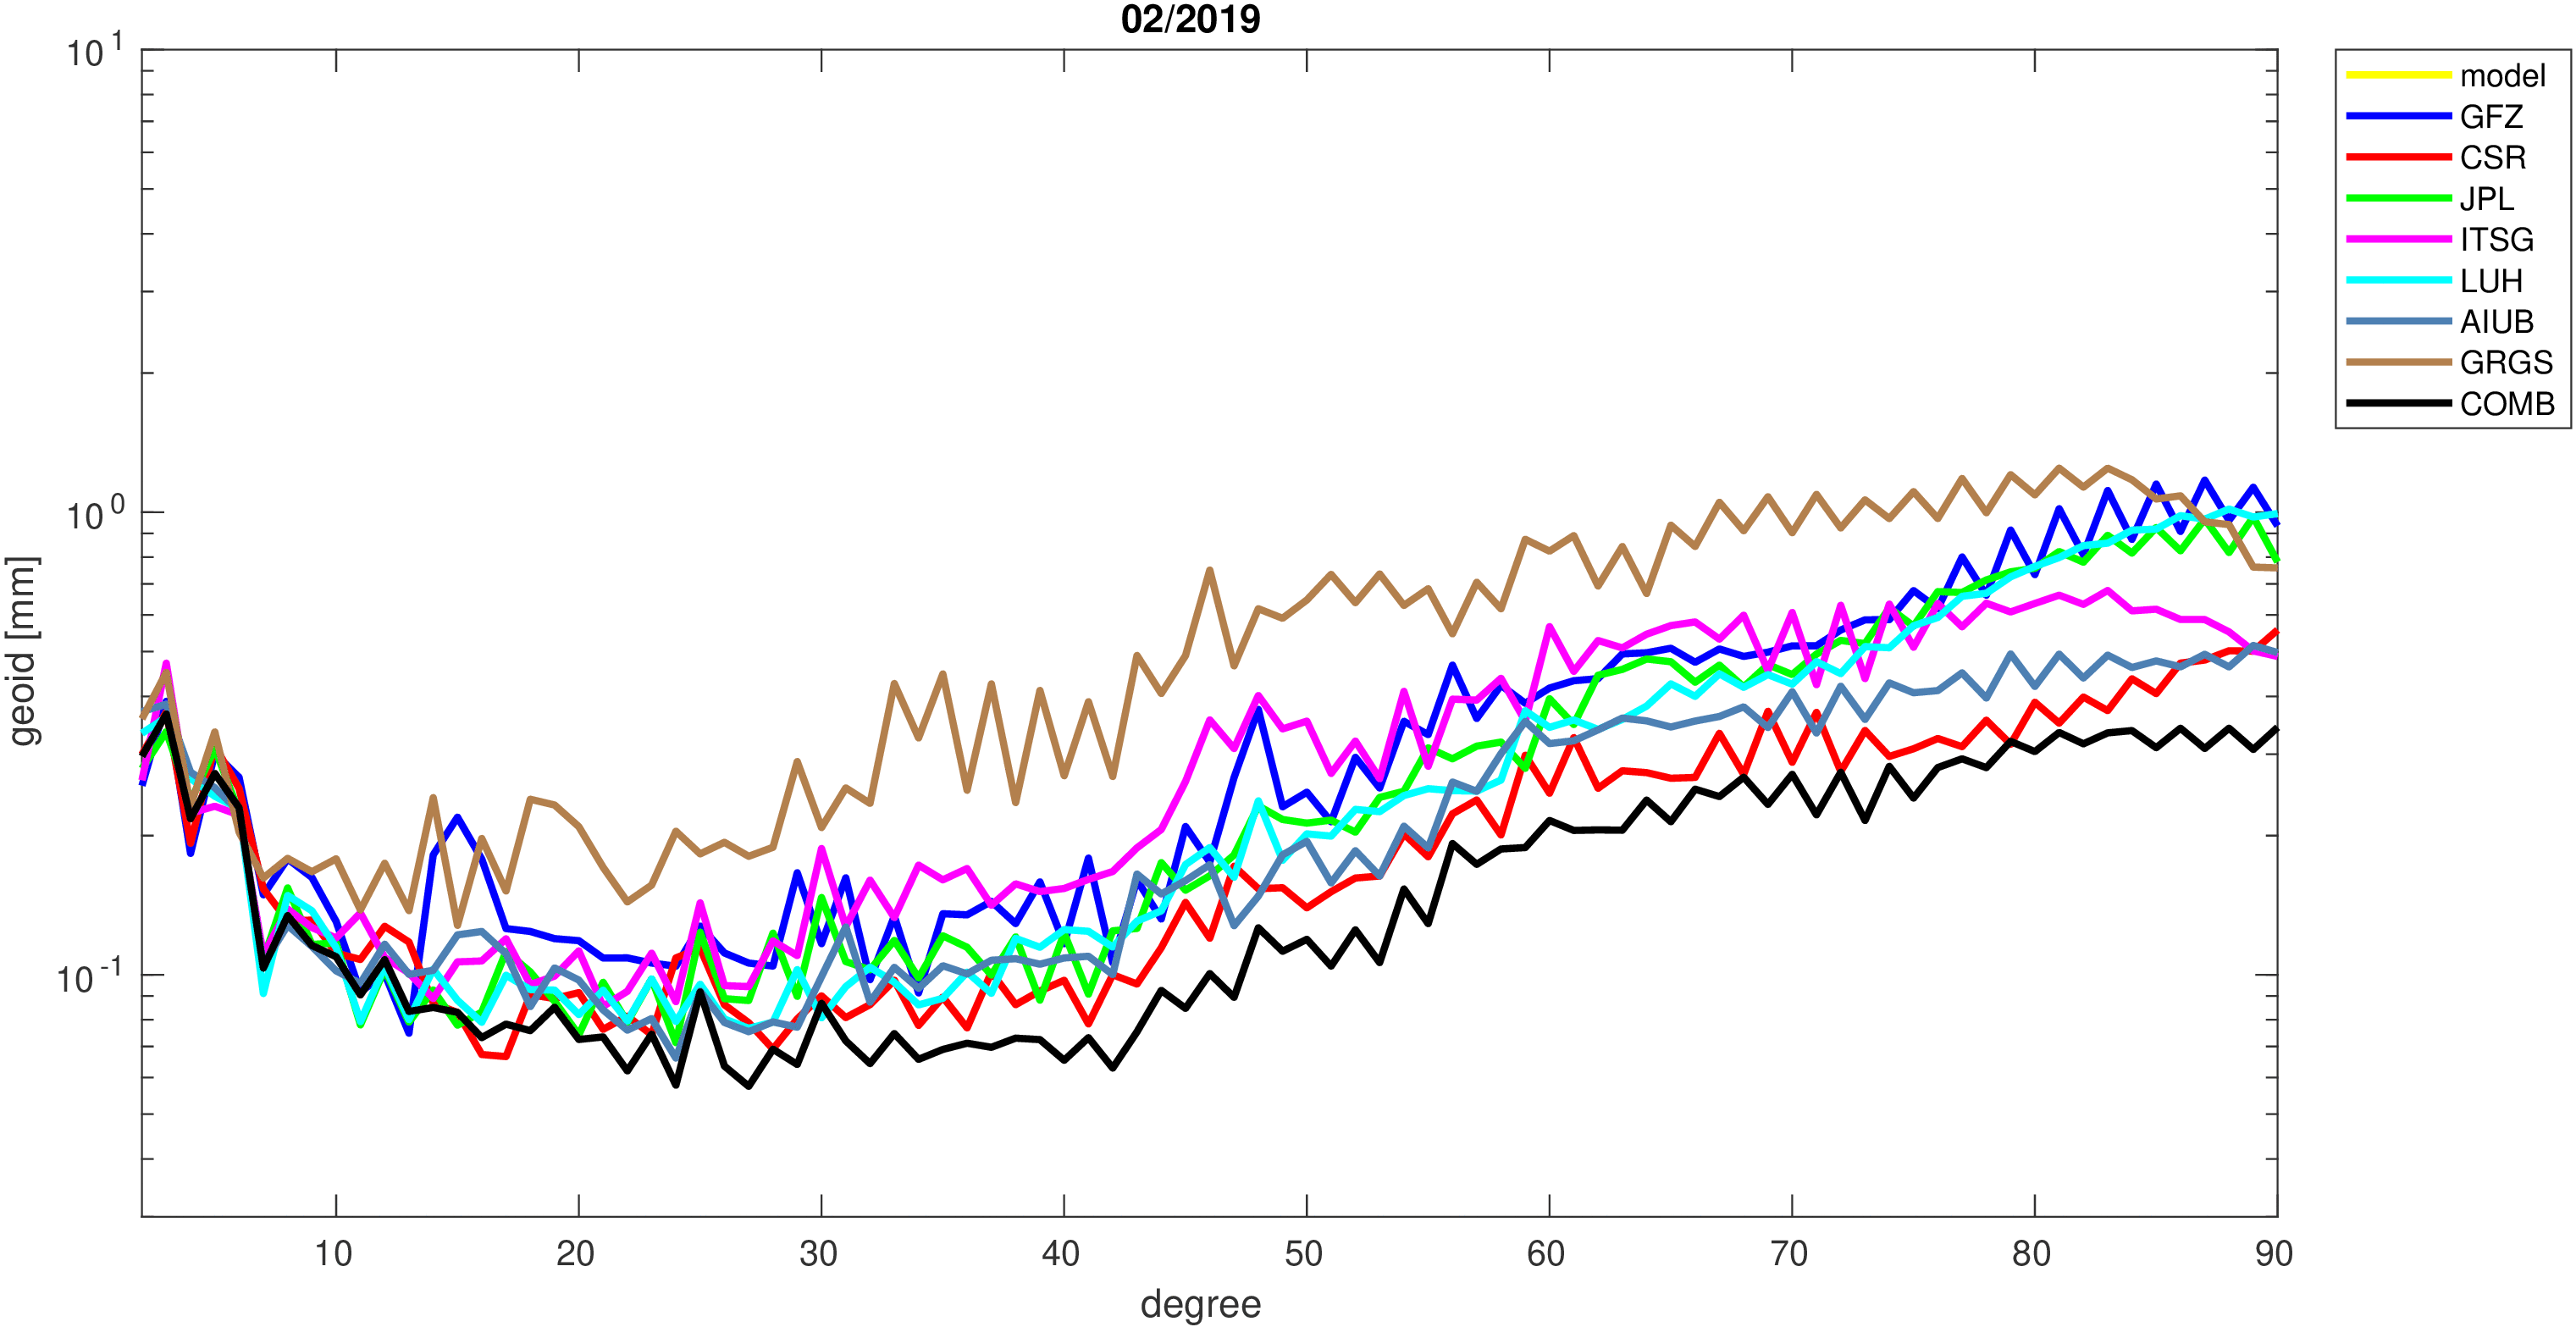
|
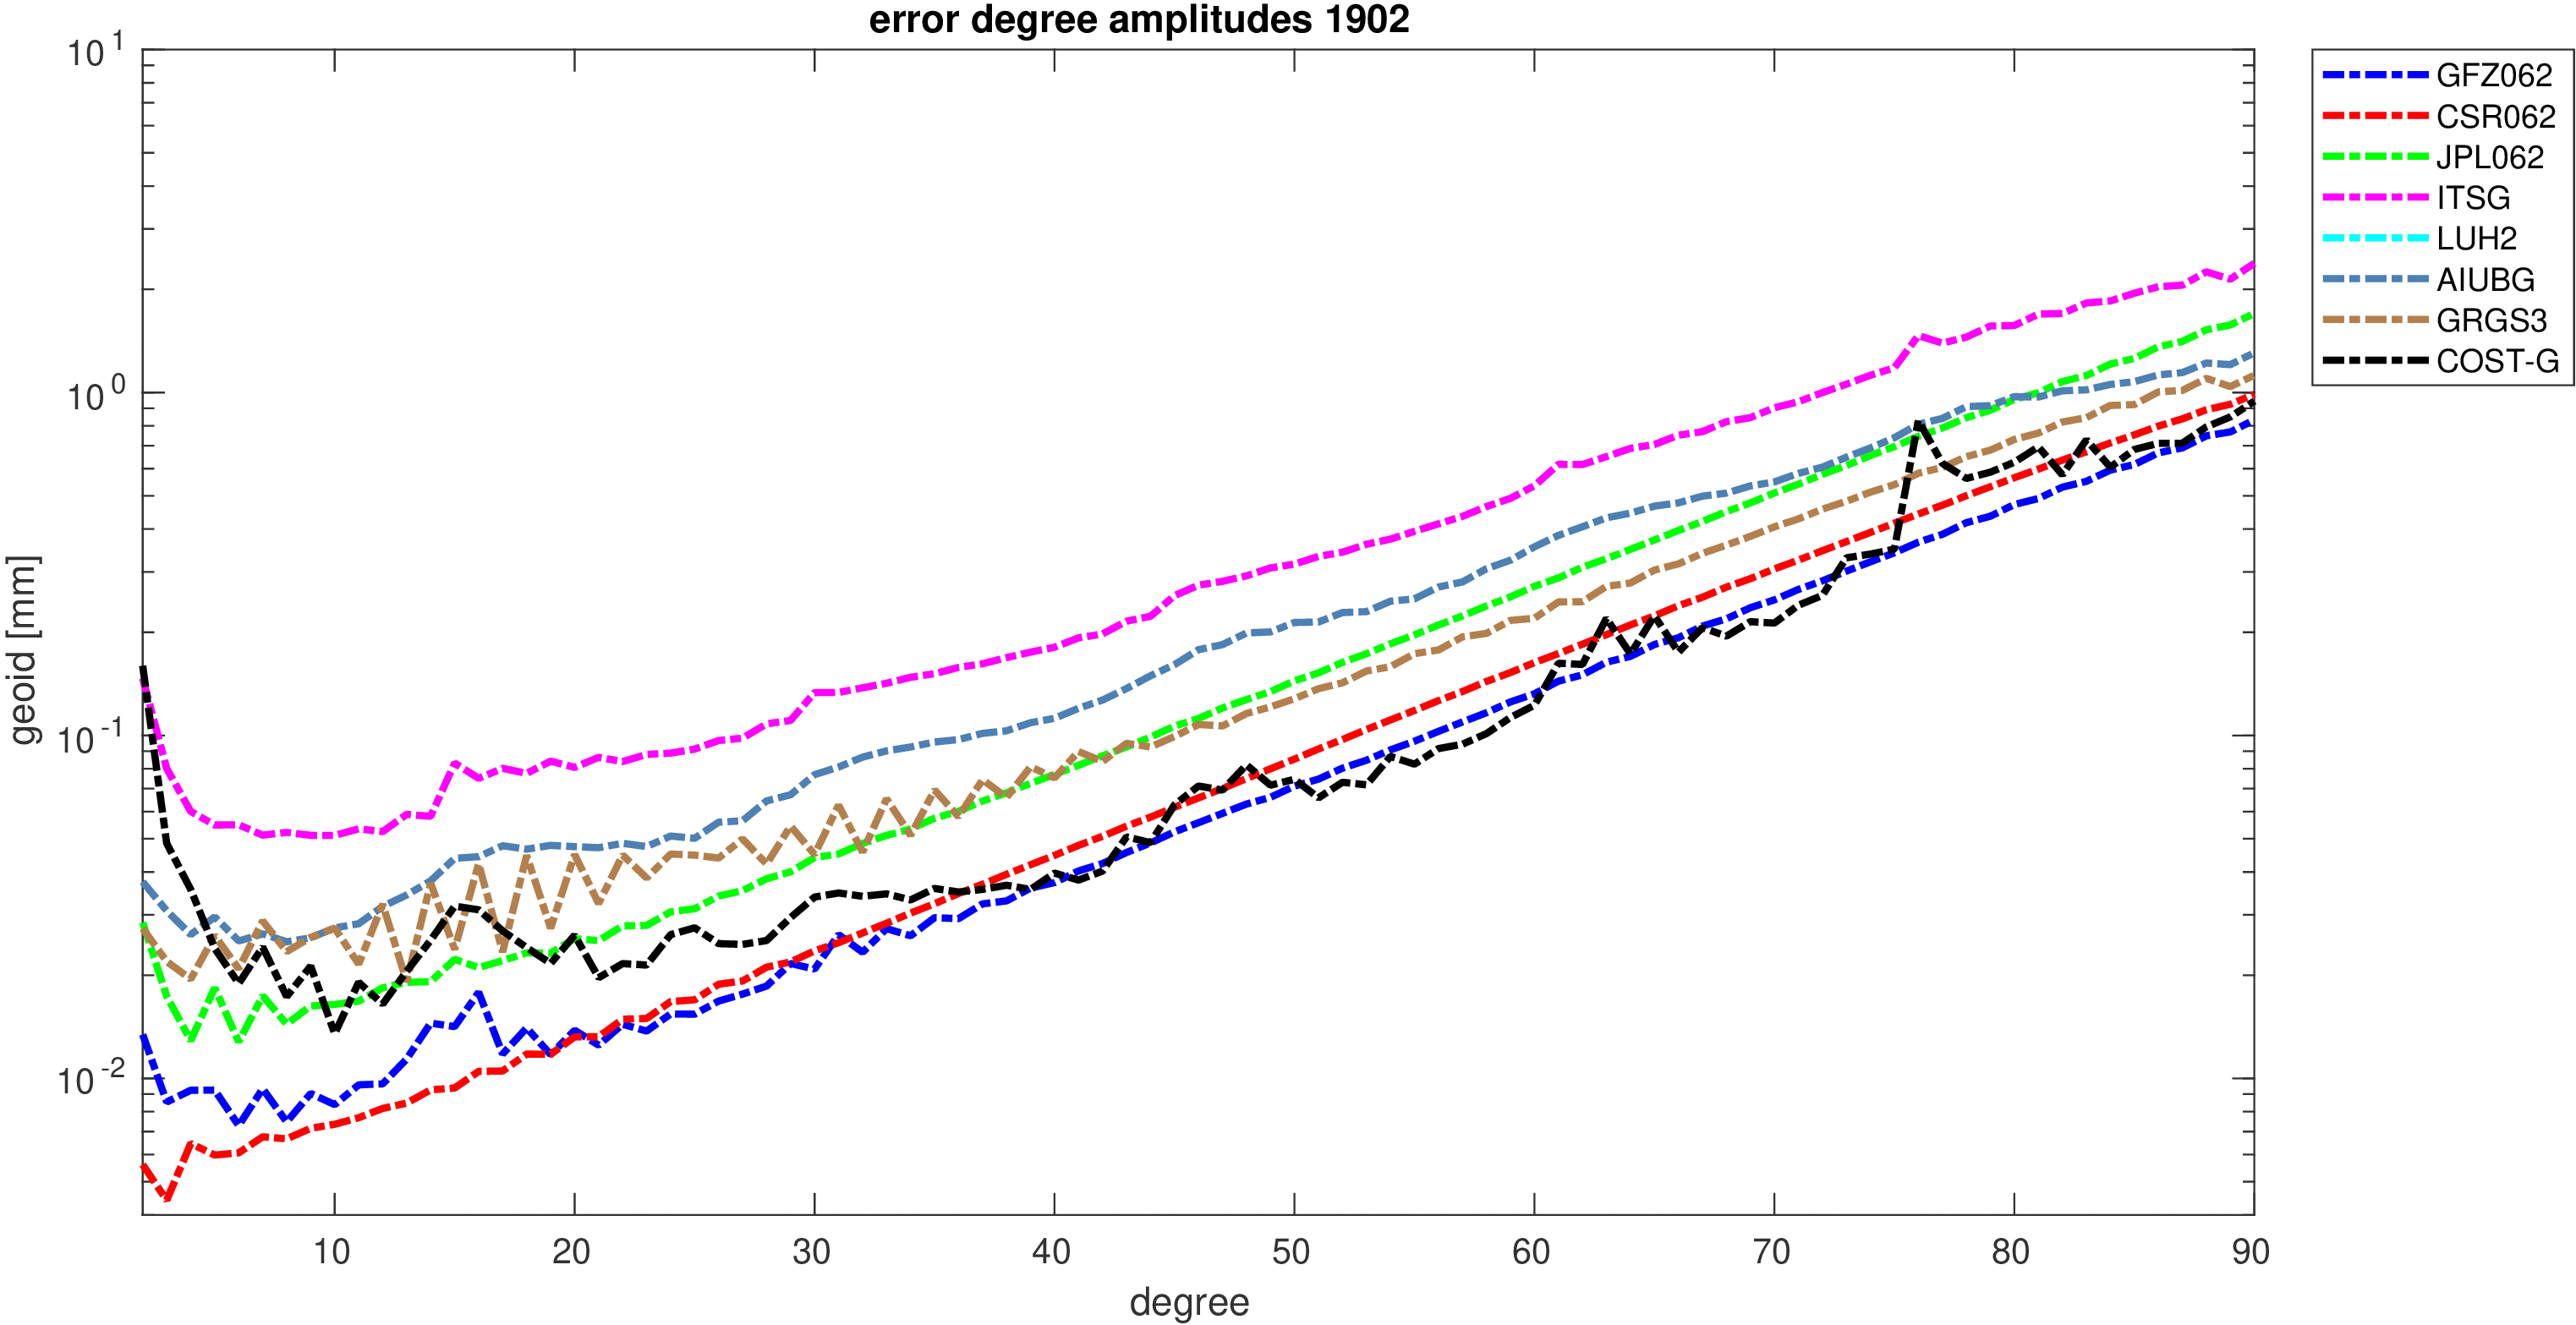
|
| 03/2019 |

|
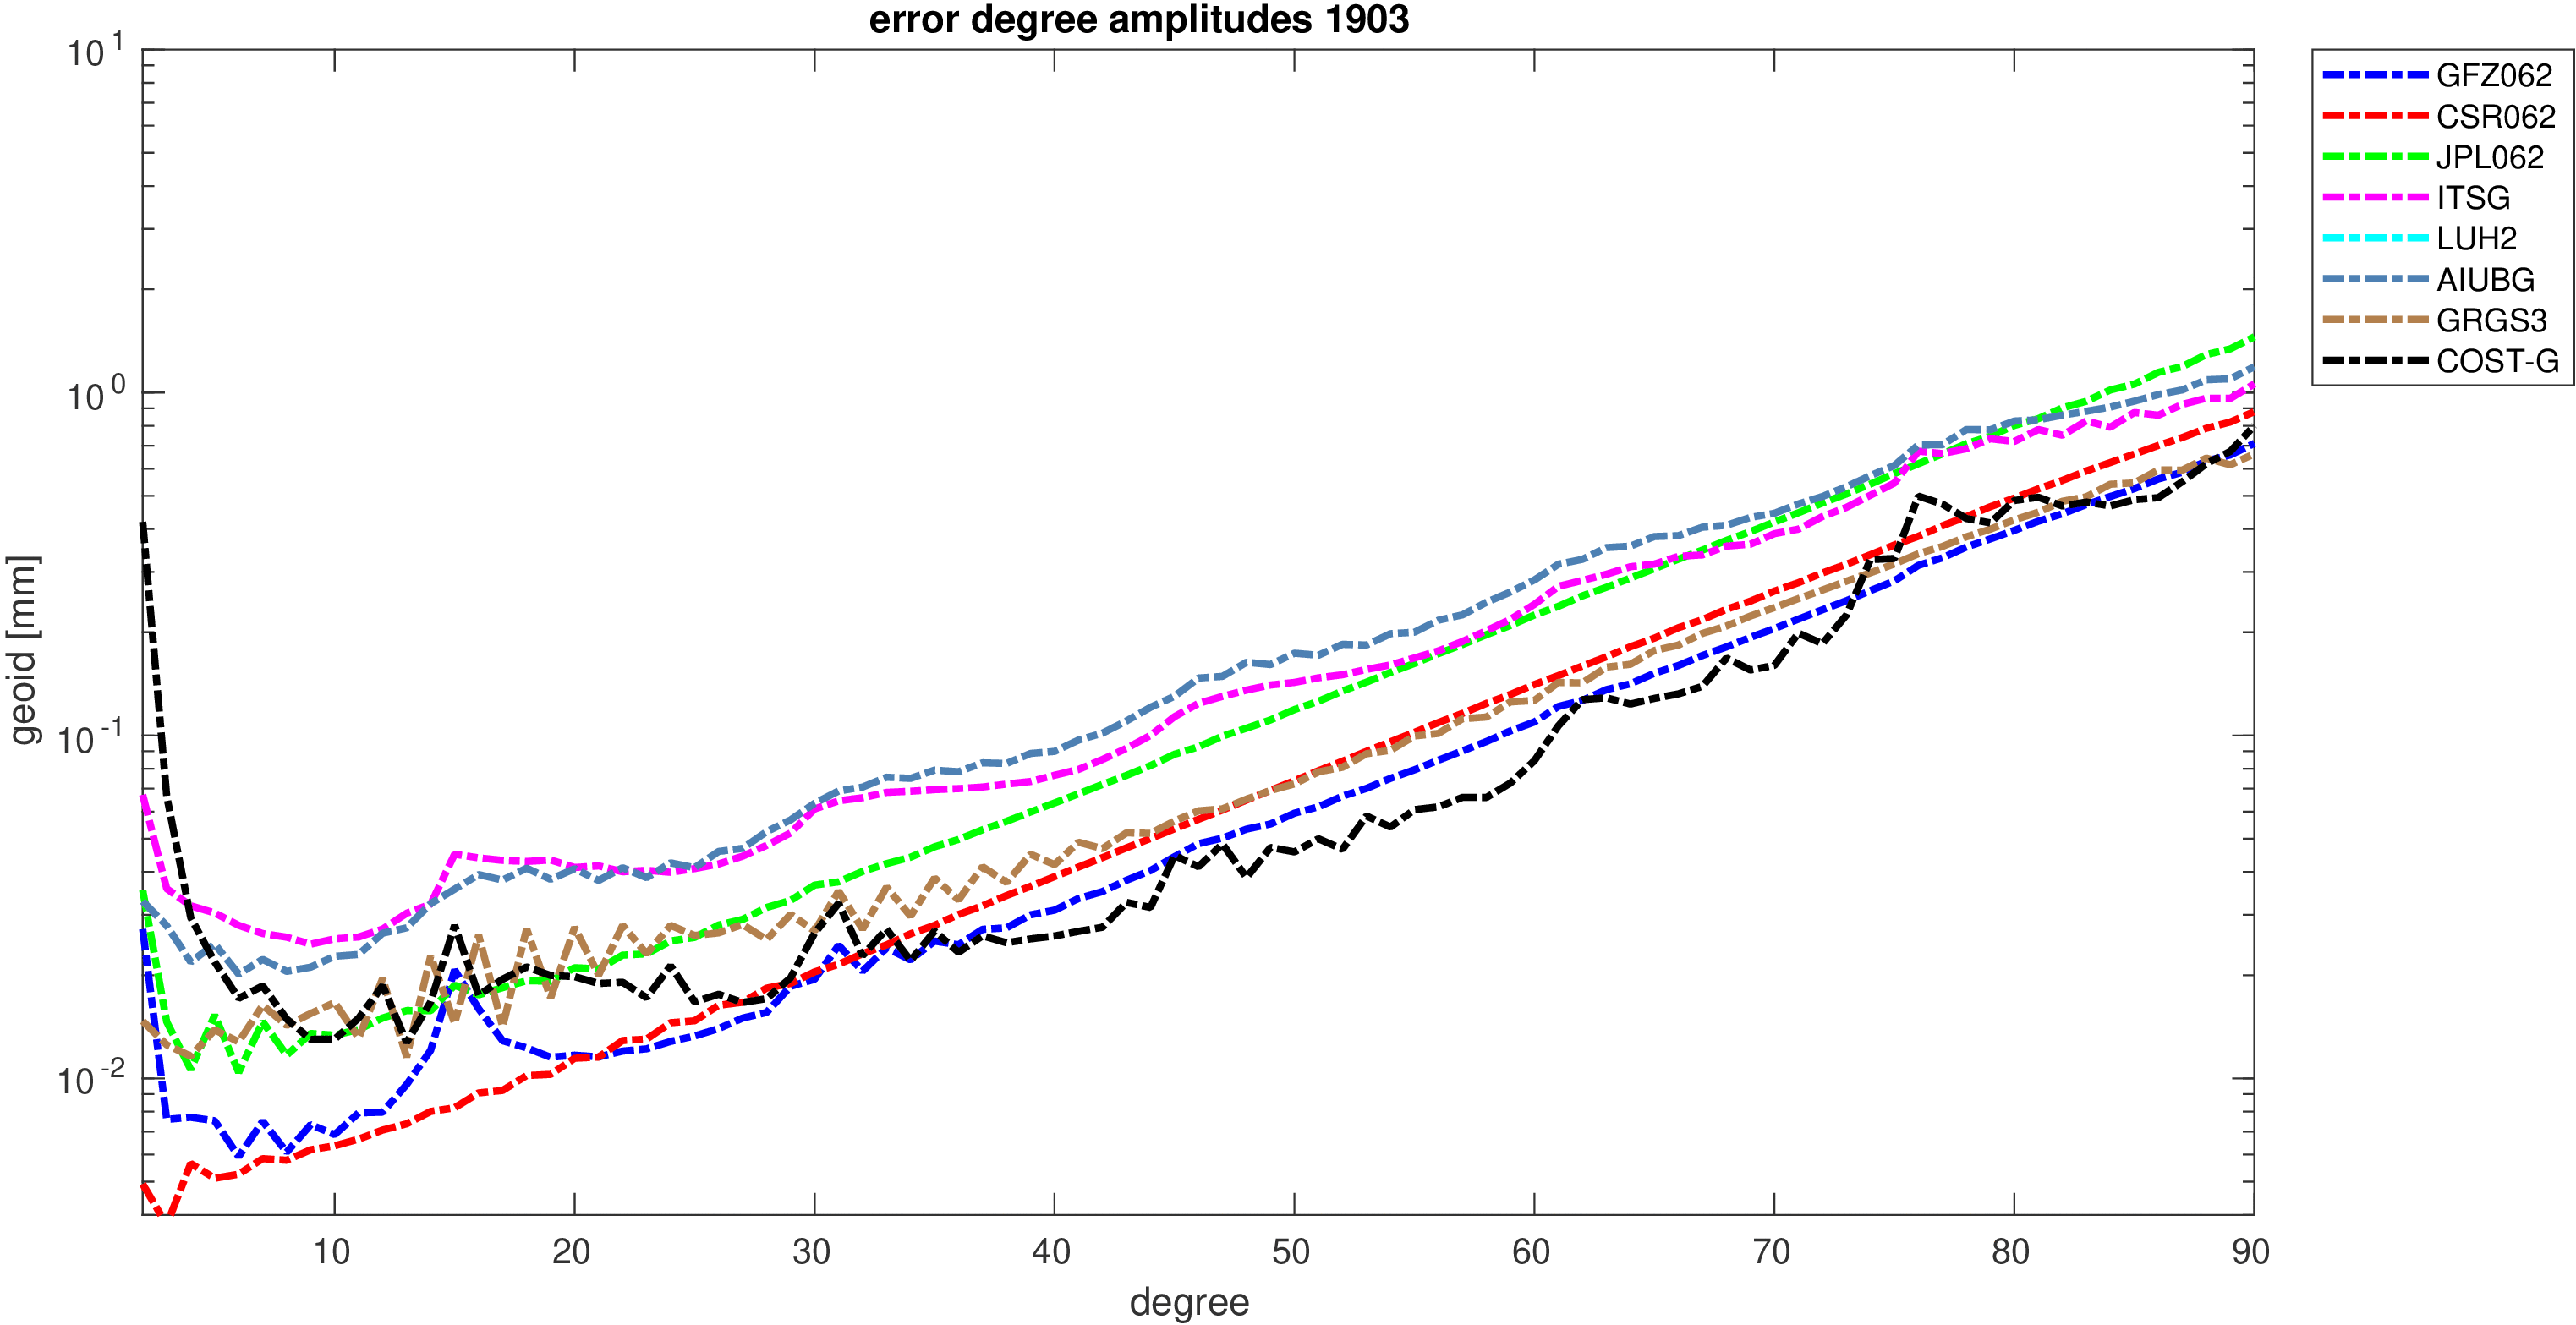
|
| 04/2019 |
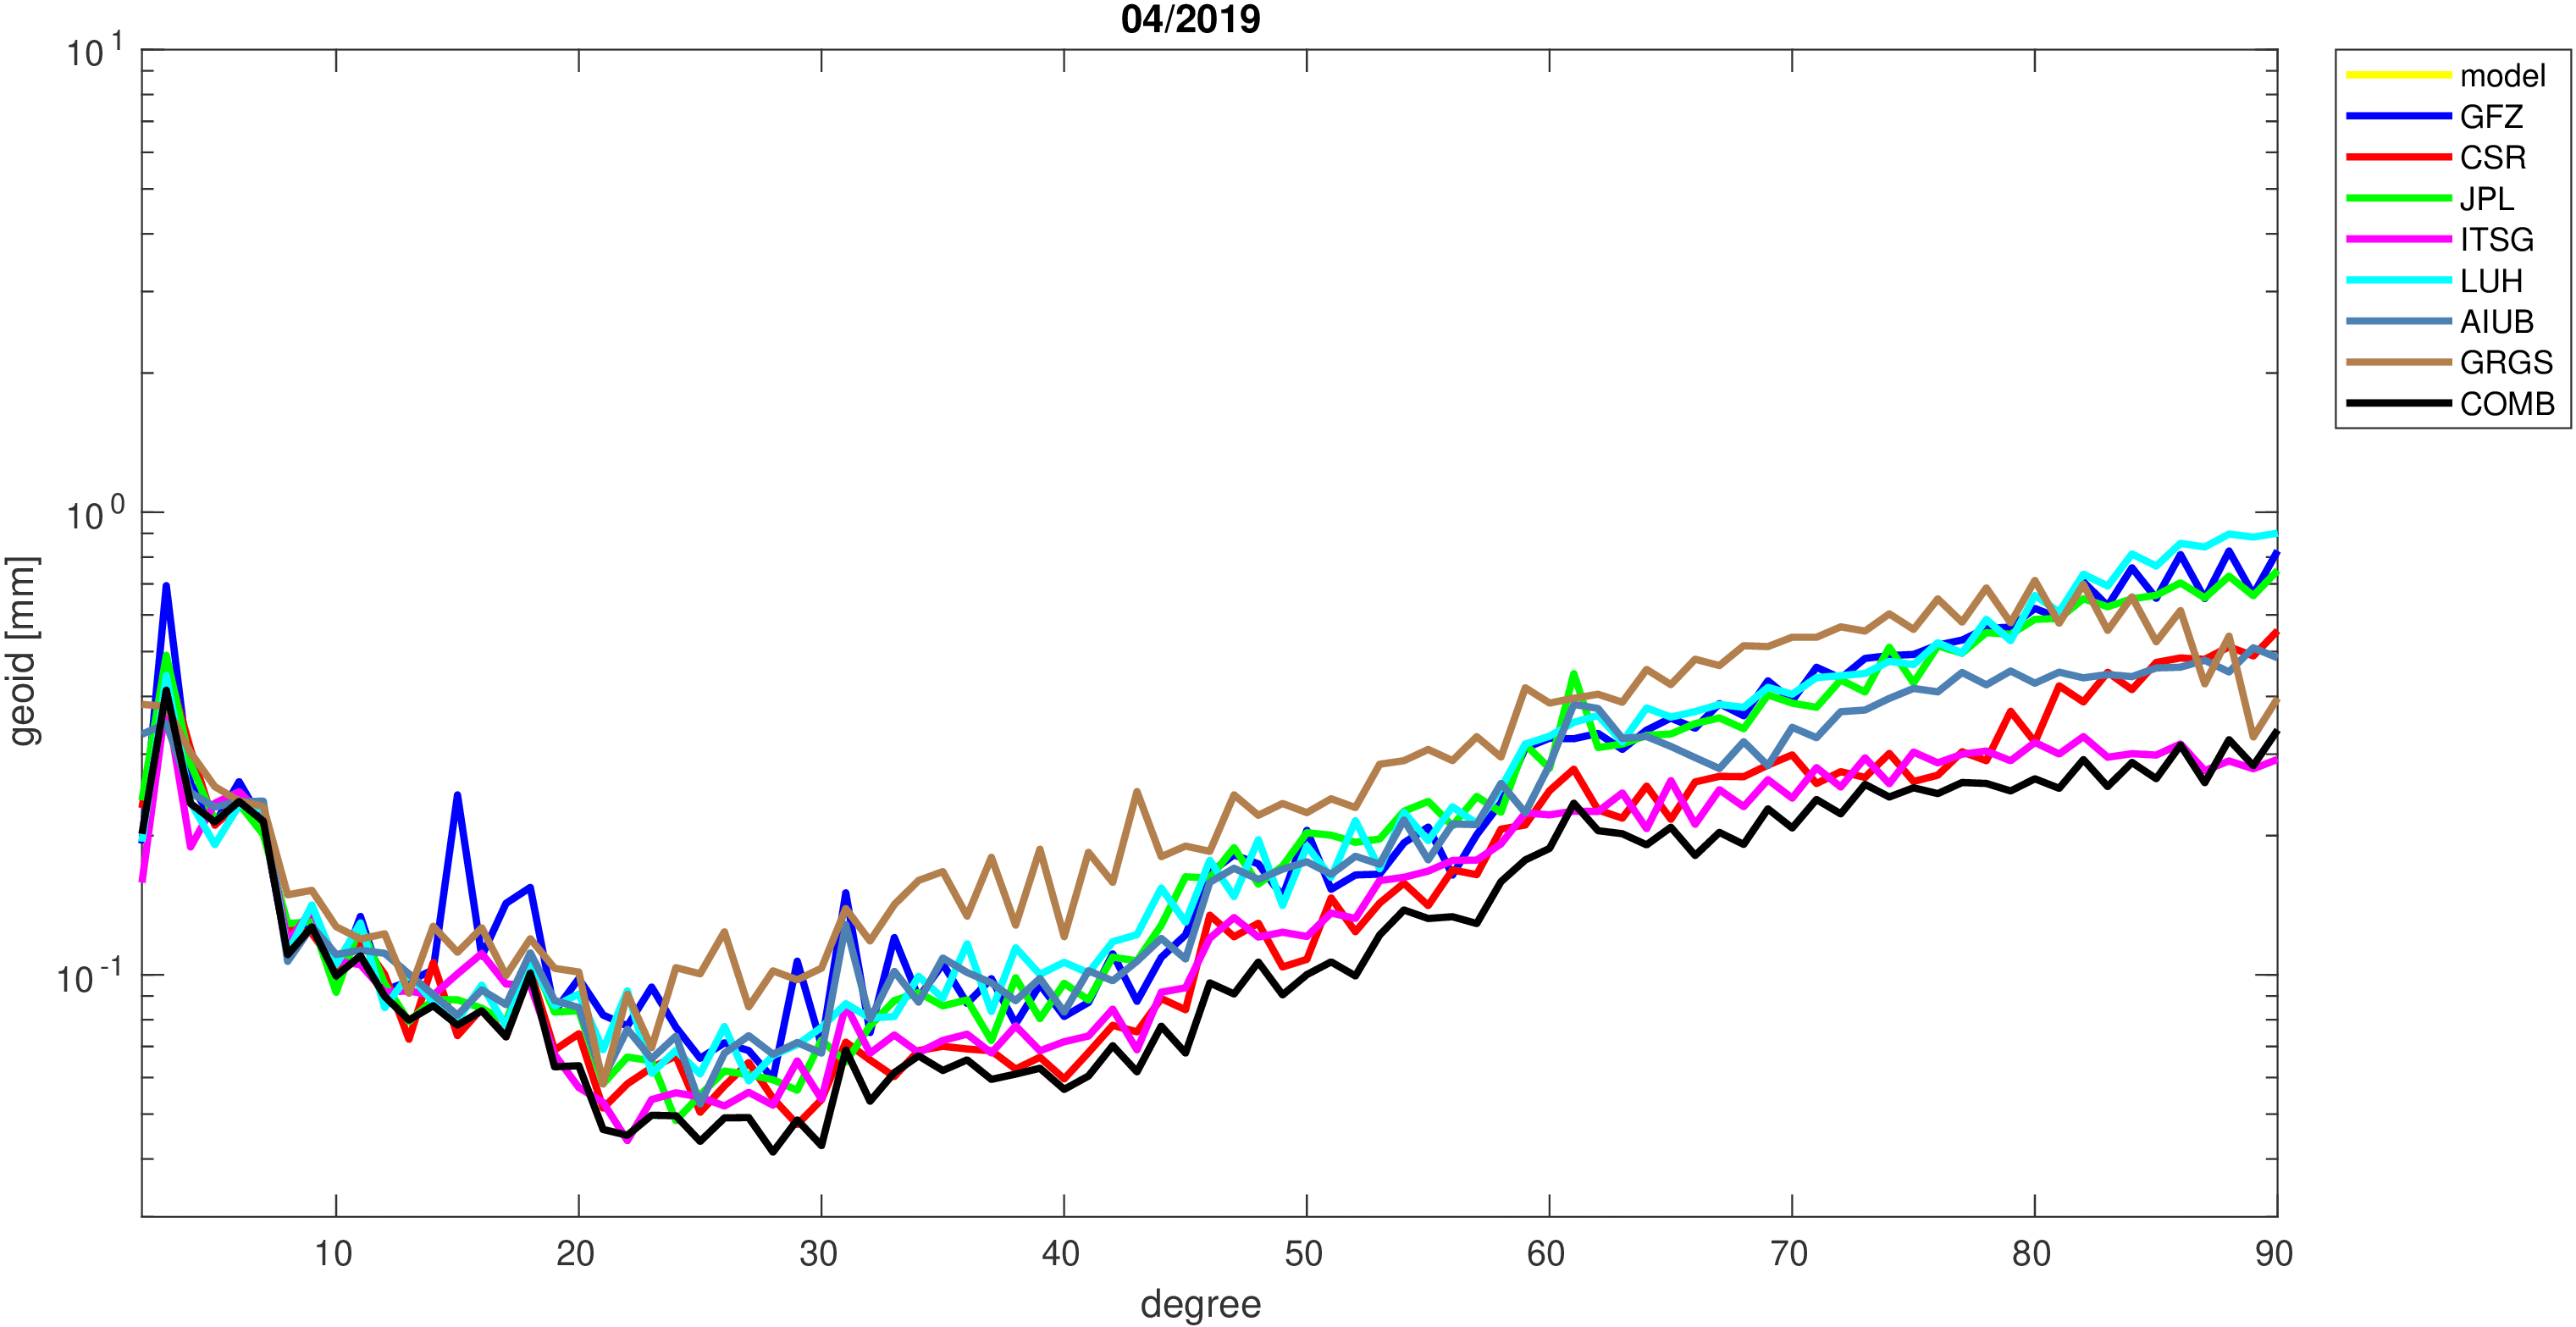
|

|
| 05/2019 |

|
|
| 06/2019 |

|
|
| 07/2019 |

|

|
| 08/2019 |
|
|
| 09/2019 |

|

|
| 10/2019 |
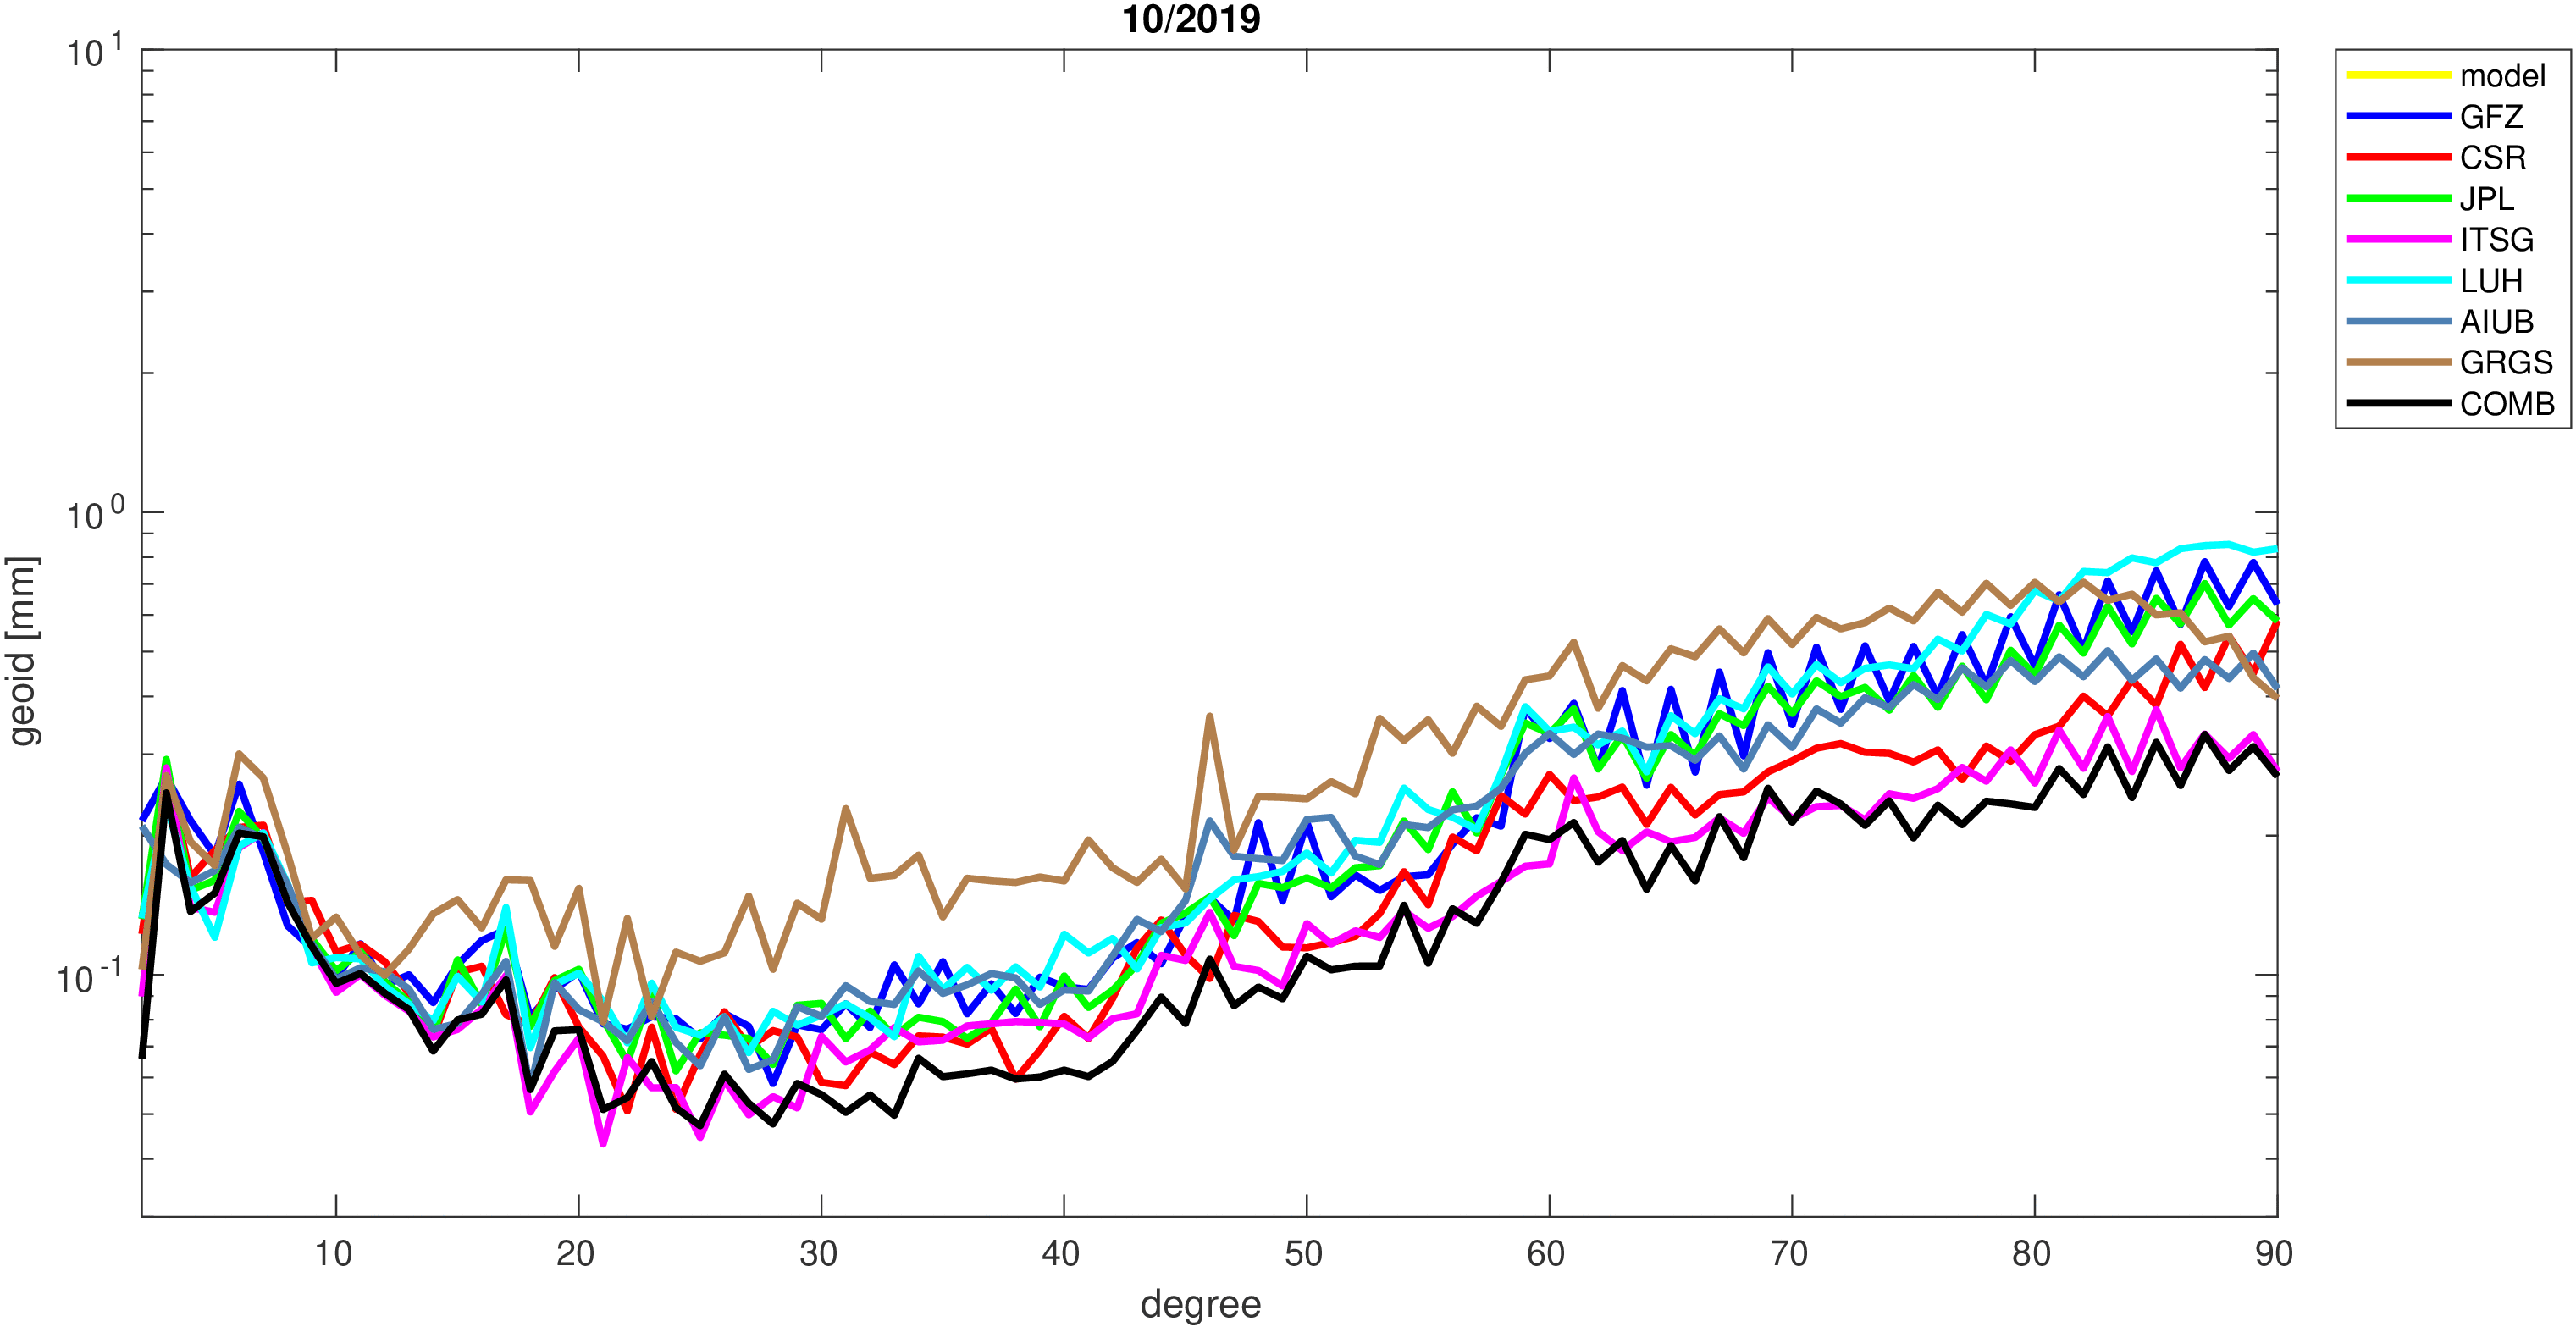
|

|
| 11/2019 |
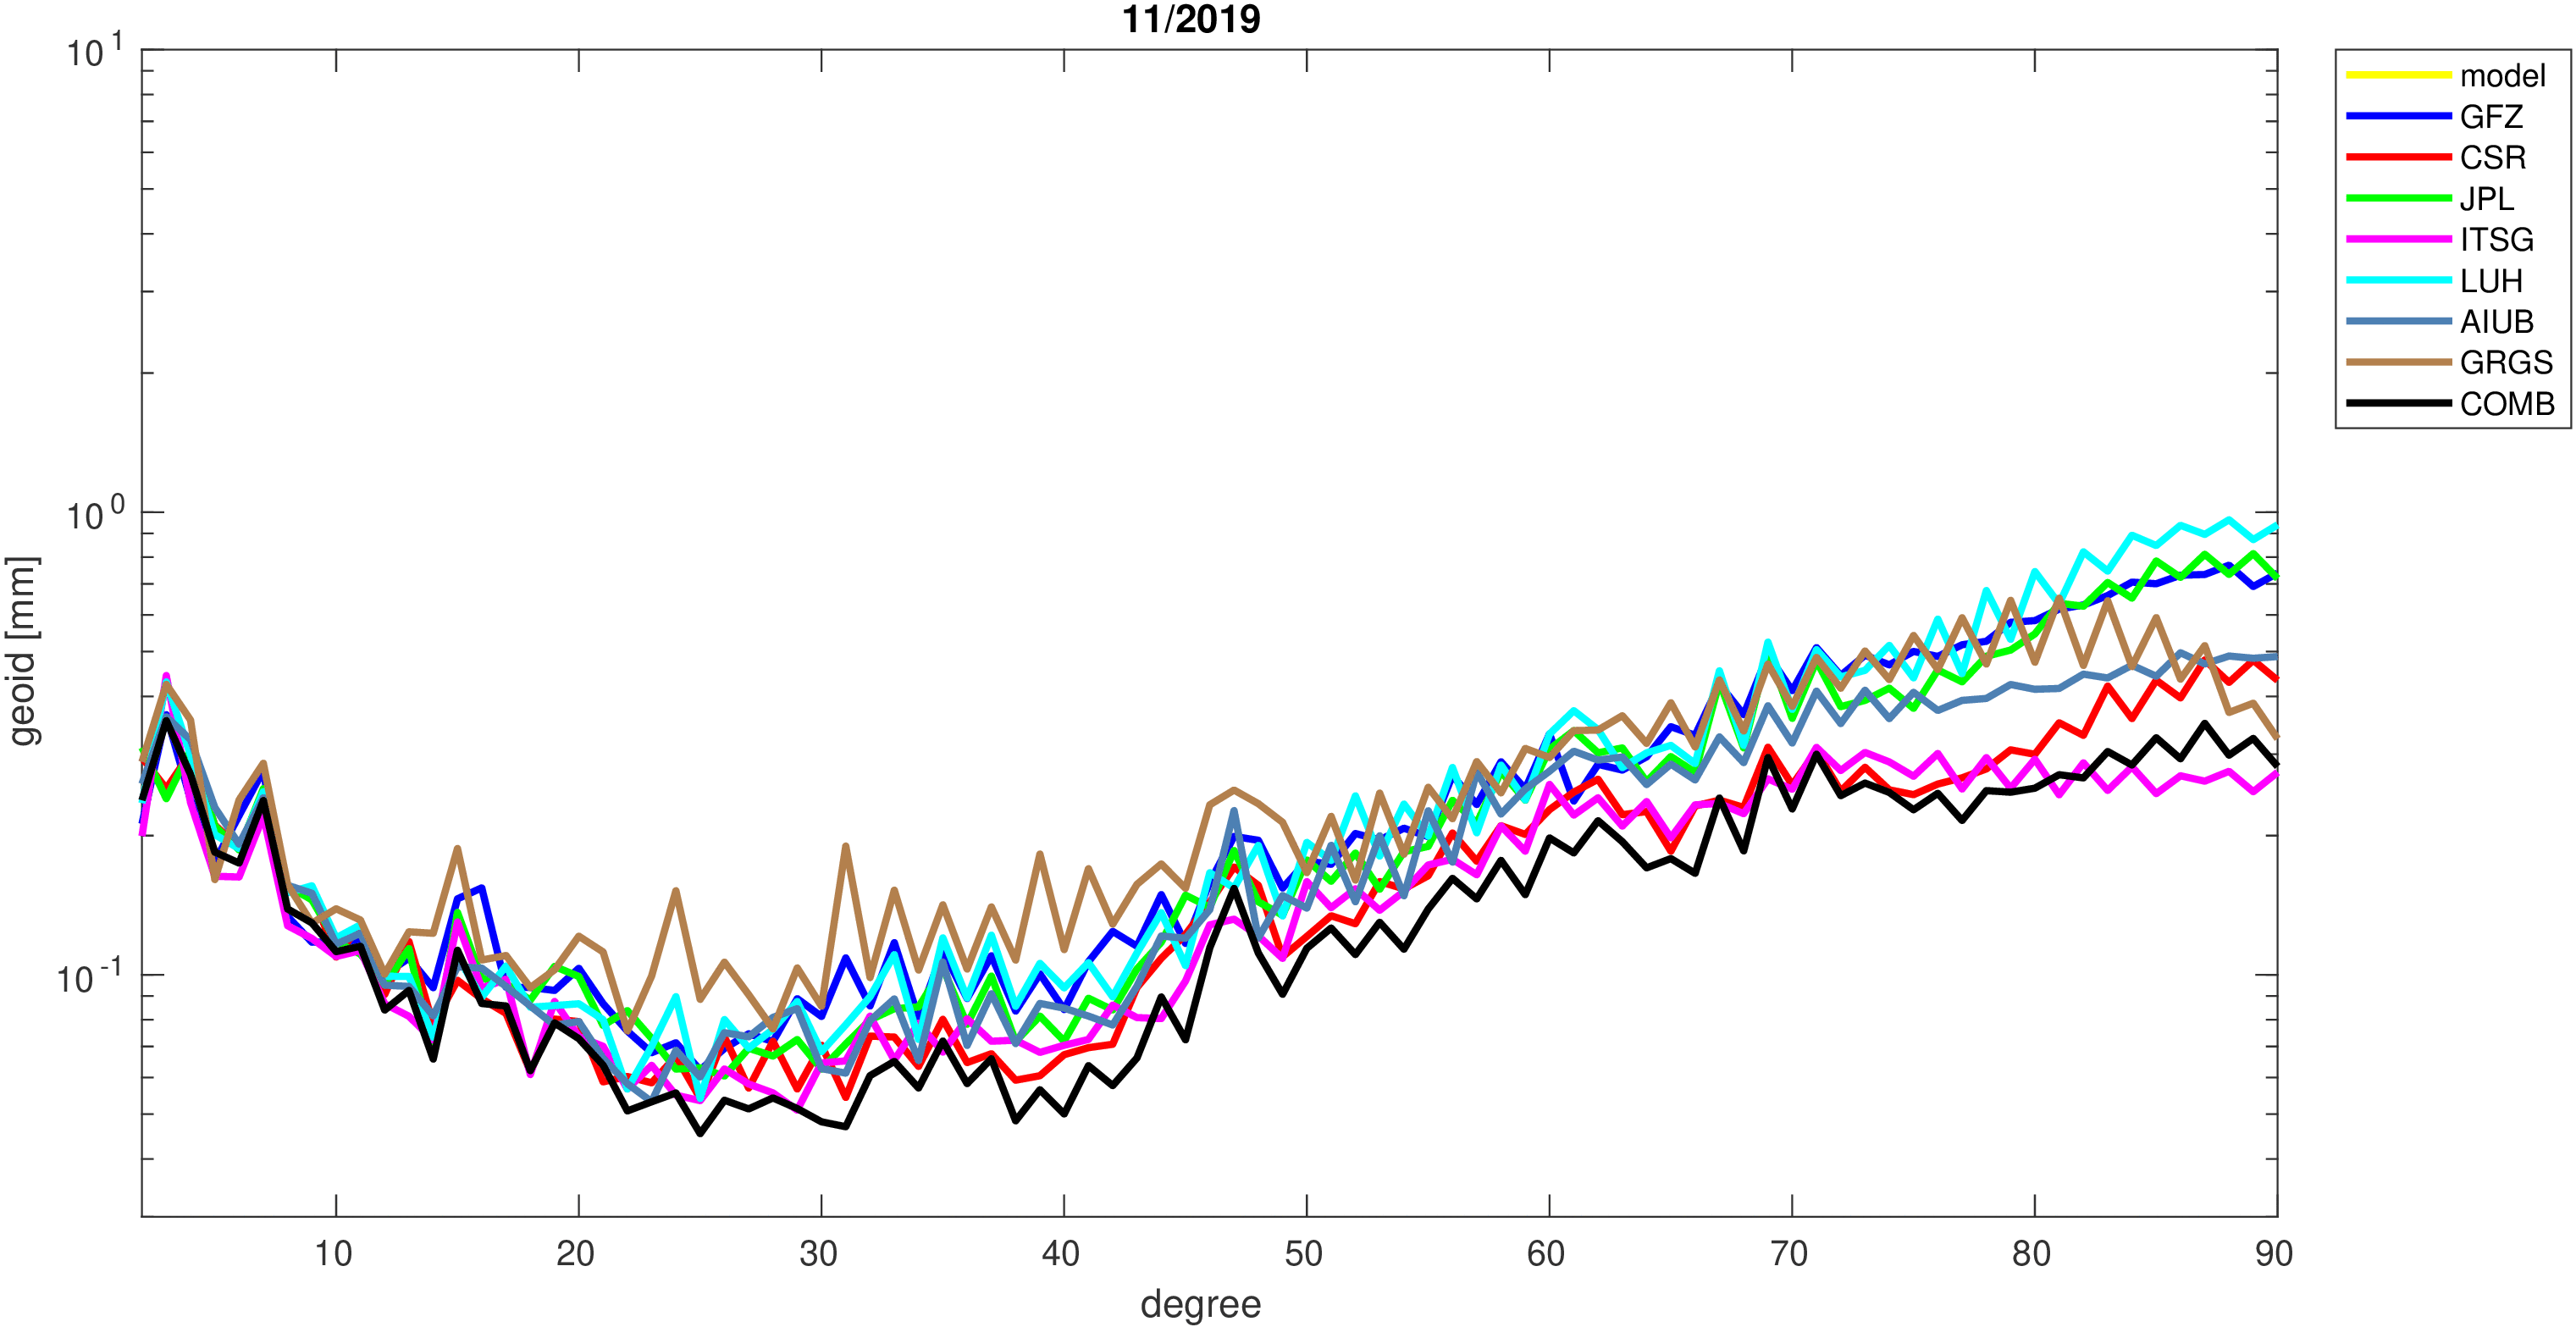
|
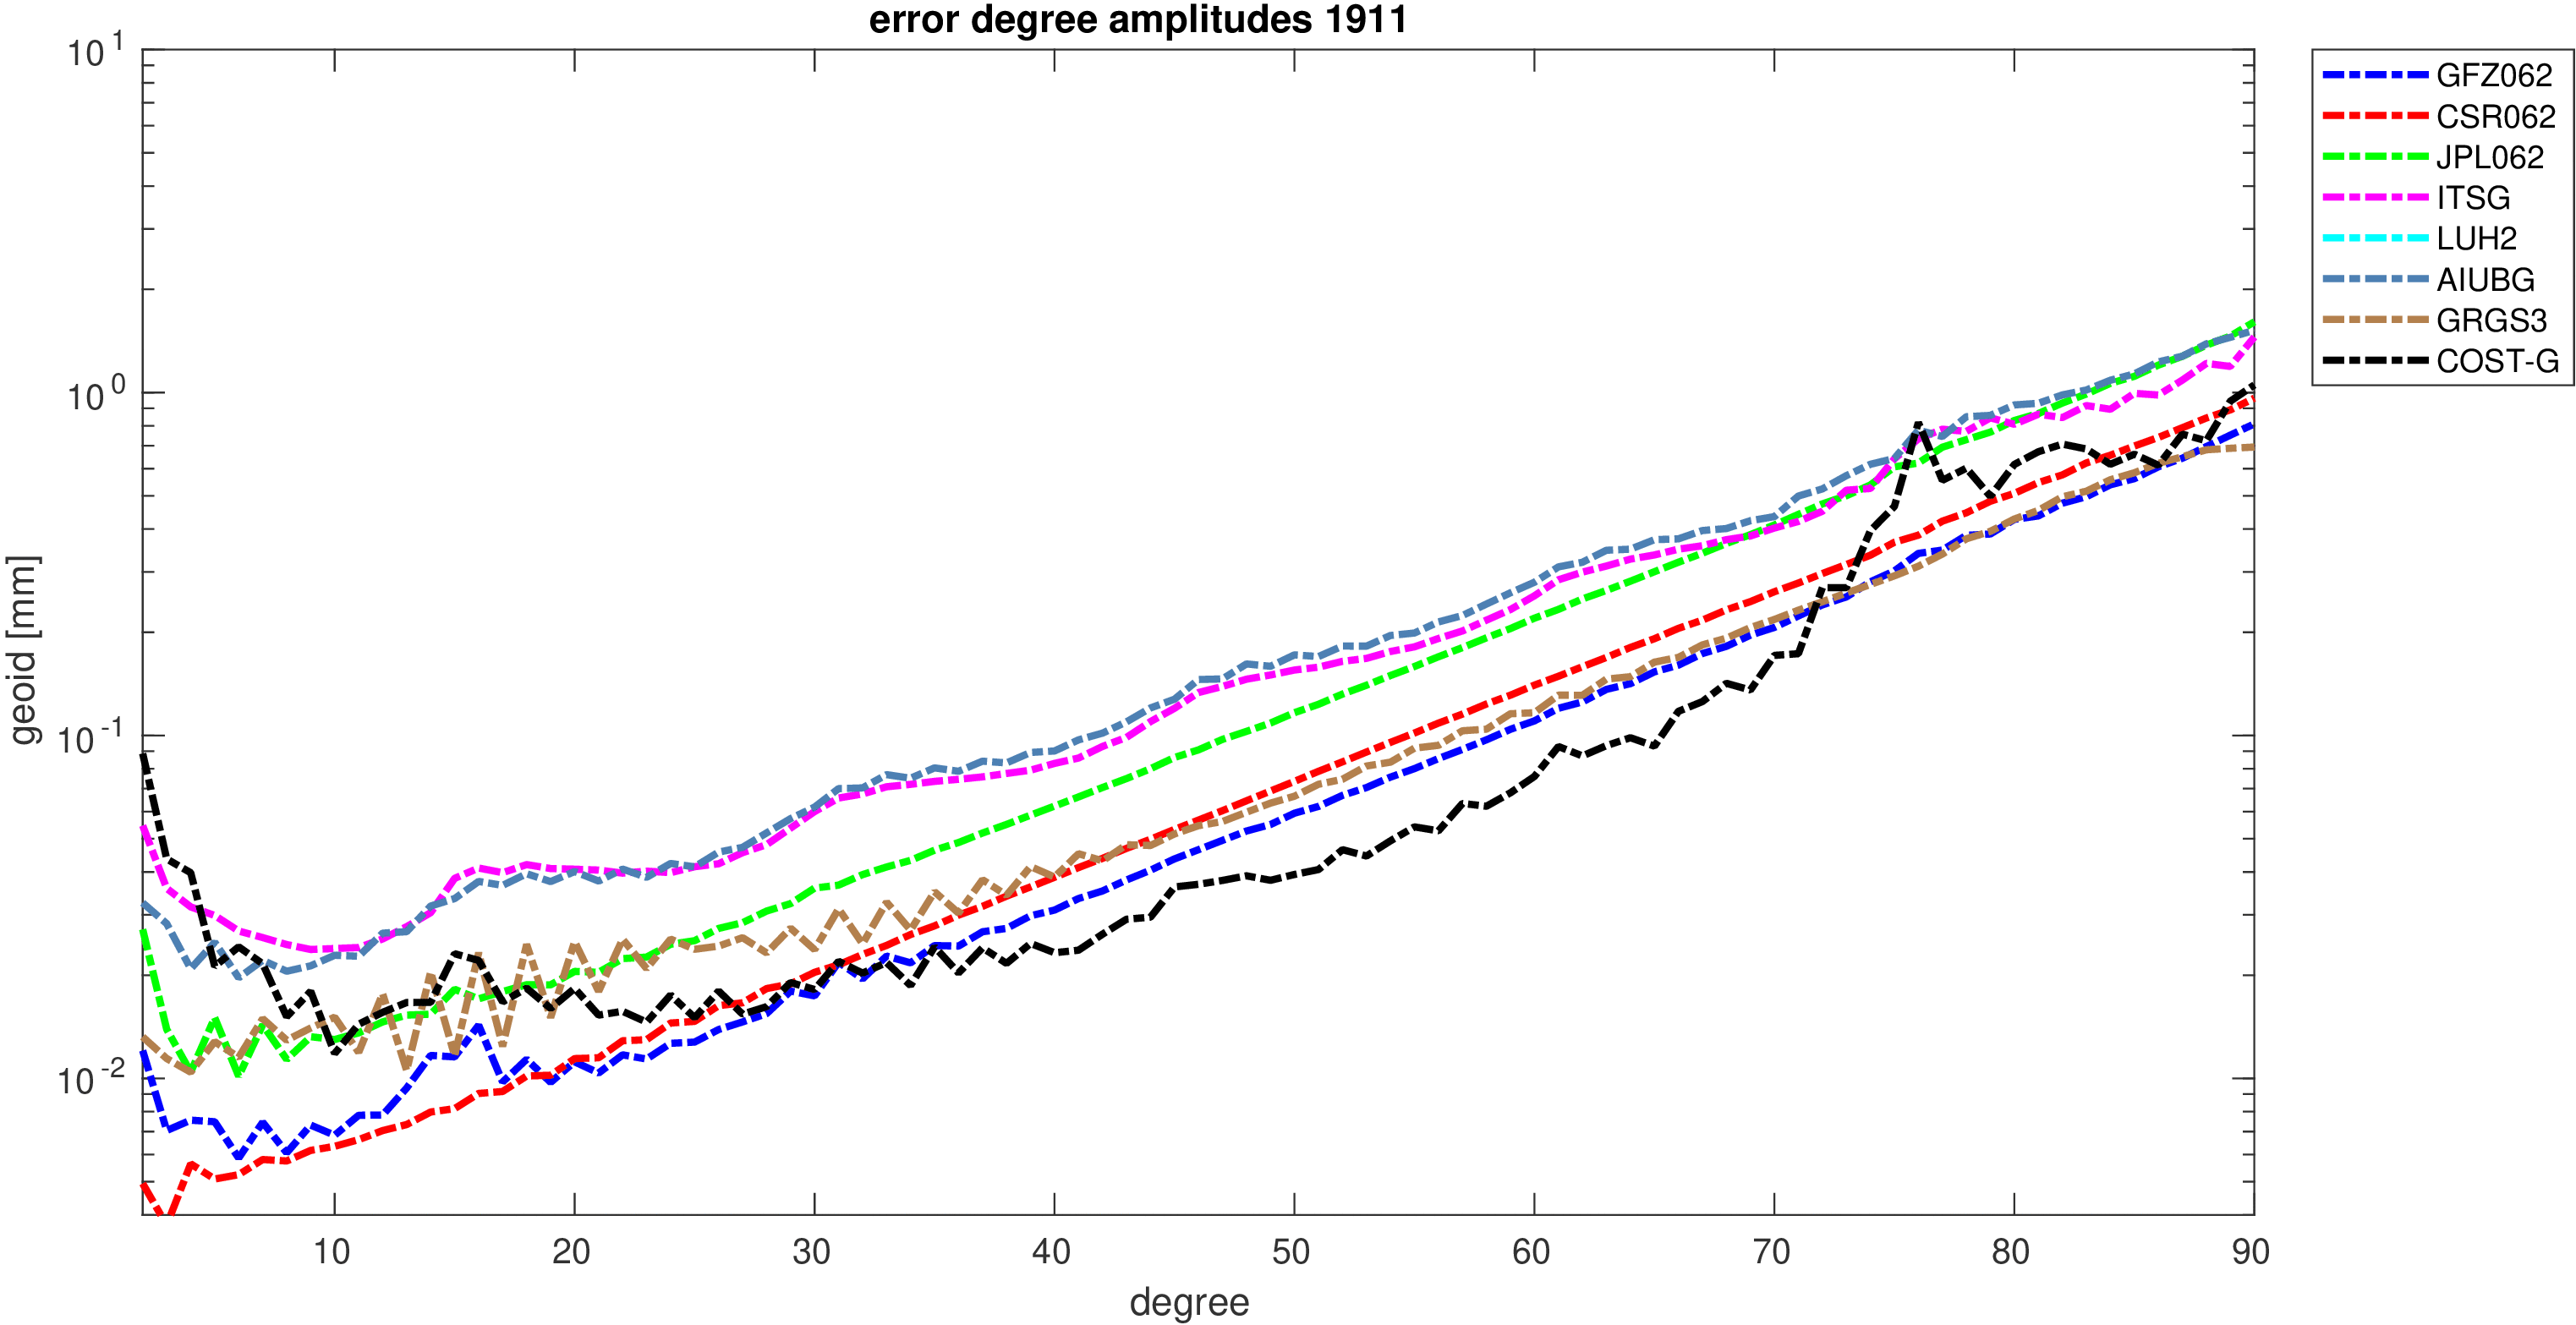
|
| 12/2019 |

|
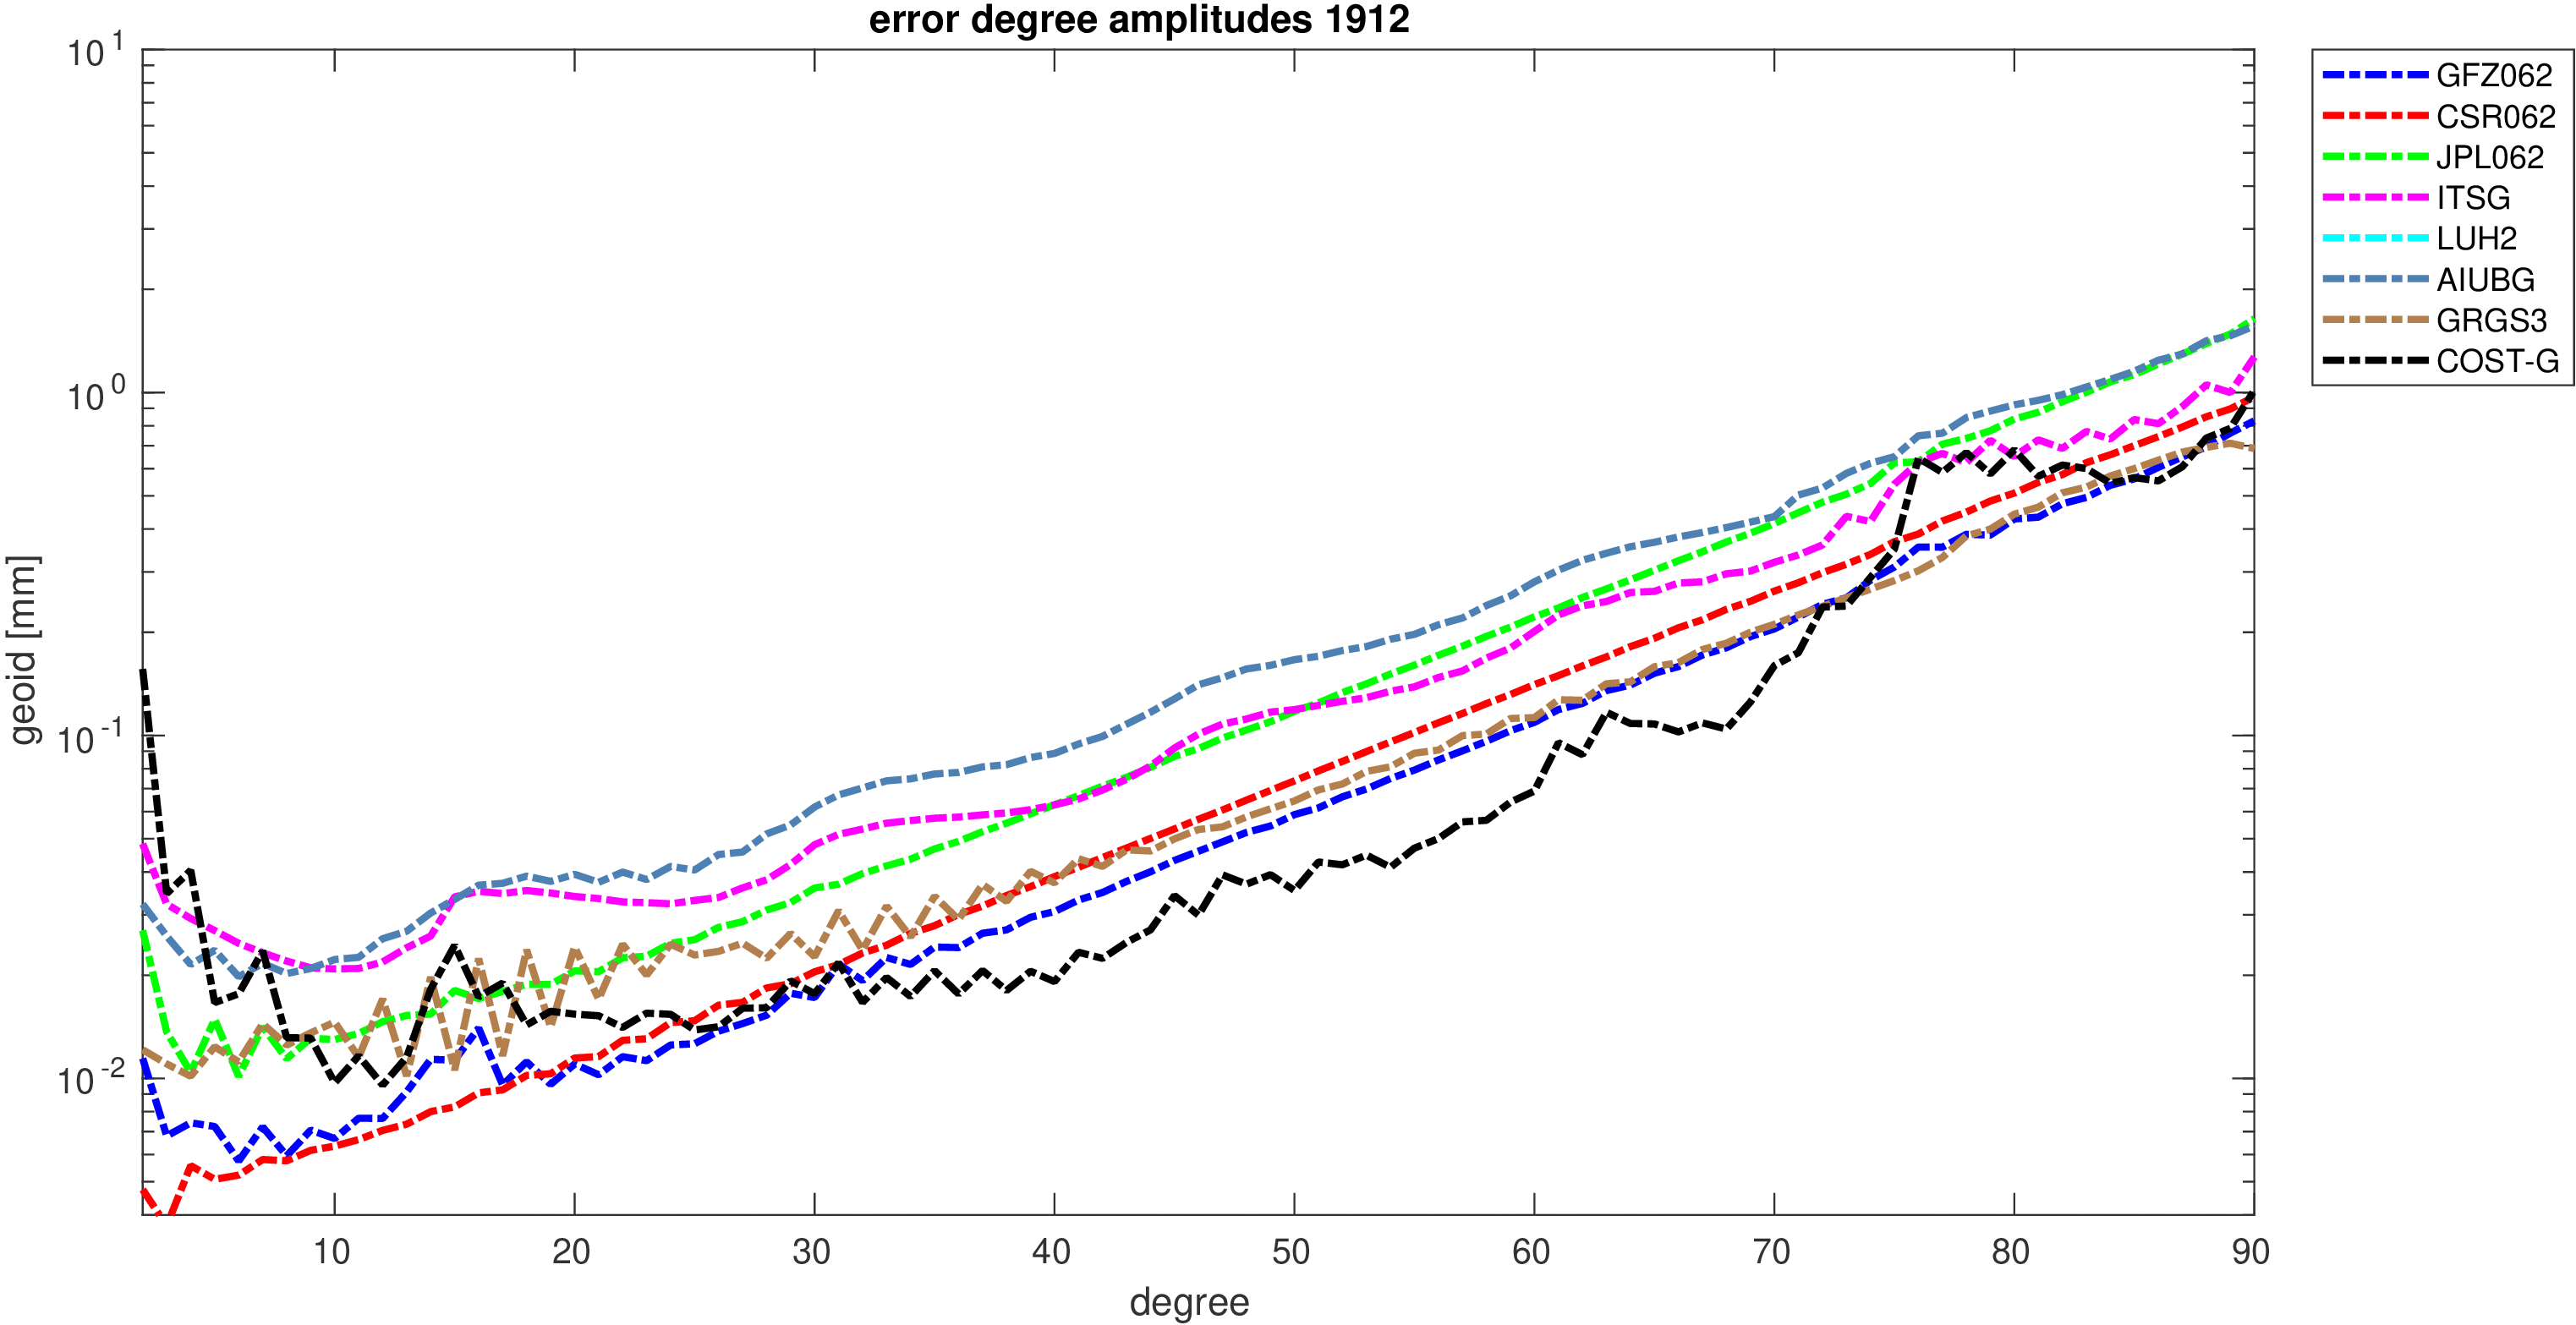
|
| 01/2020 |

|

|
| 02/2020 |
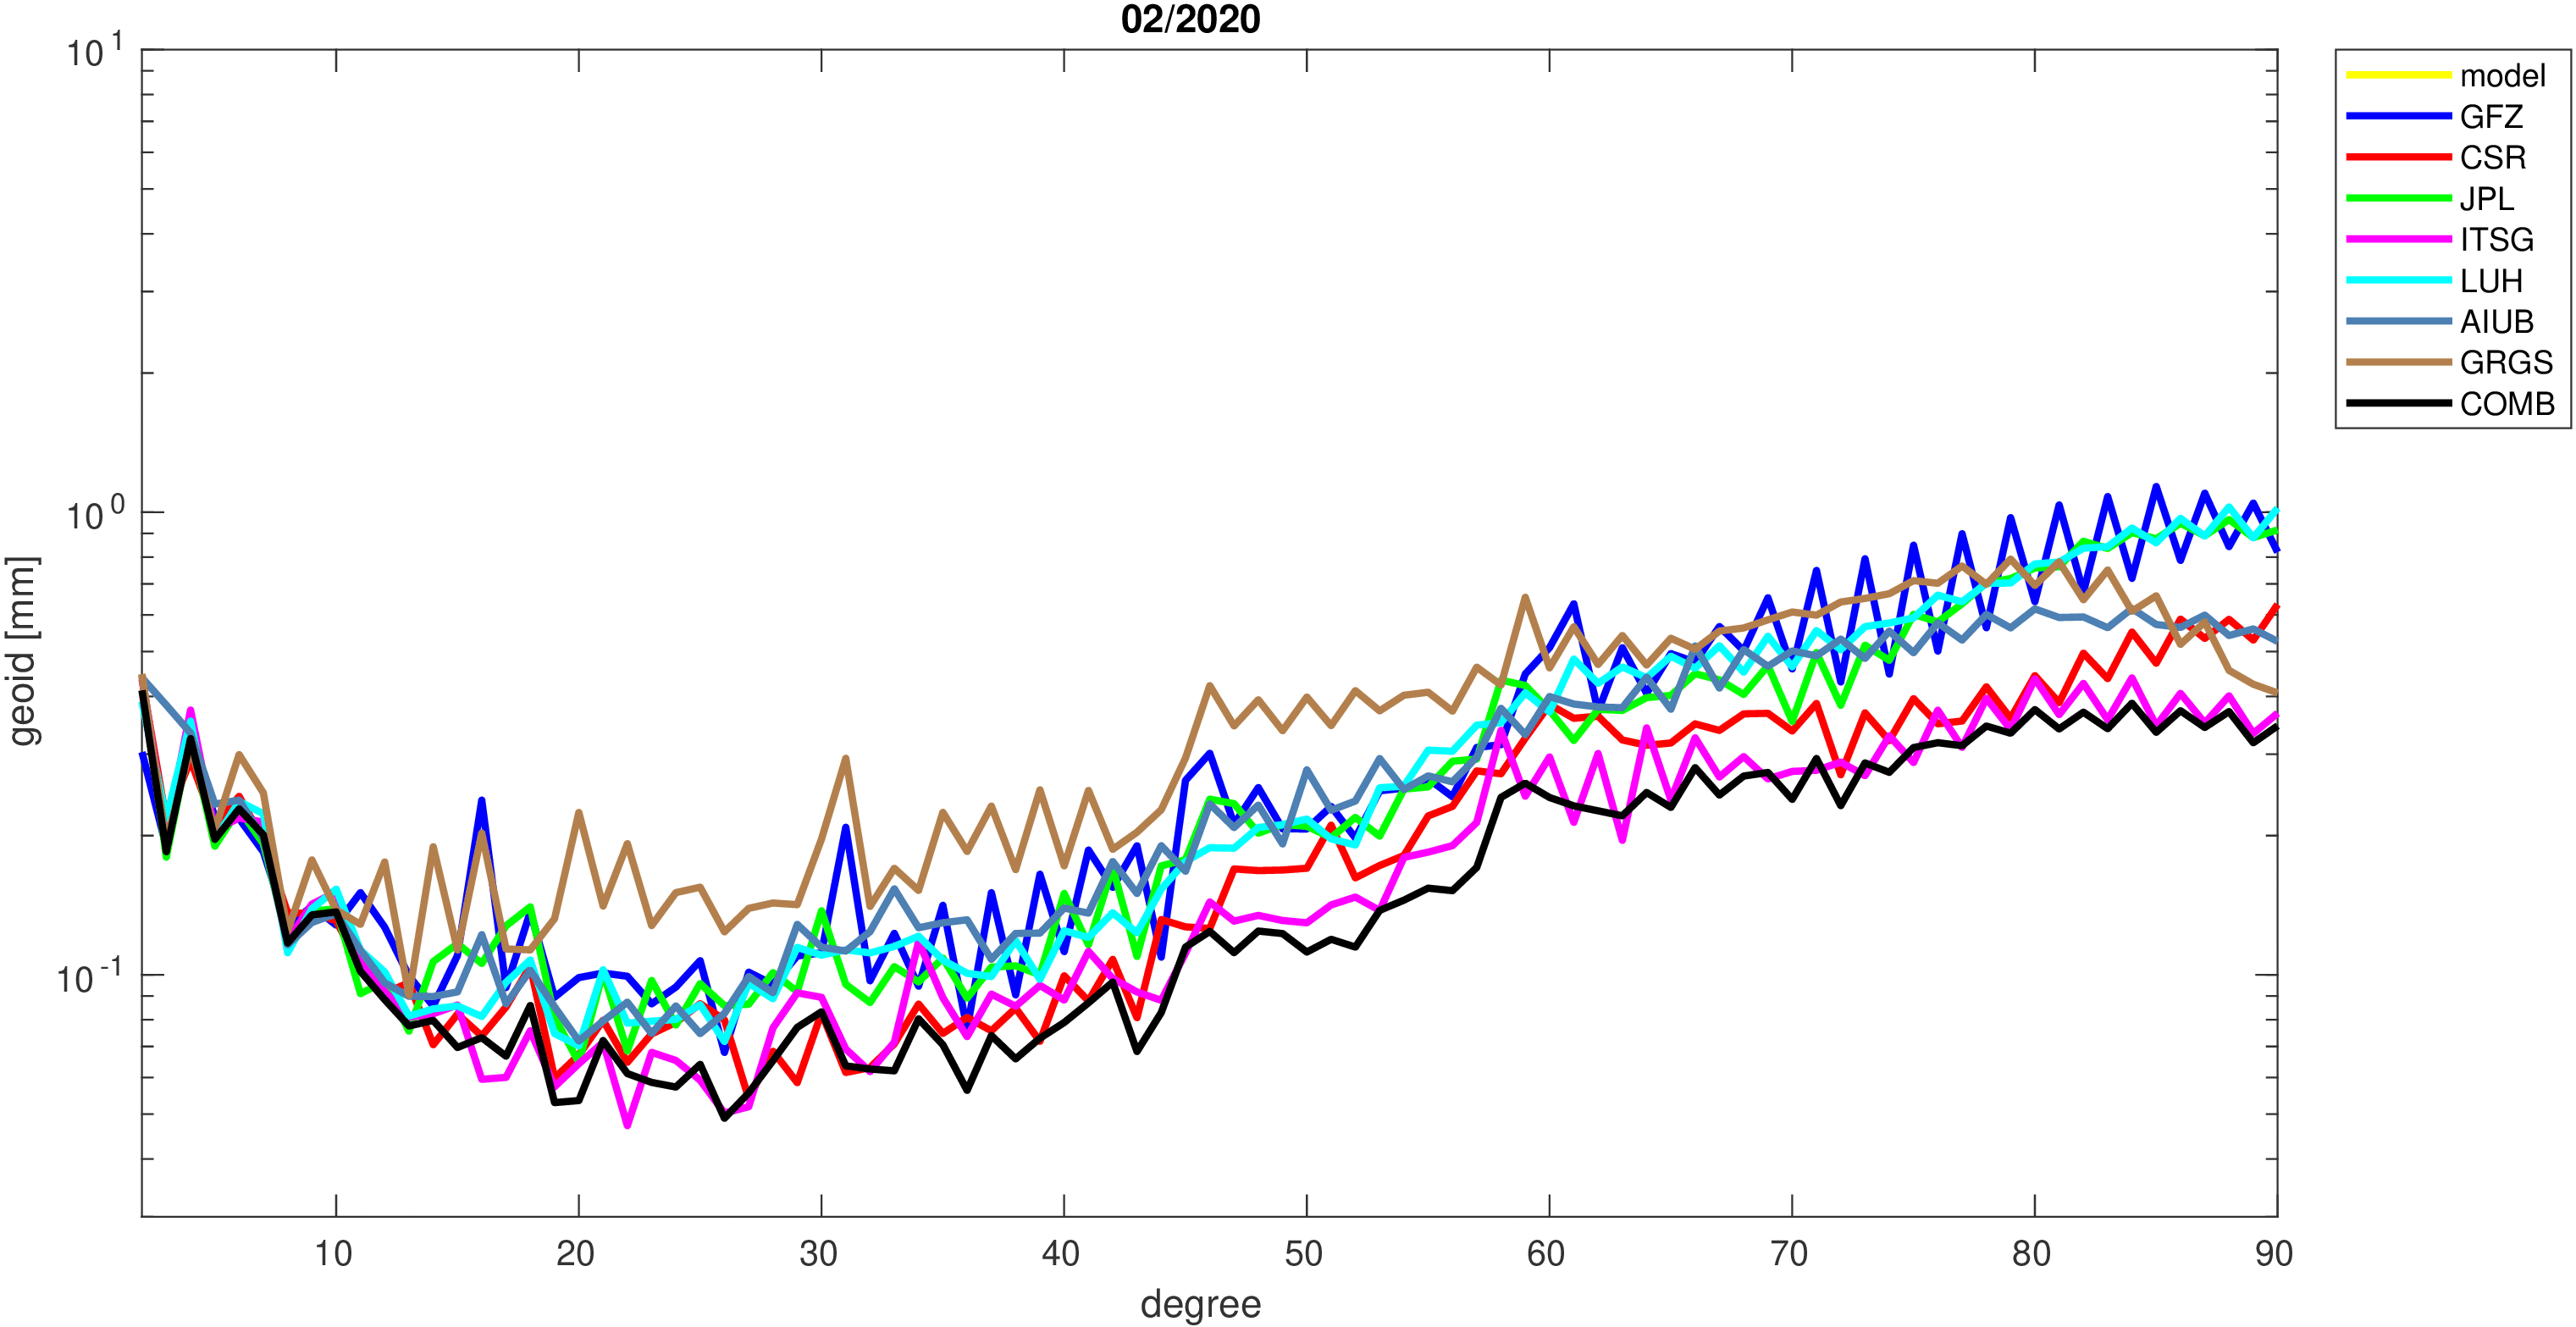
|

|
| 03/2020 |

|

|
| 04/2020 |

|

|
| 05/2020 |
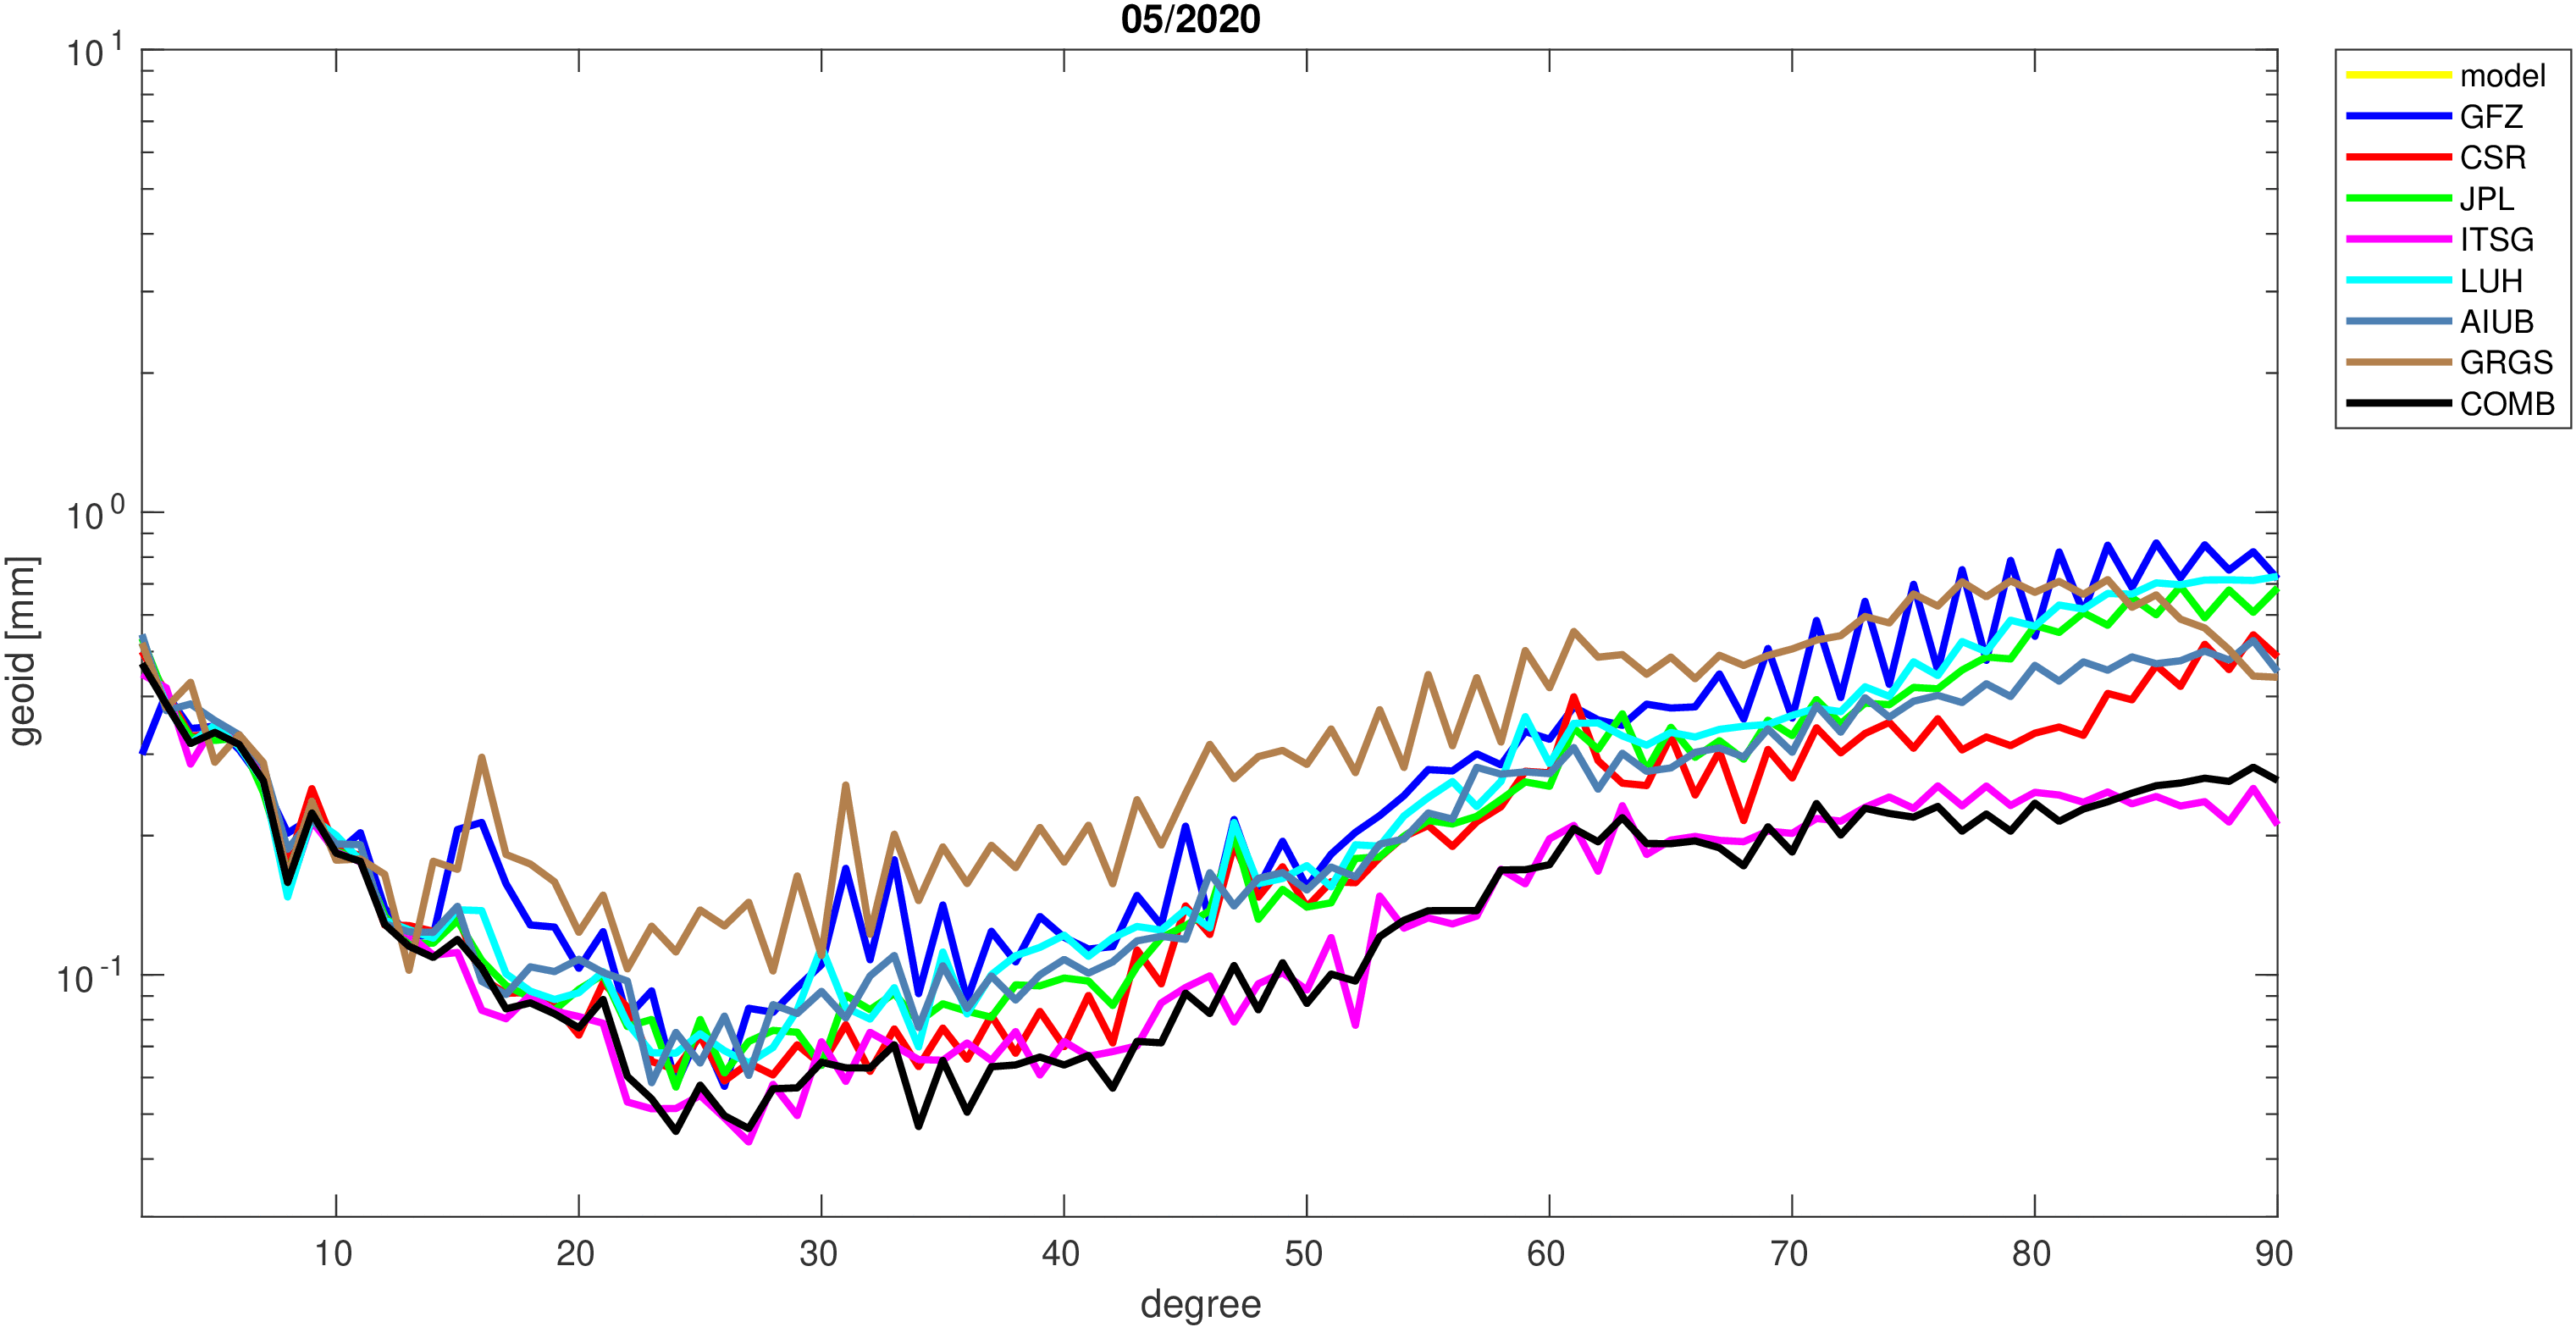
|

|
| 06/2020 |
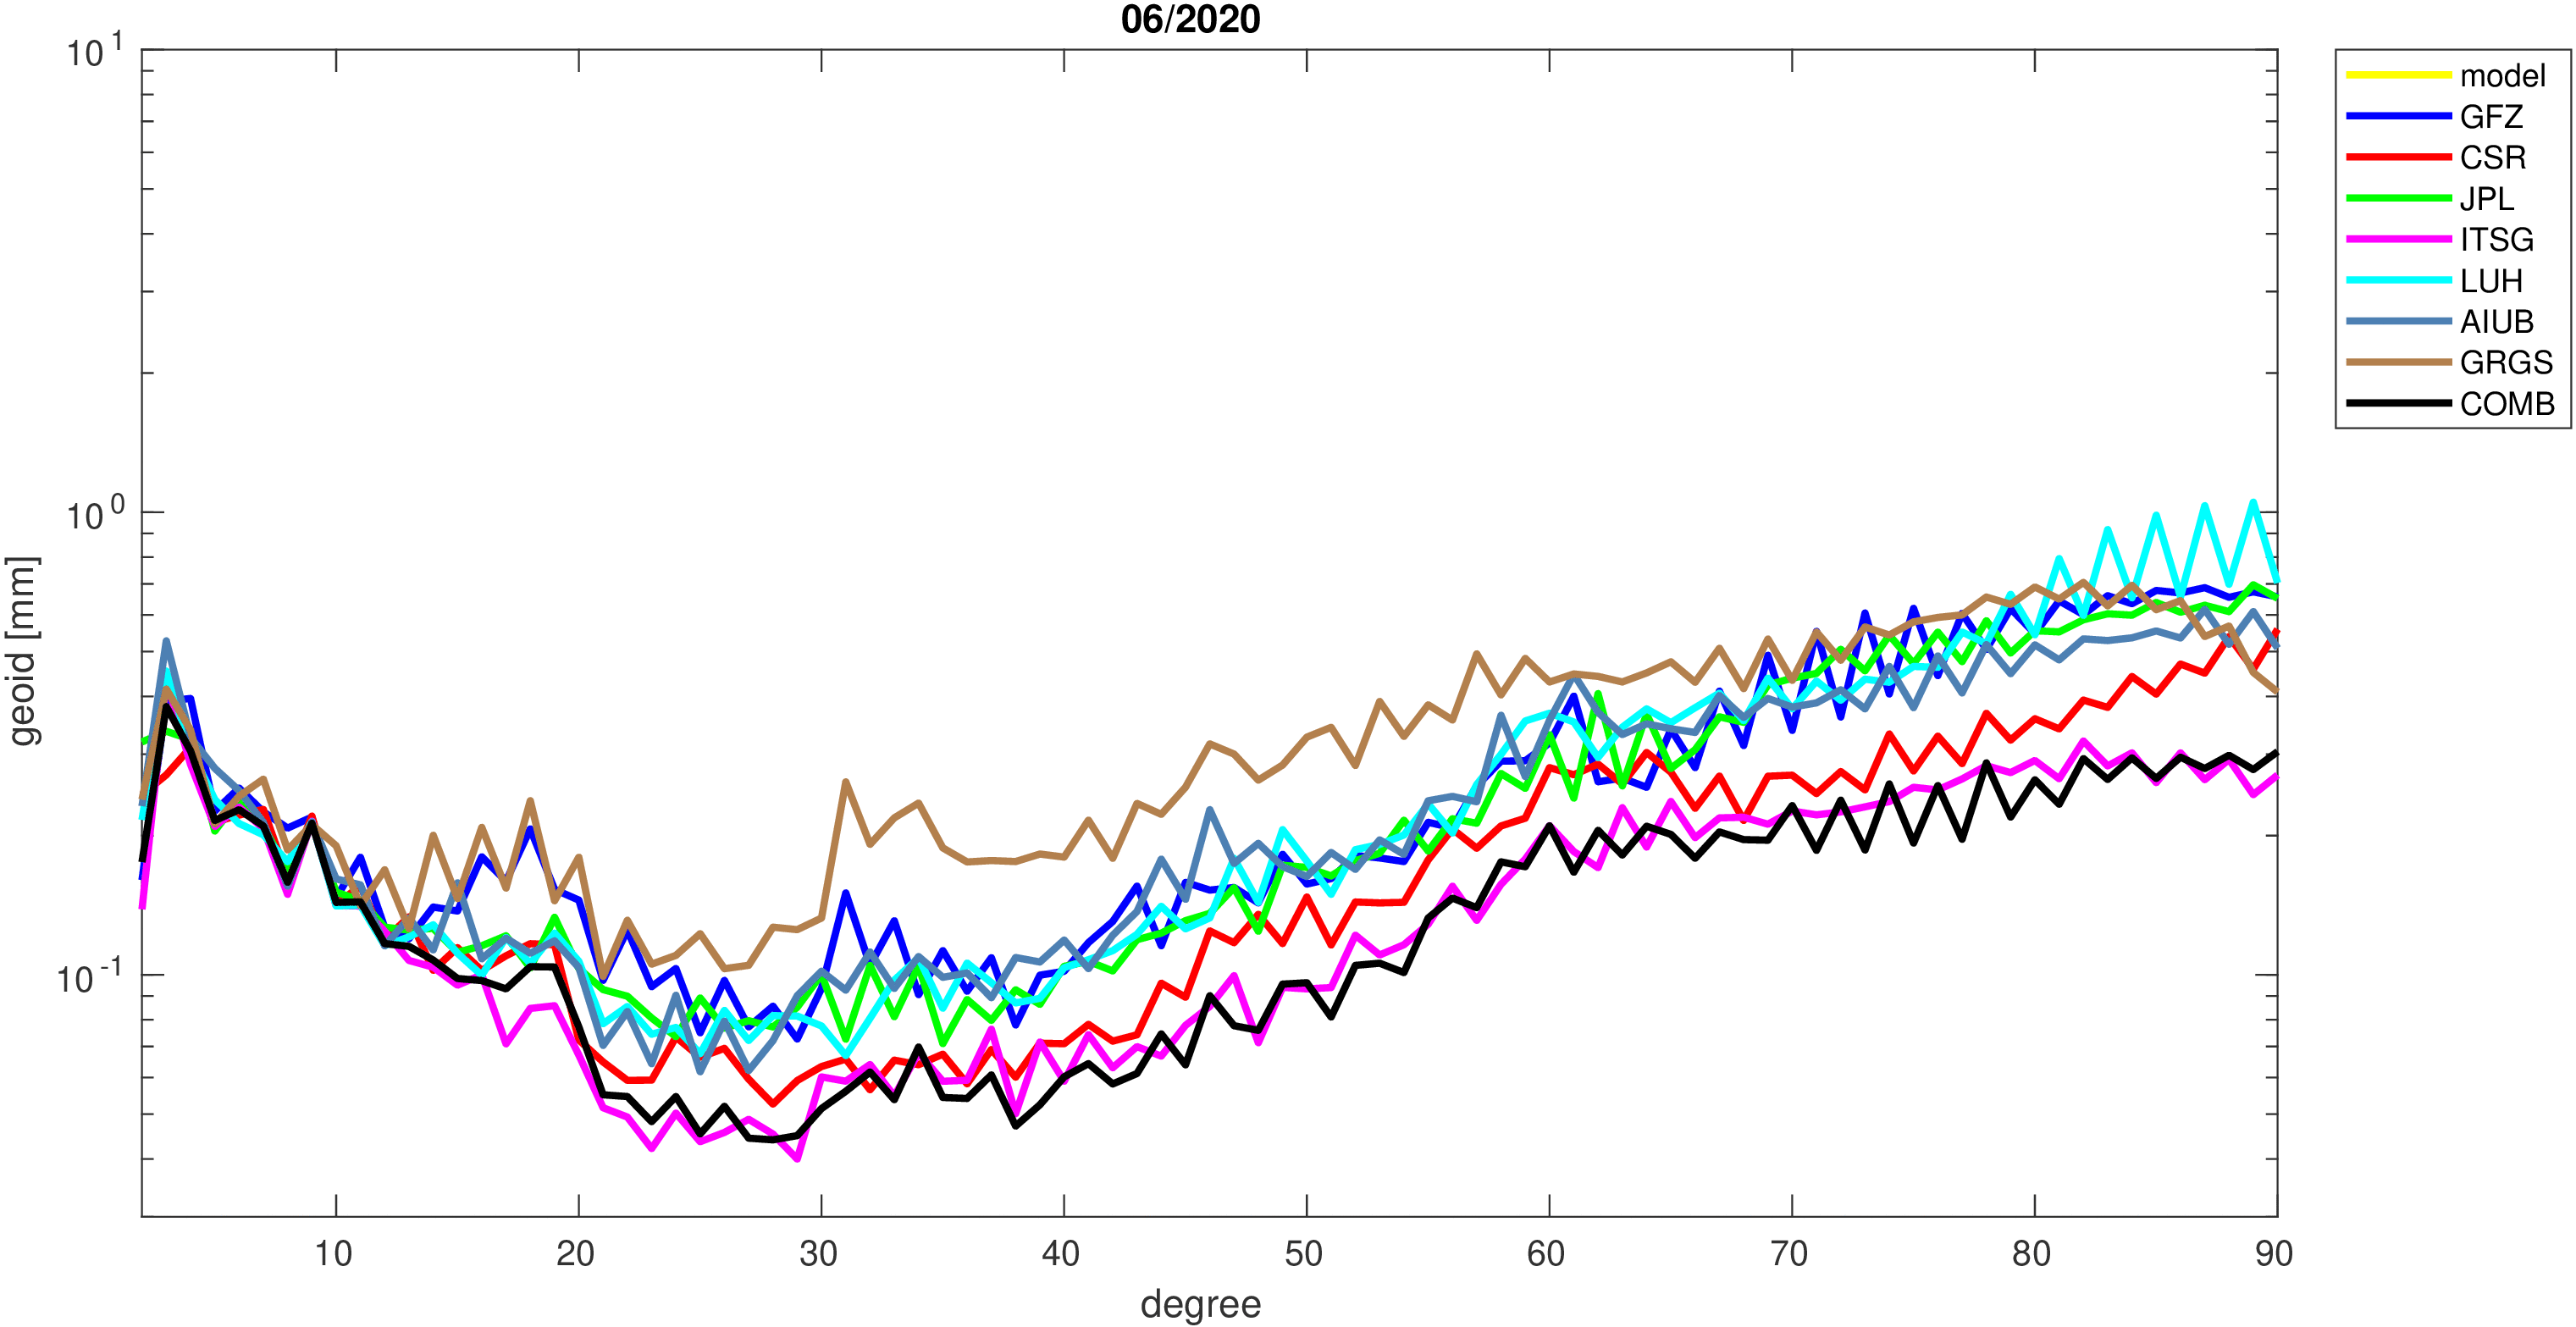
|

|
| 07/2020 |
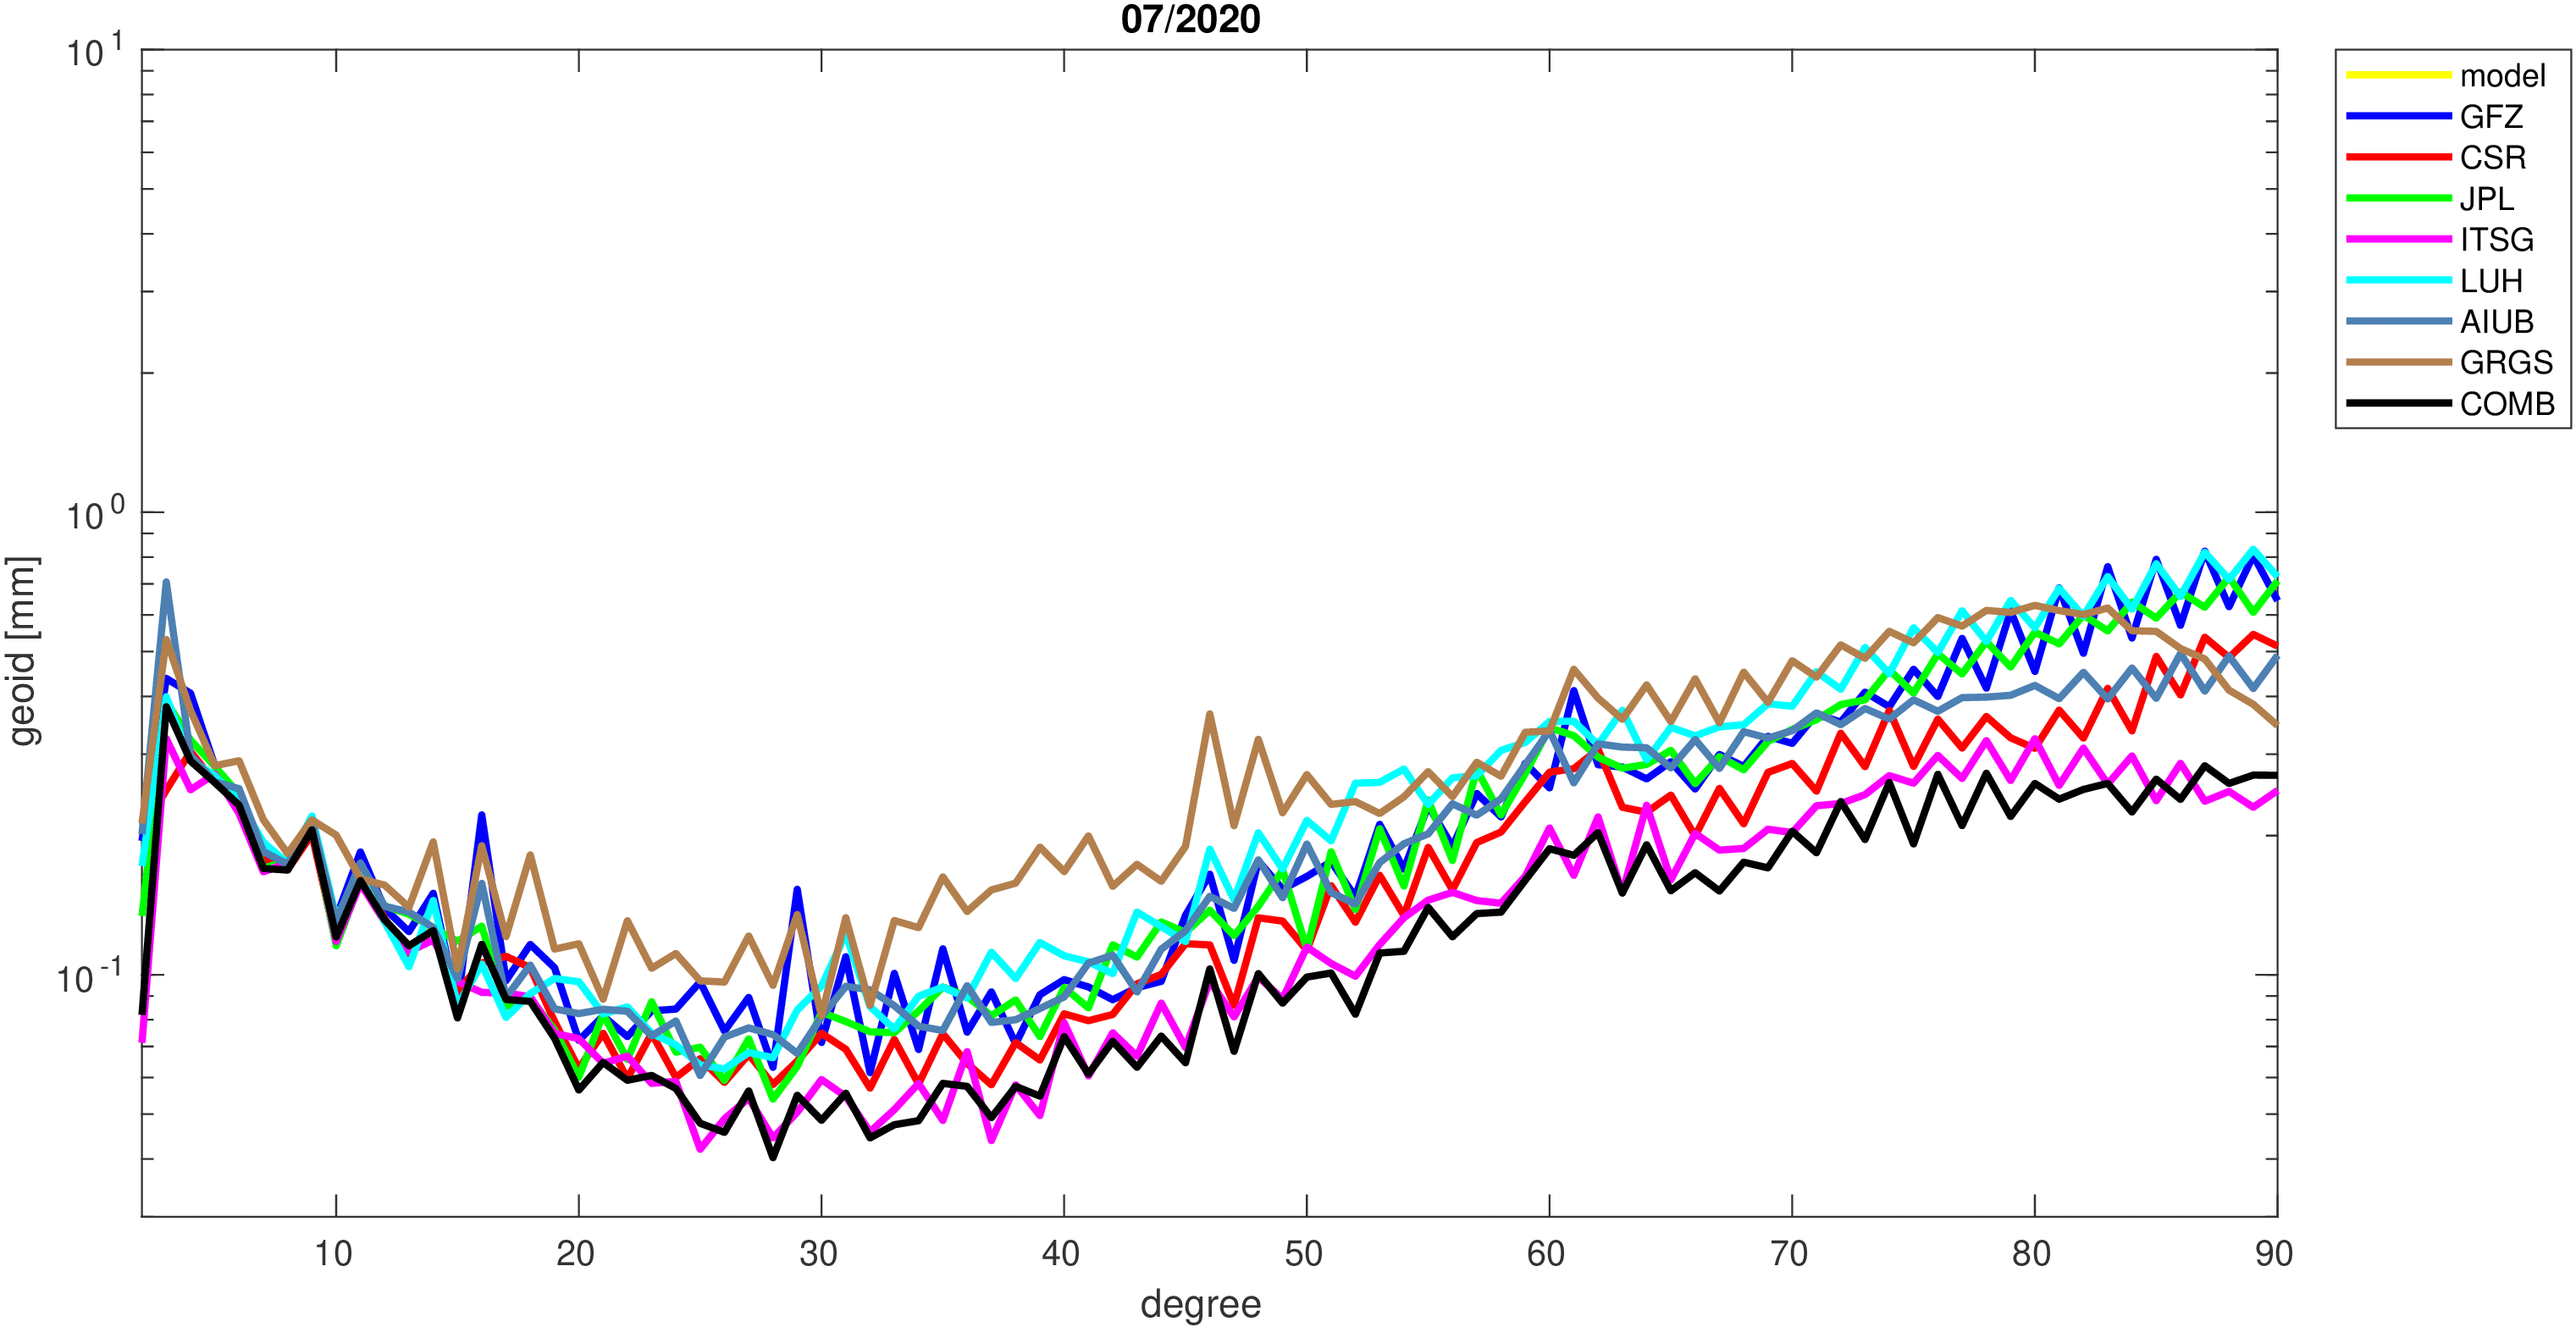
|

|
| 08/2020 |
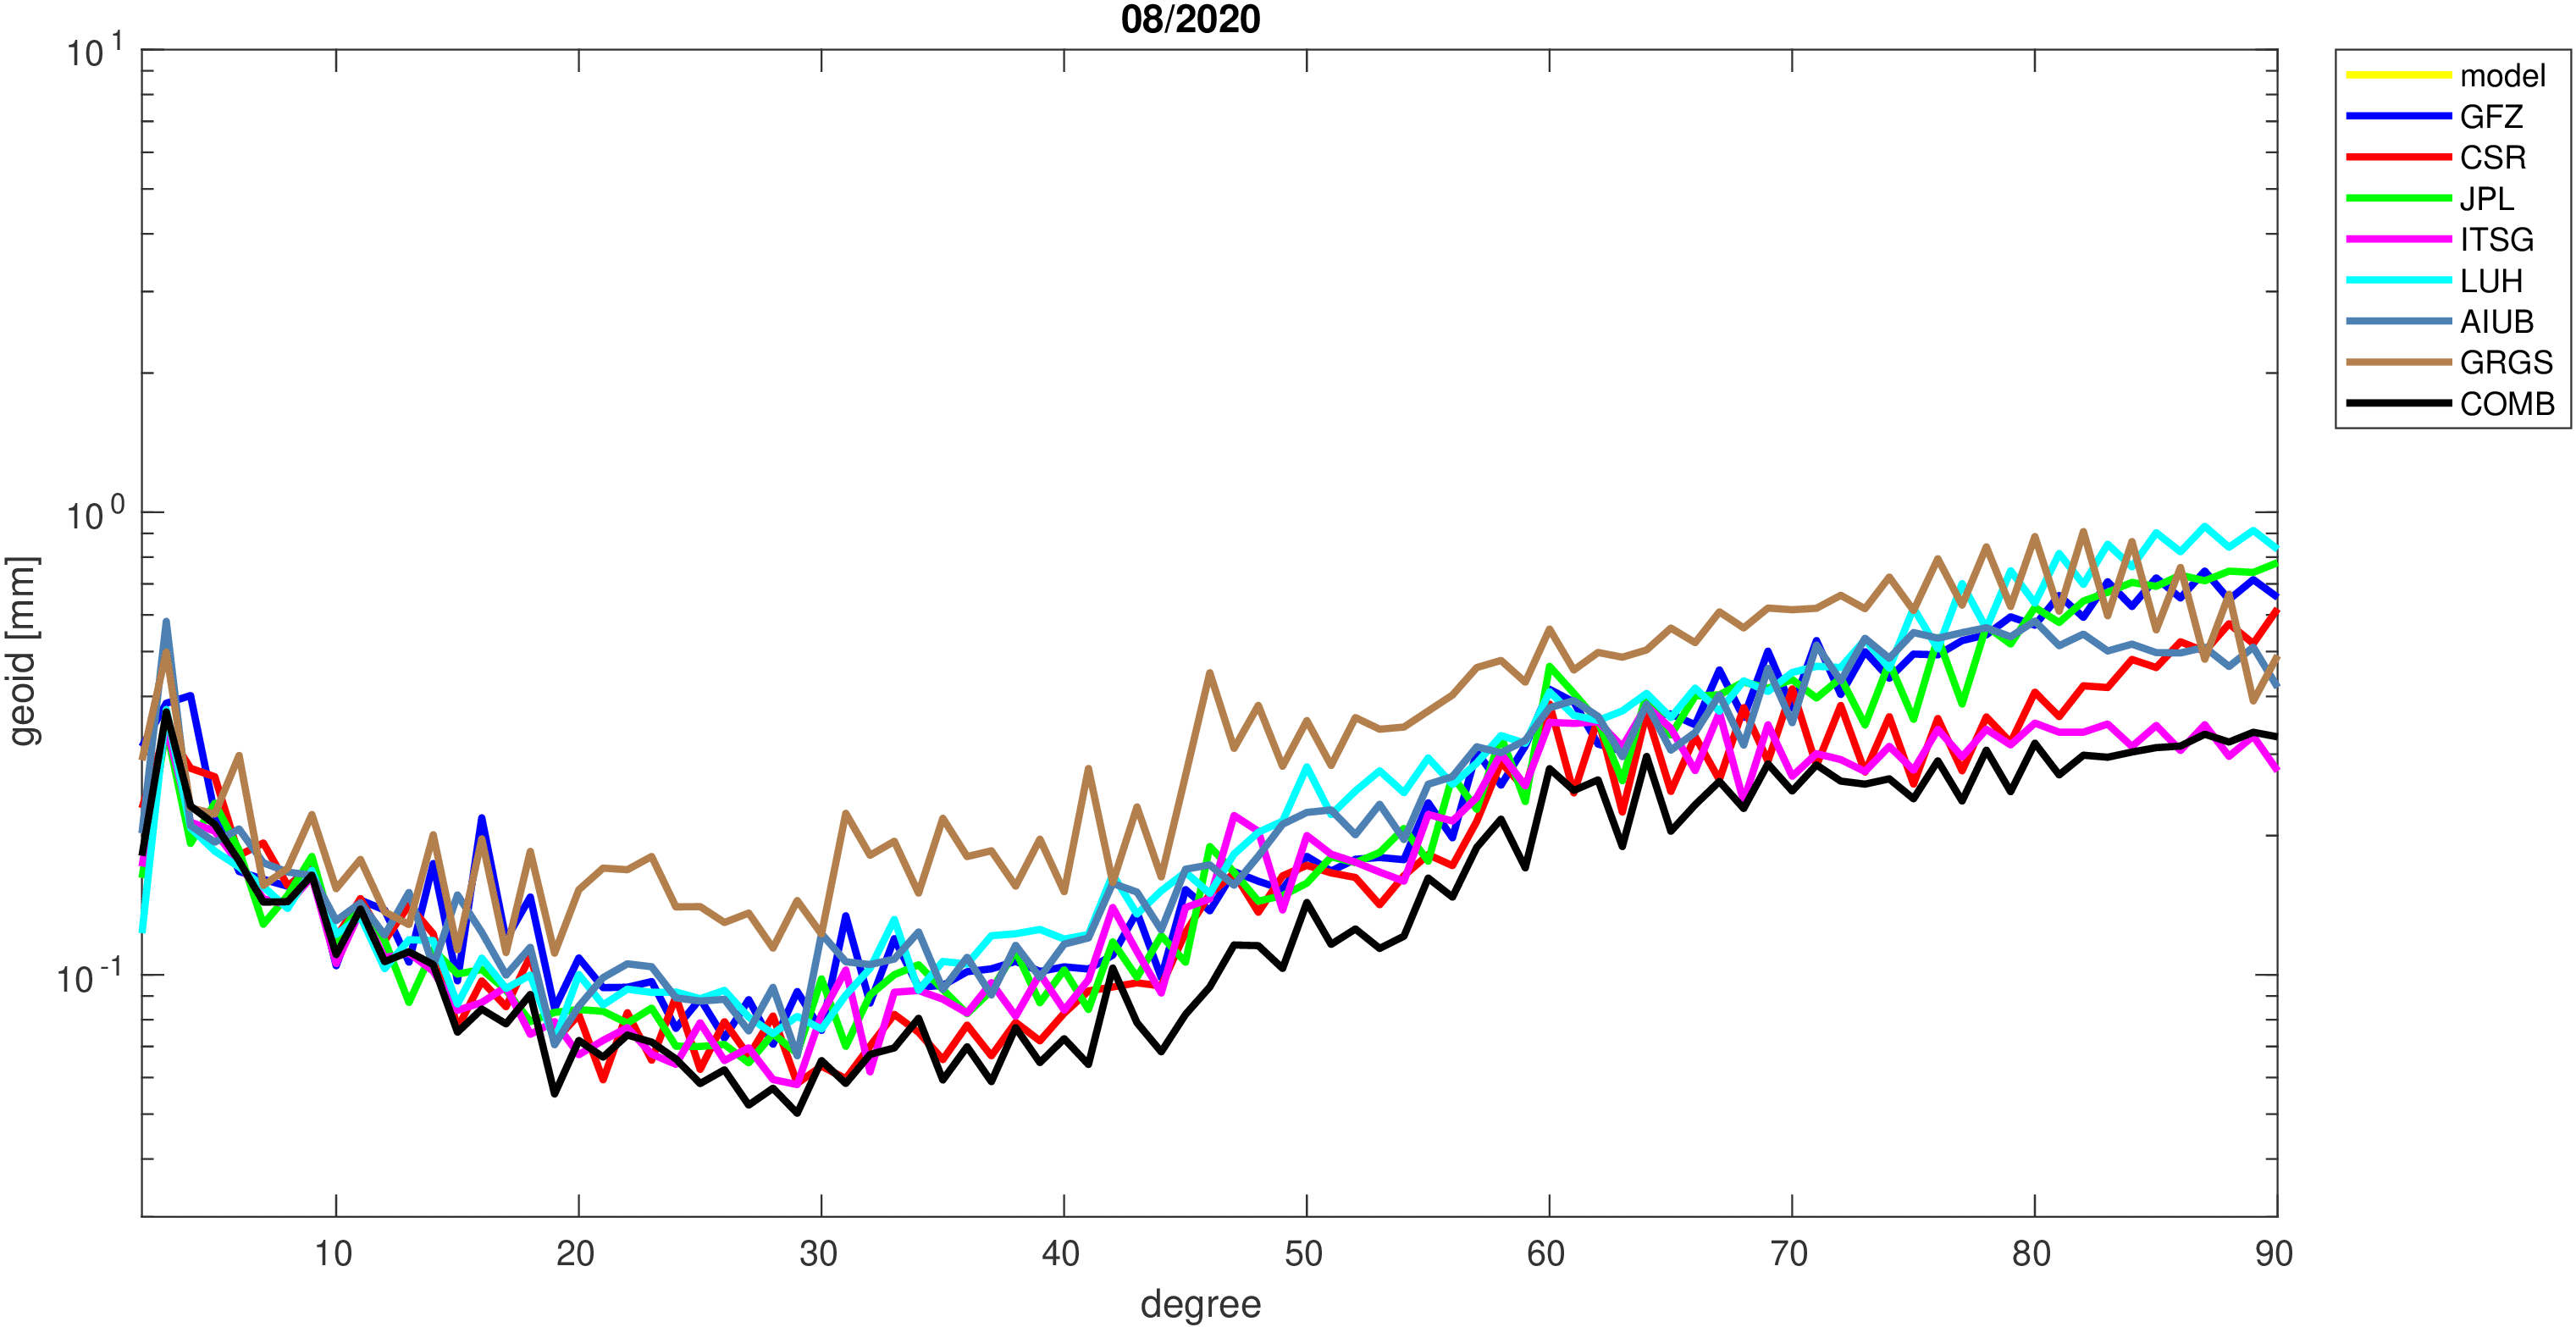
|
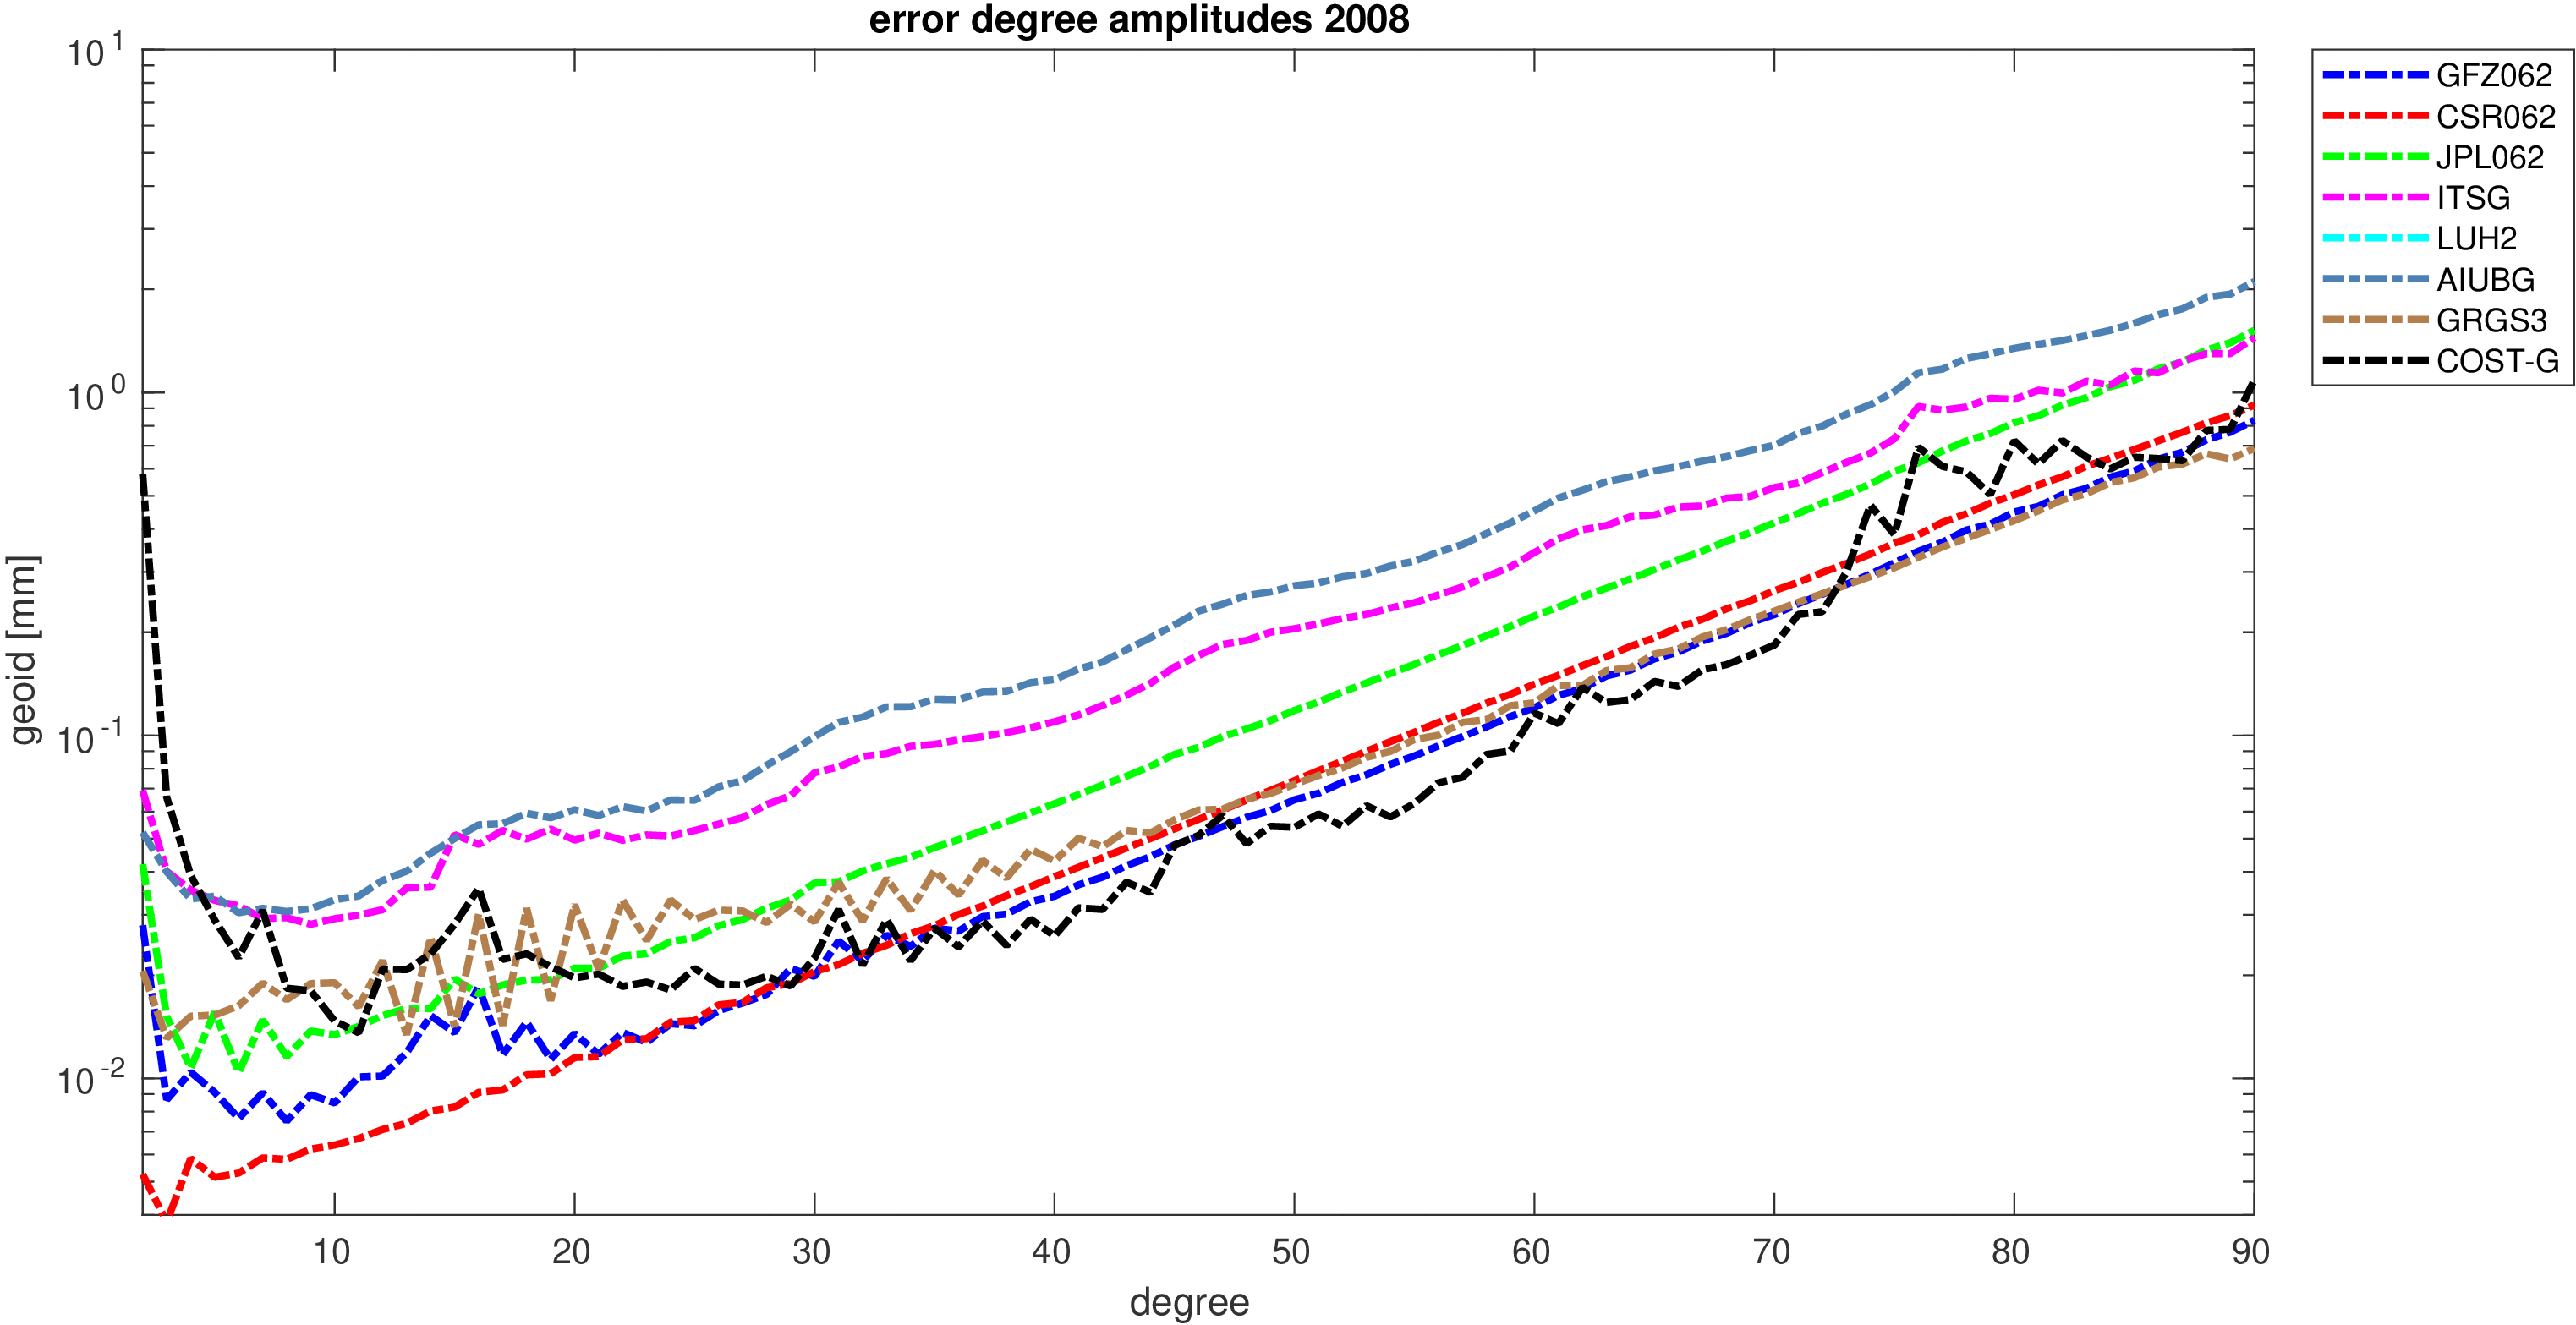
|
| 09/2020 |
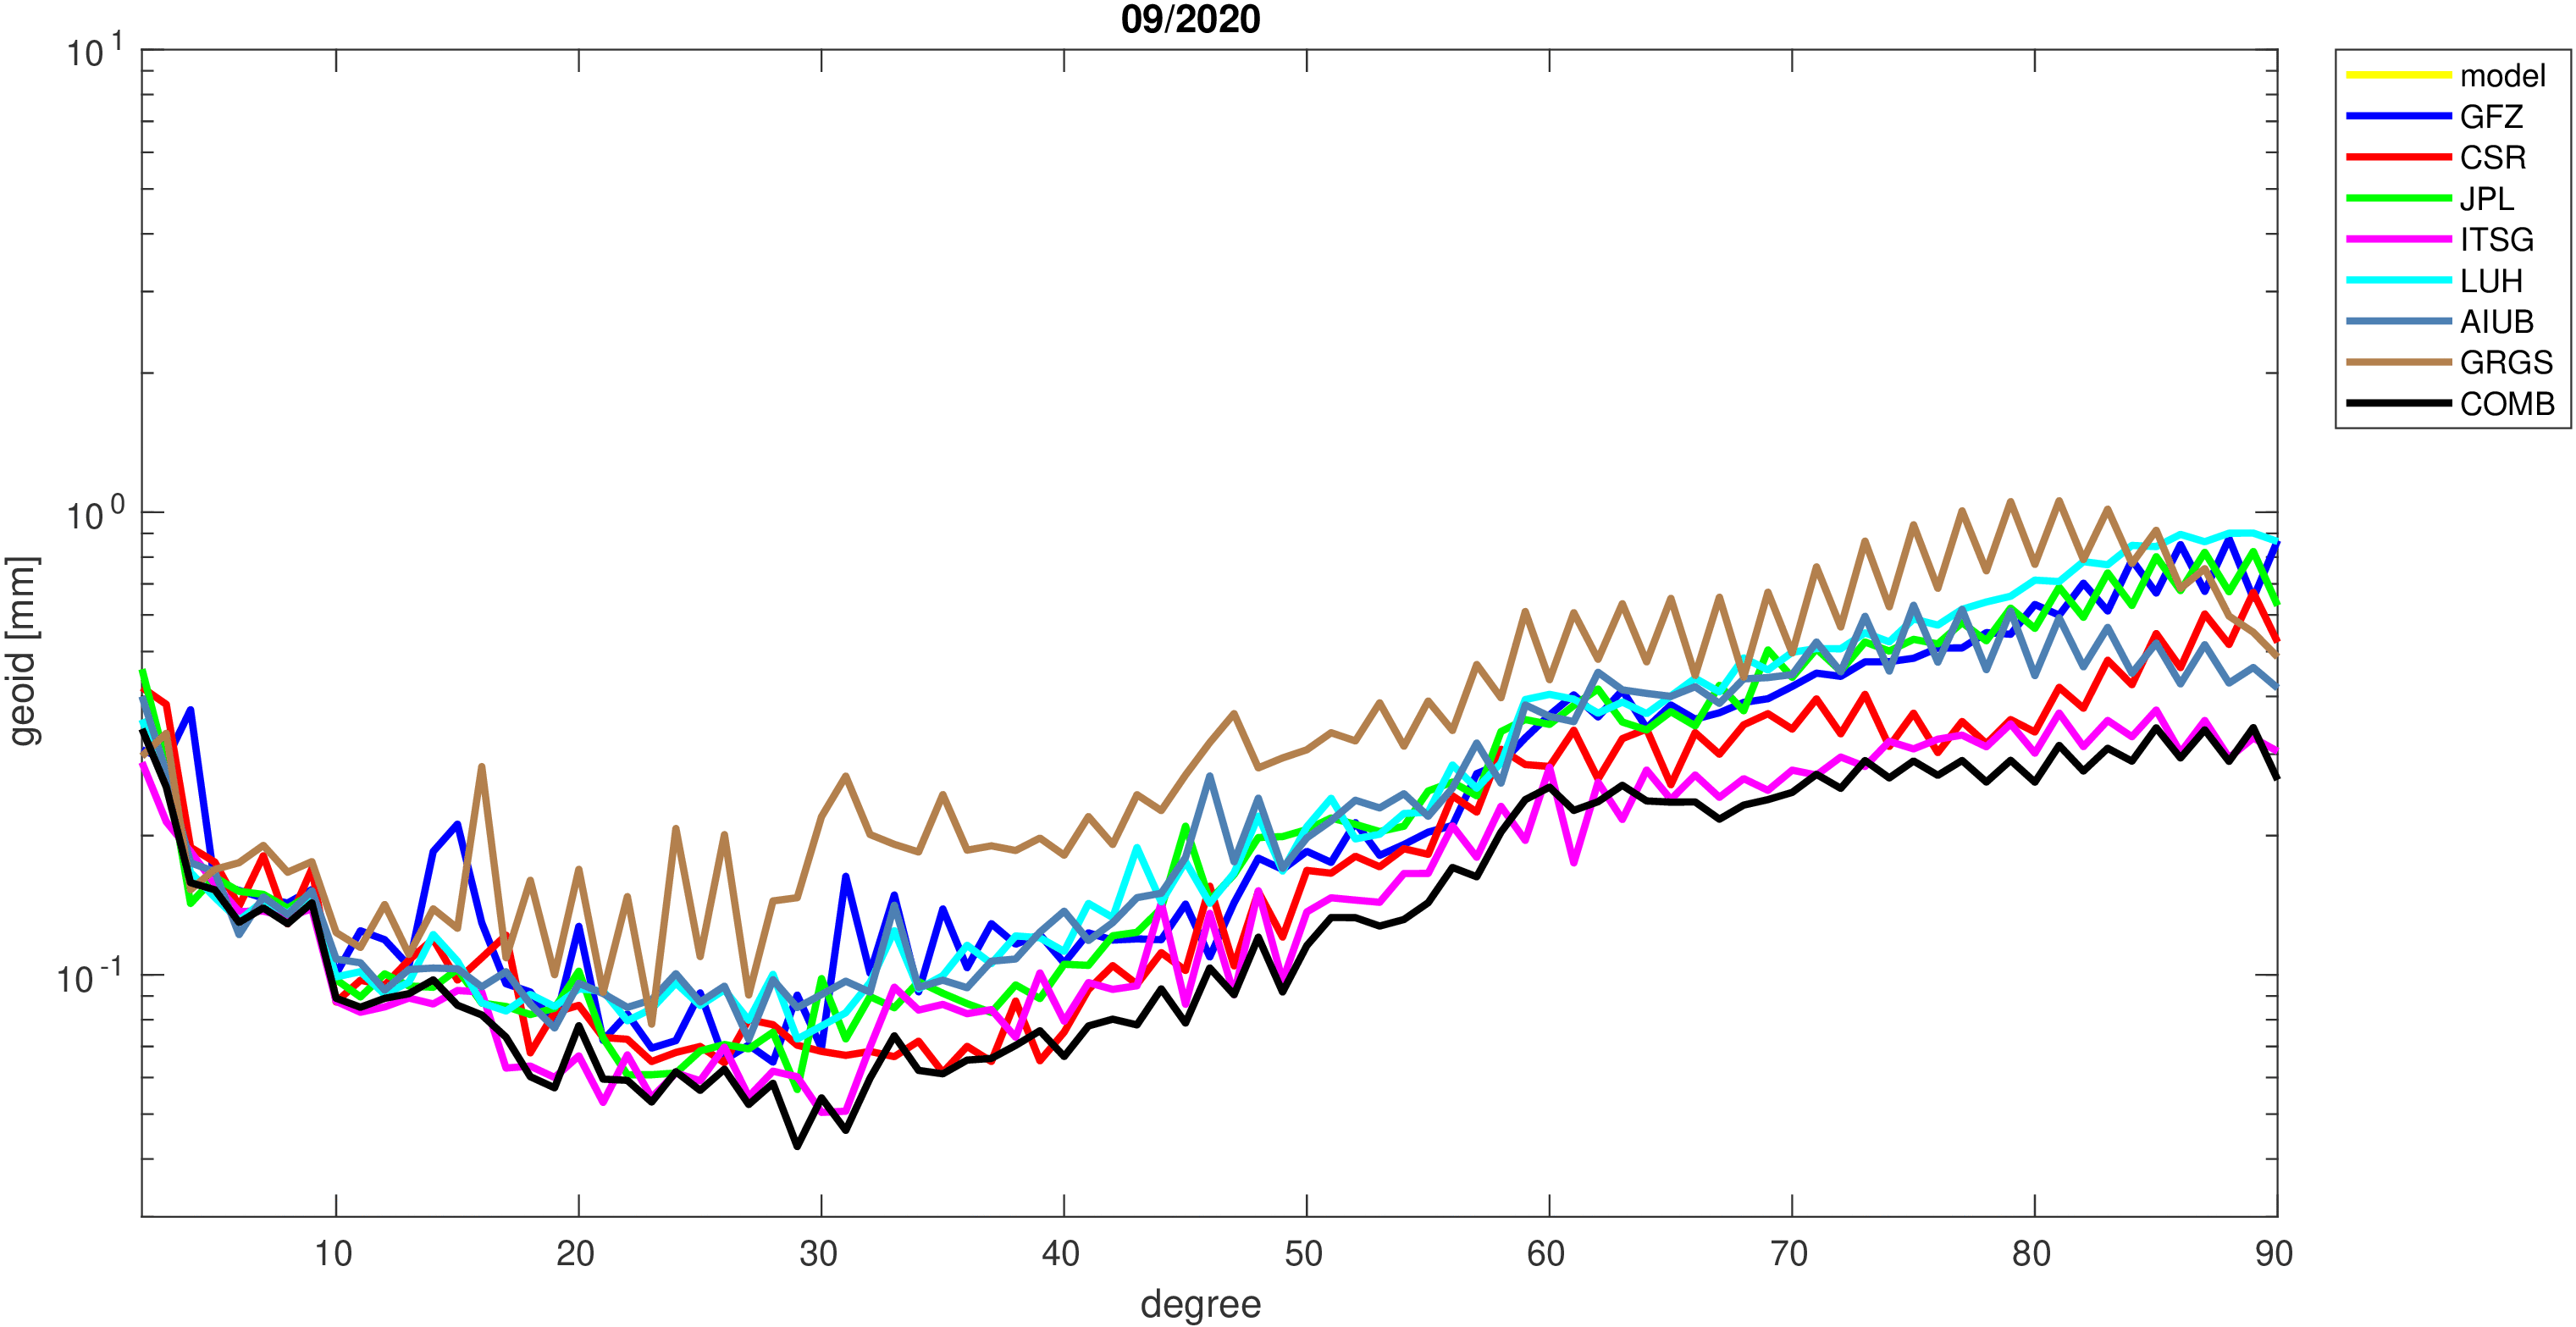
|
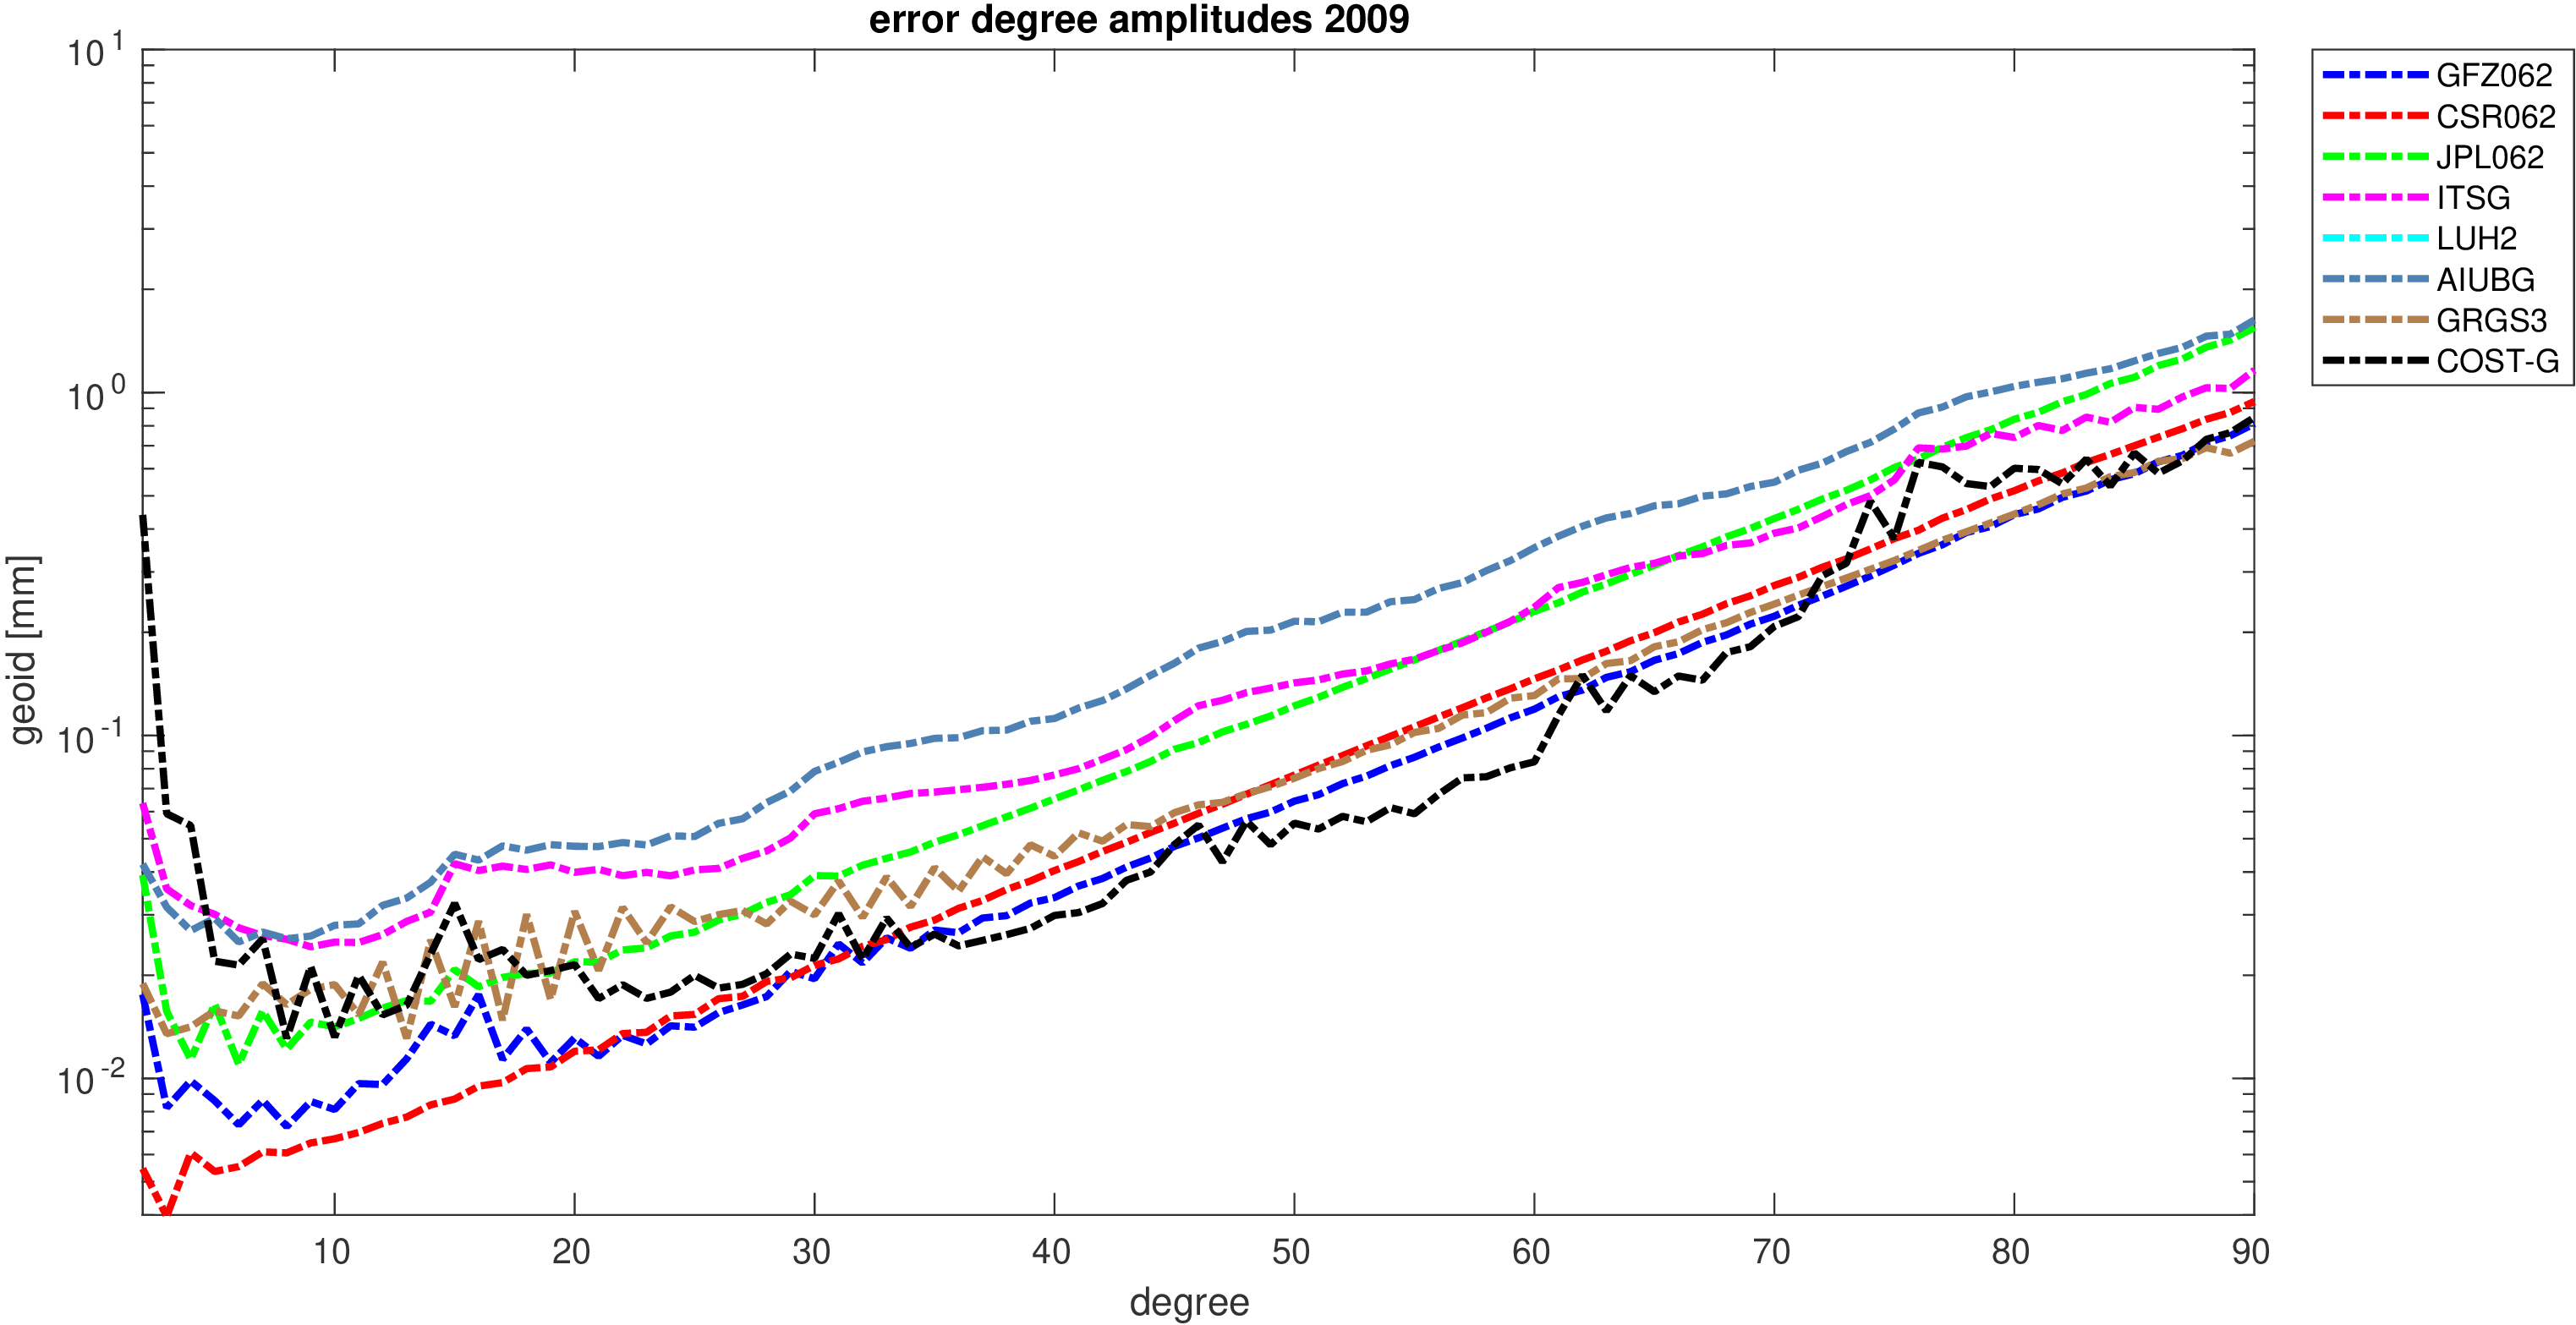
|
| 10/2020 |
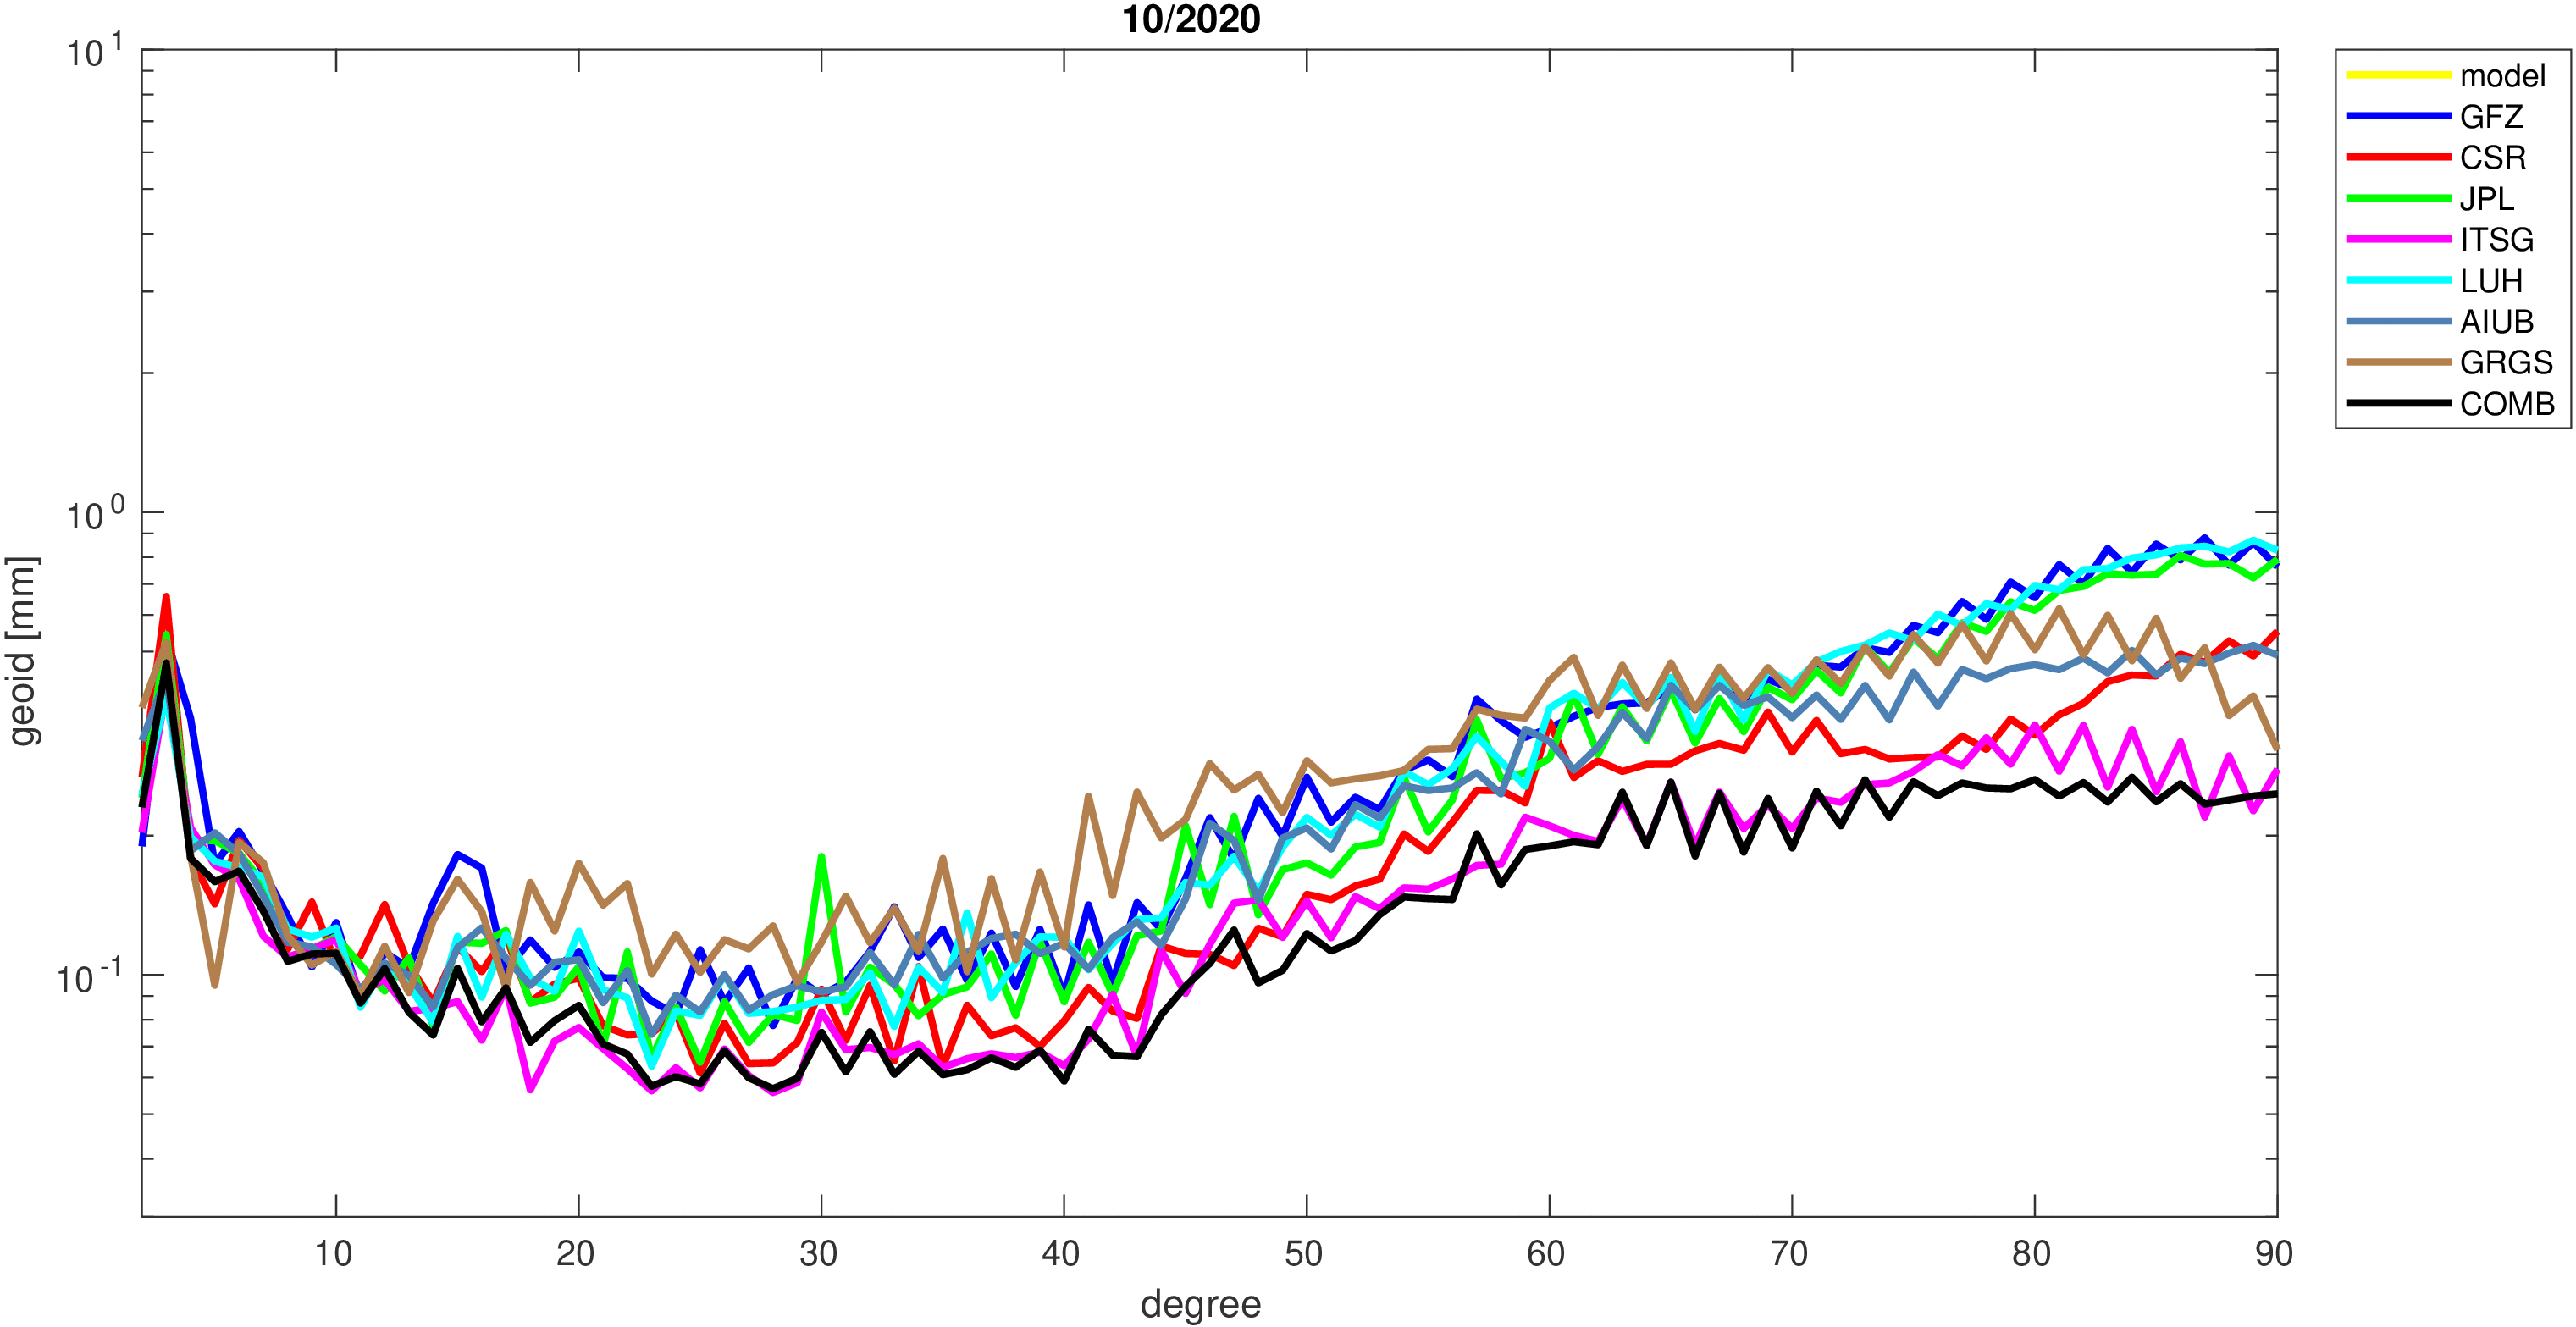
|
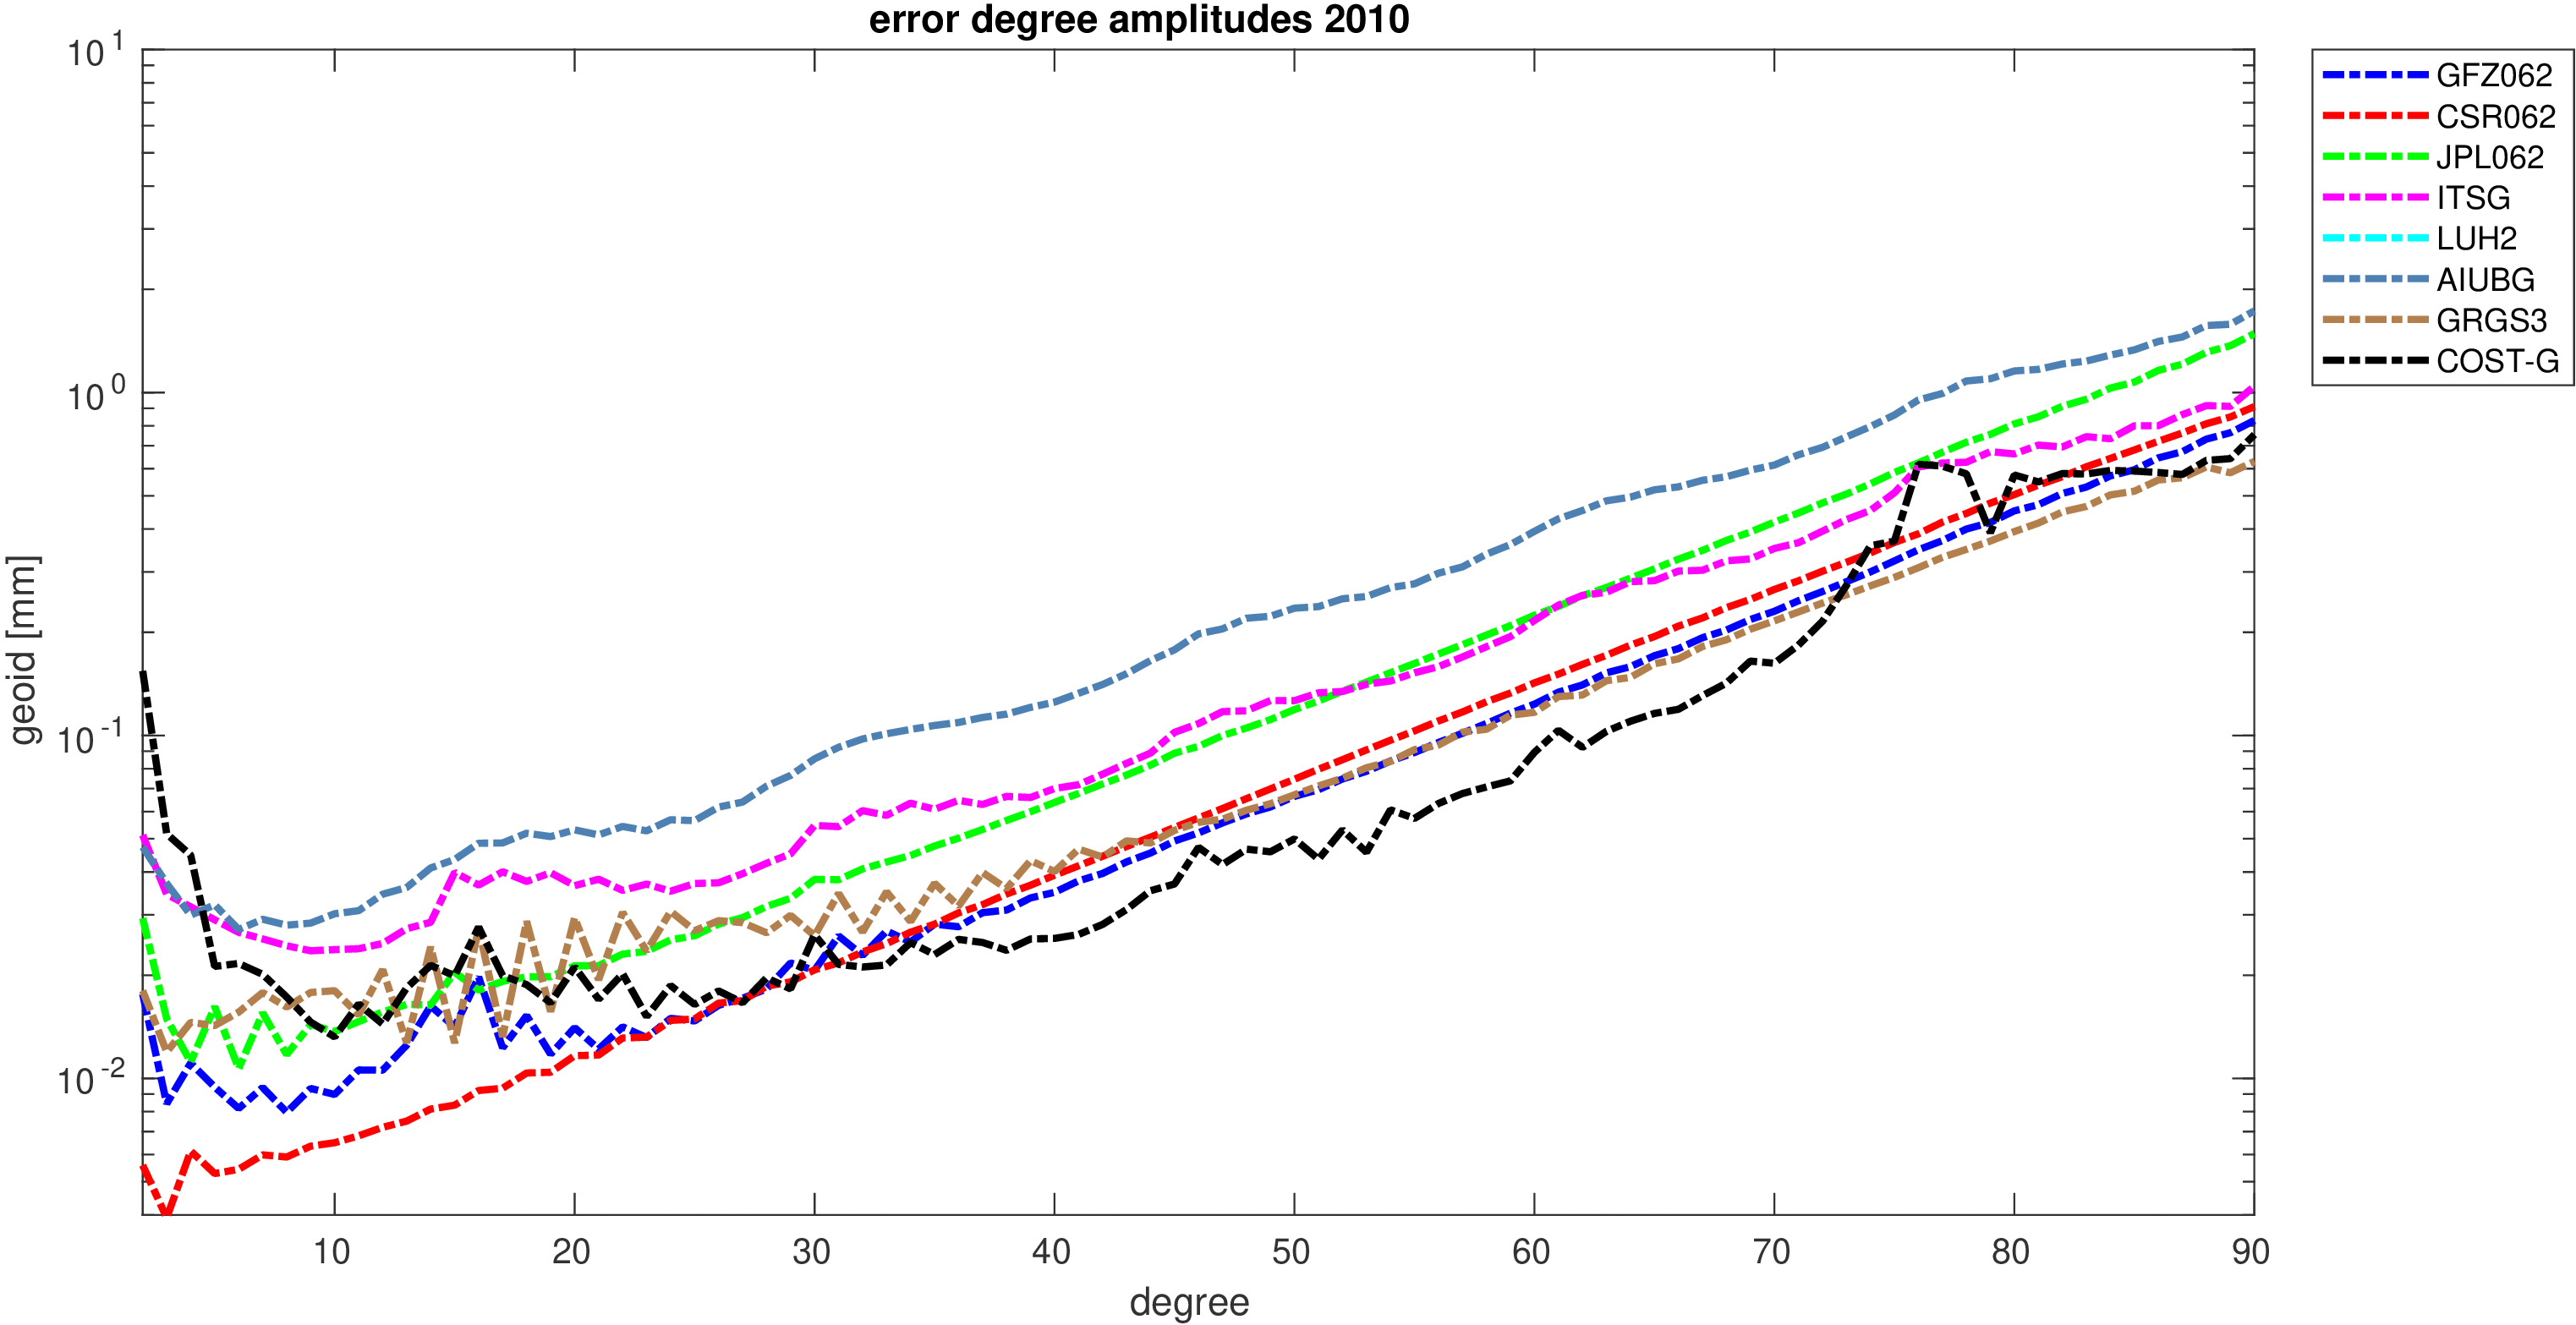
|
| 11/2020 |
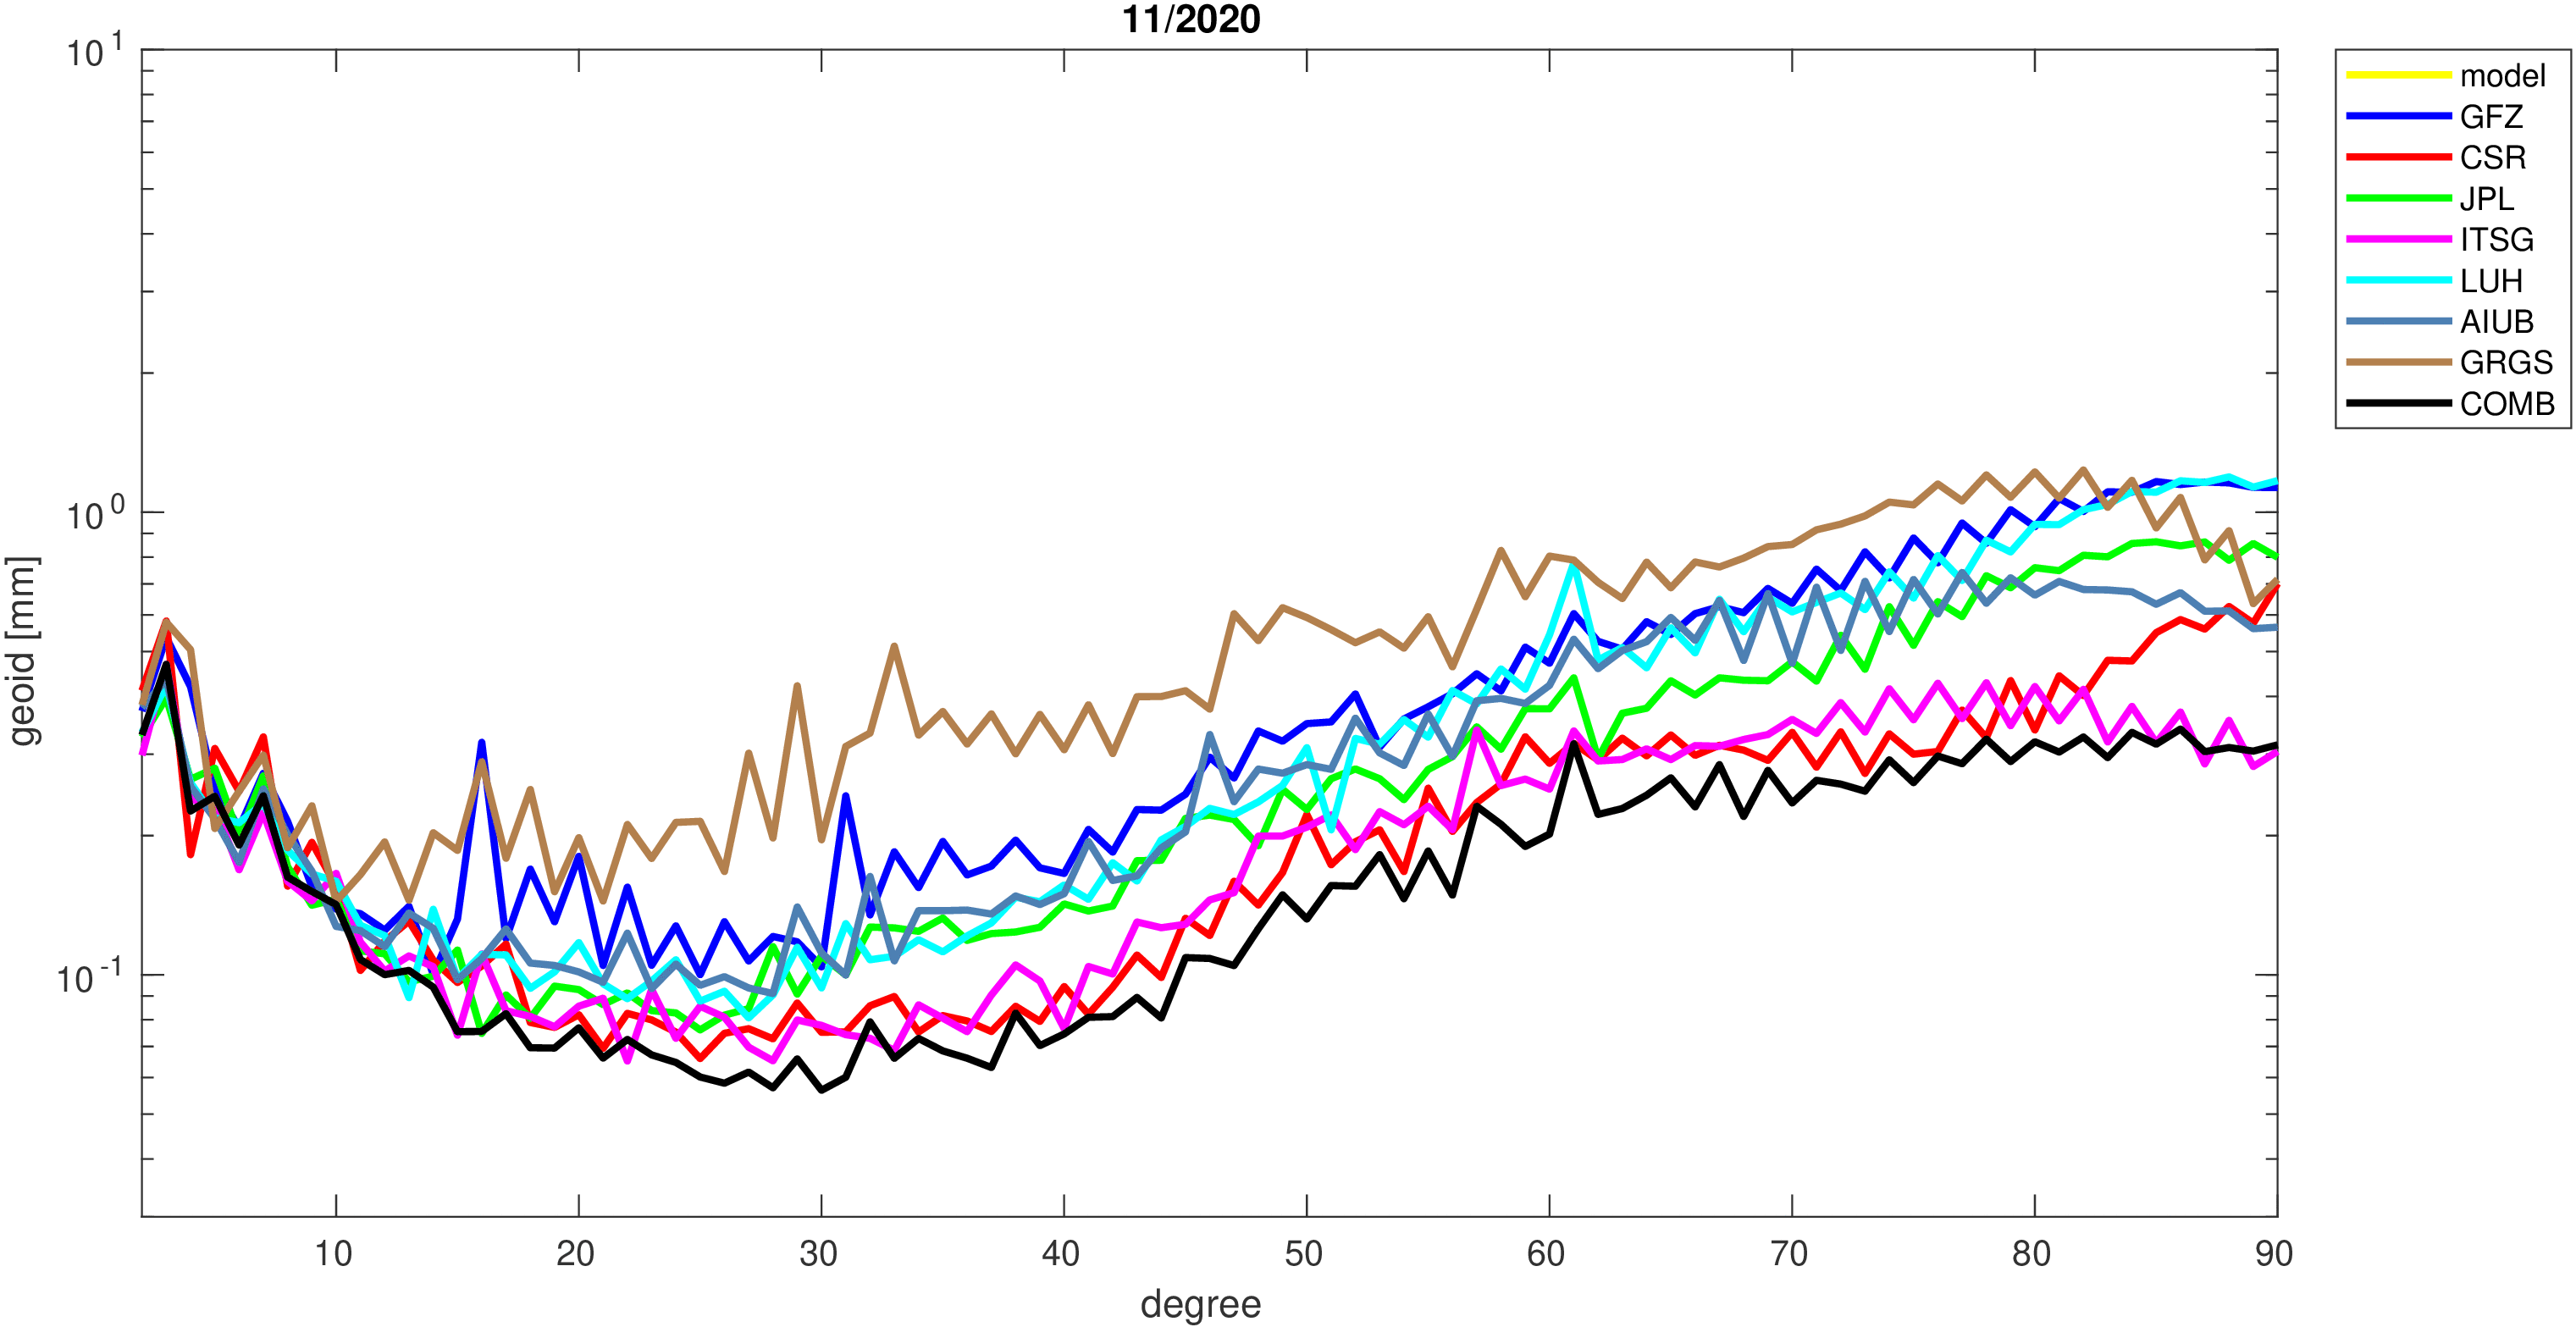
|

|
| 12/2020 |
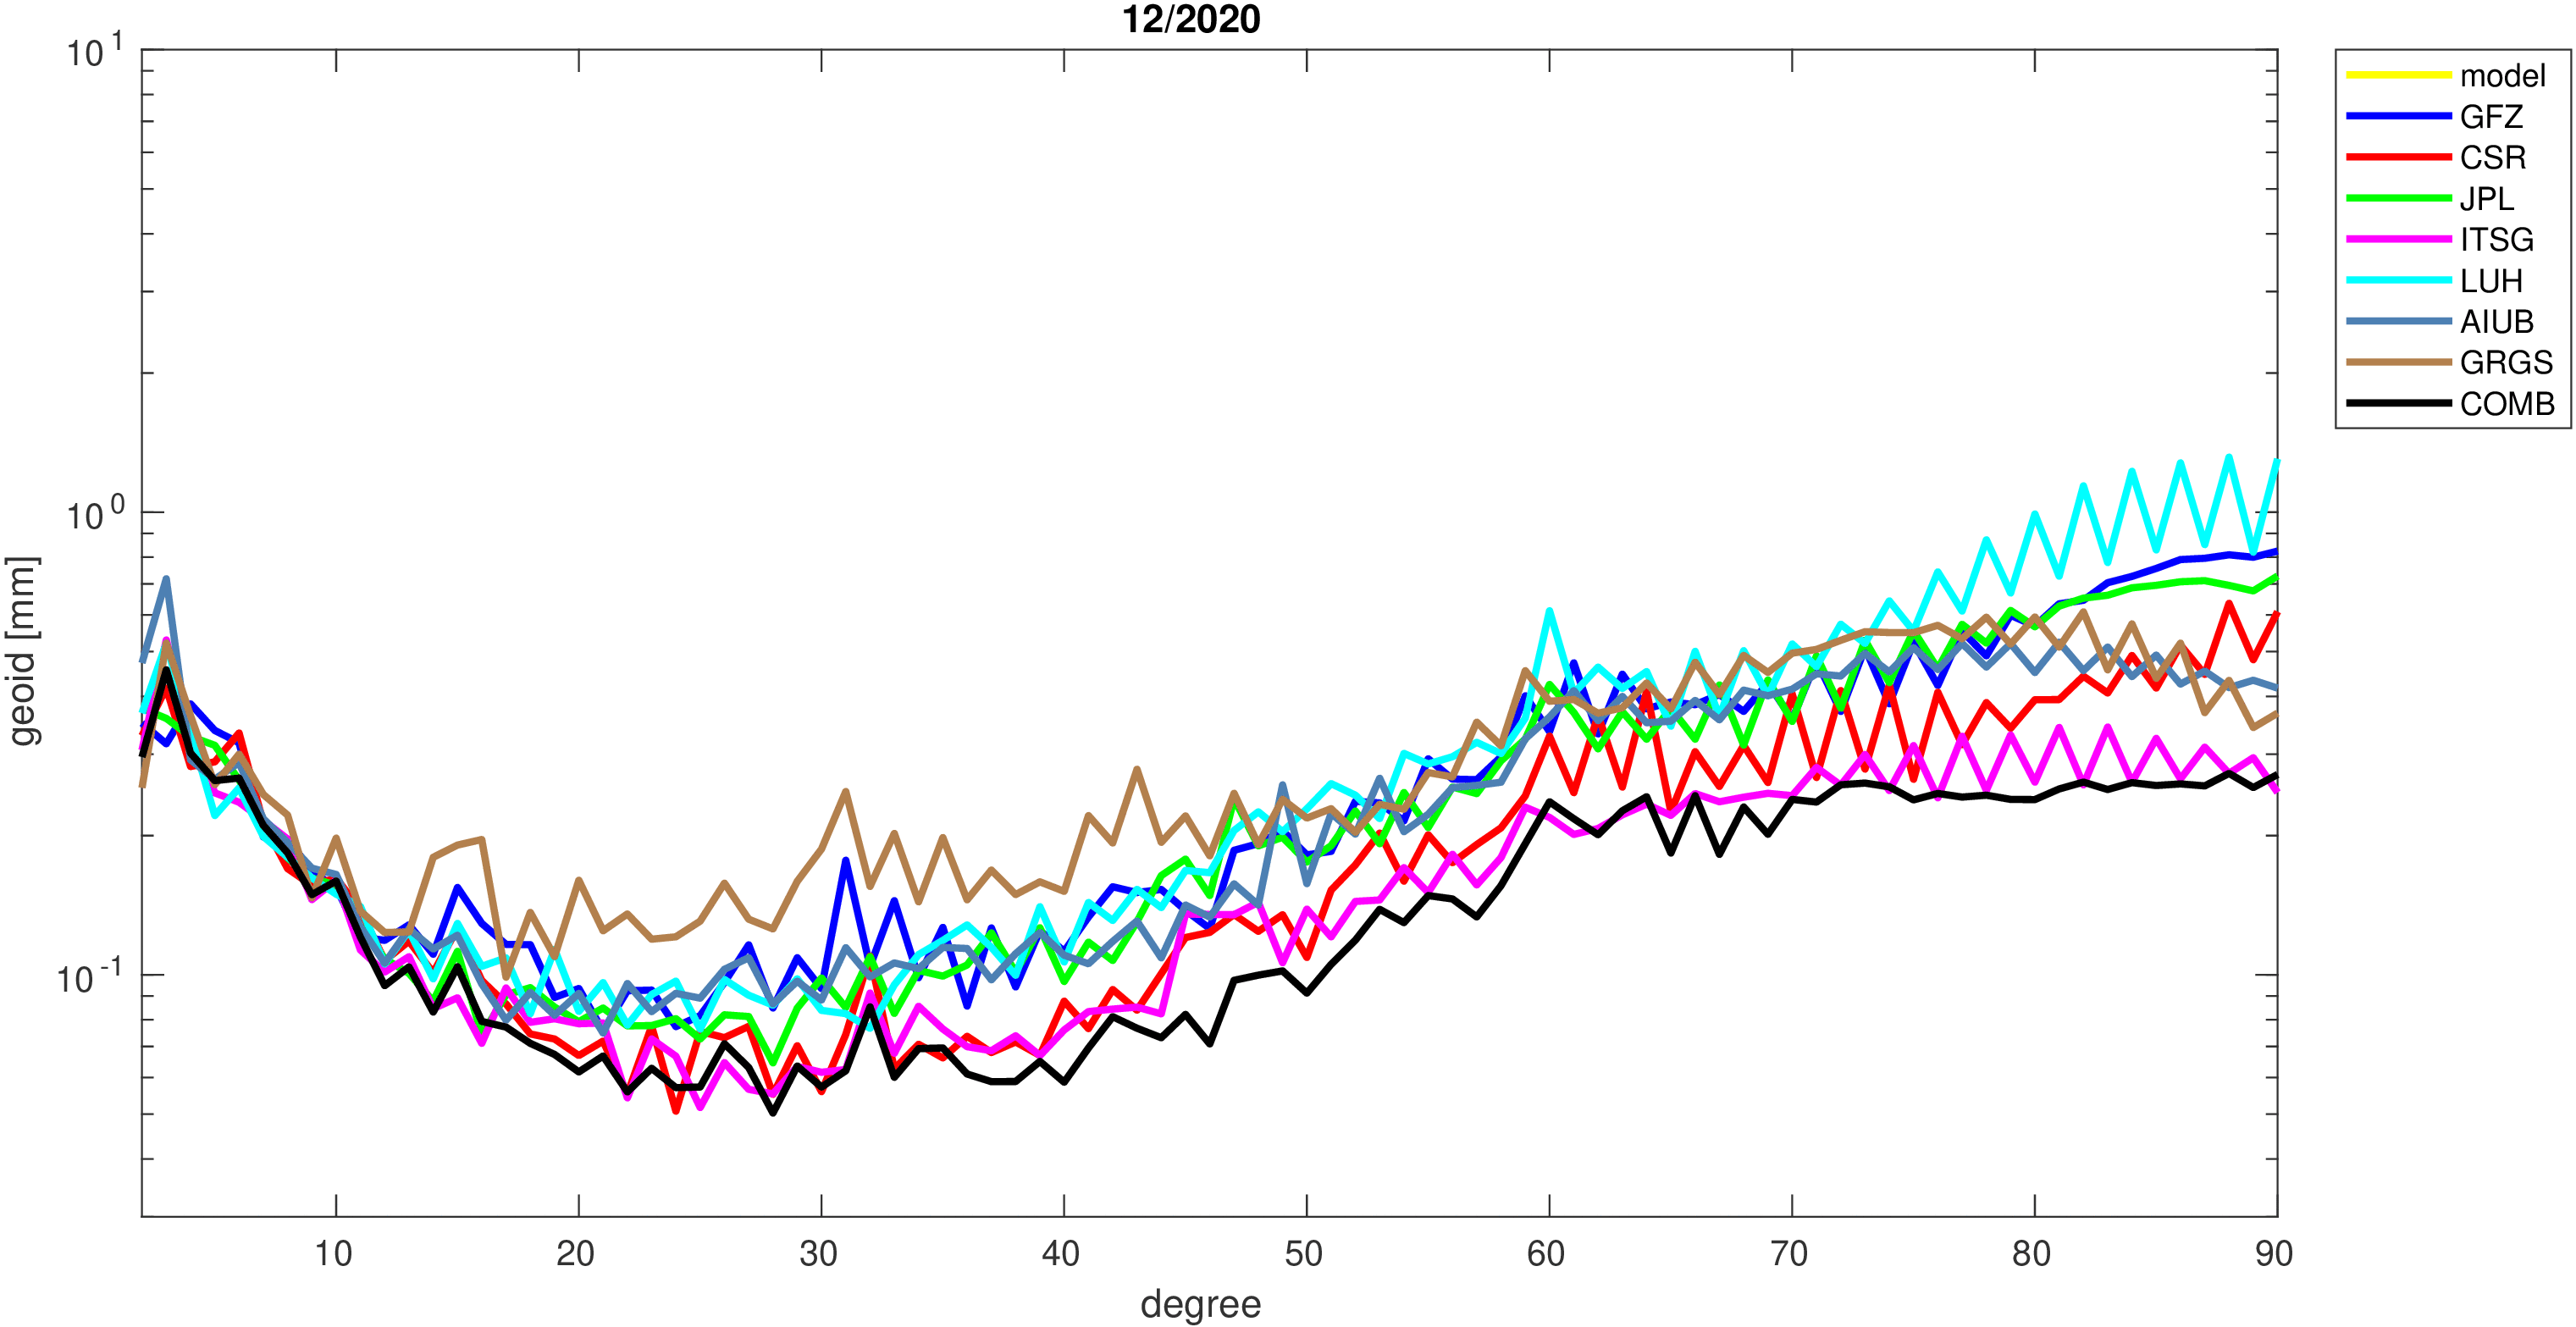
|
|
| 01/2021 |
|
|
| 02/2021 |

|

|
| 03/2021 |
|

|
| 04/2021 |

|

|
| 05/2021 |
|

|
| 06/2021 |

|

|
| 07/2021 |
|
|
| 08/2021 |

|

|
| 09/2021 |

|
|
| 10/2021 |

|

|
| 11/2021 |
|

|
| 12/2021 |
|
|
| 01/2022 |

|

|
| 02/2022 |
|
|
| 03/2022 |

|
|
| 04/2022 |

|
|
| 05/2022 |
|
|
| 06/2022 |

|

|
| 07/2022 |

|
|
| 08/2022 |

|

|
| 09/2022 |

|
|
| 10/2022 |
|

|
| 11/2022 |
|

|
| 12/2022 |

|
|
| 01/2023 |

|
|
| 02/2023 |

|

|
| 03/2023 |
|

|
| 04/2023 |
|

|
| 05/2023 |

|
|
| 06/2023 |

|

|
| 07/2023 |
|

|
| 08/2023 |

|
|
| 09/2023 |
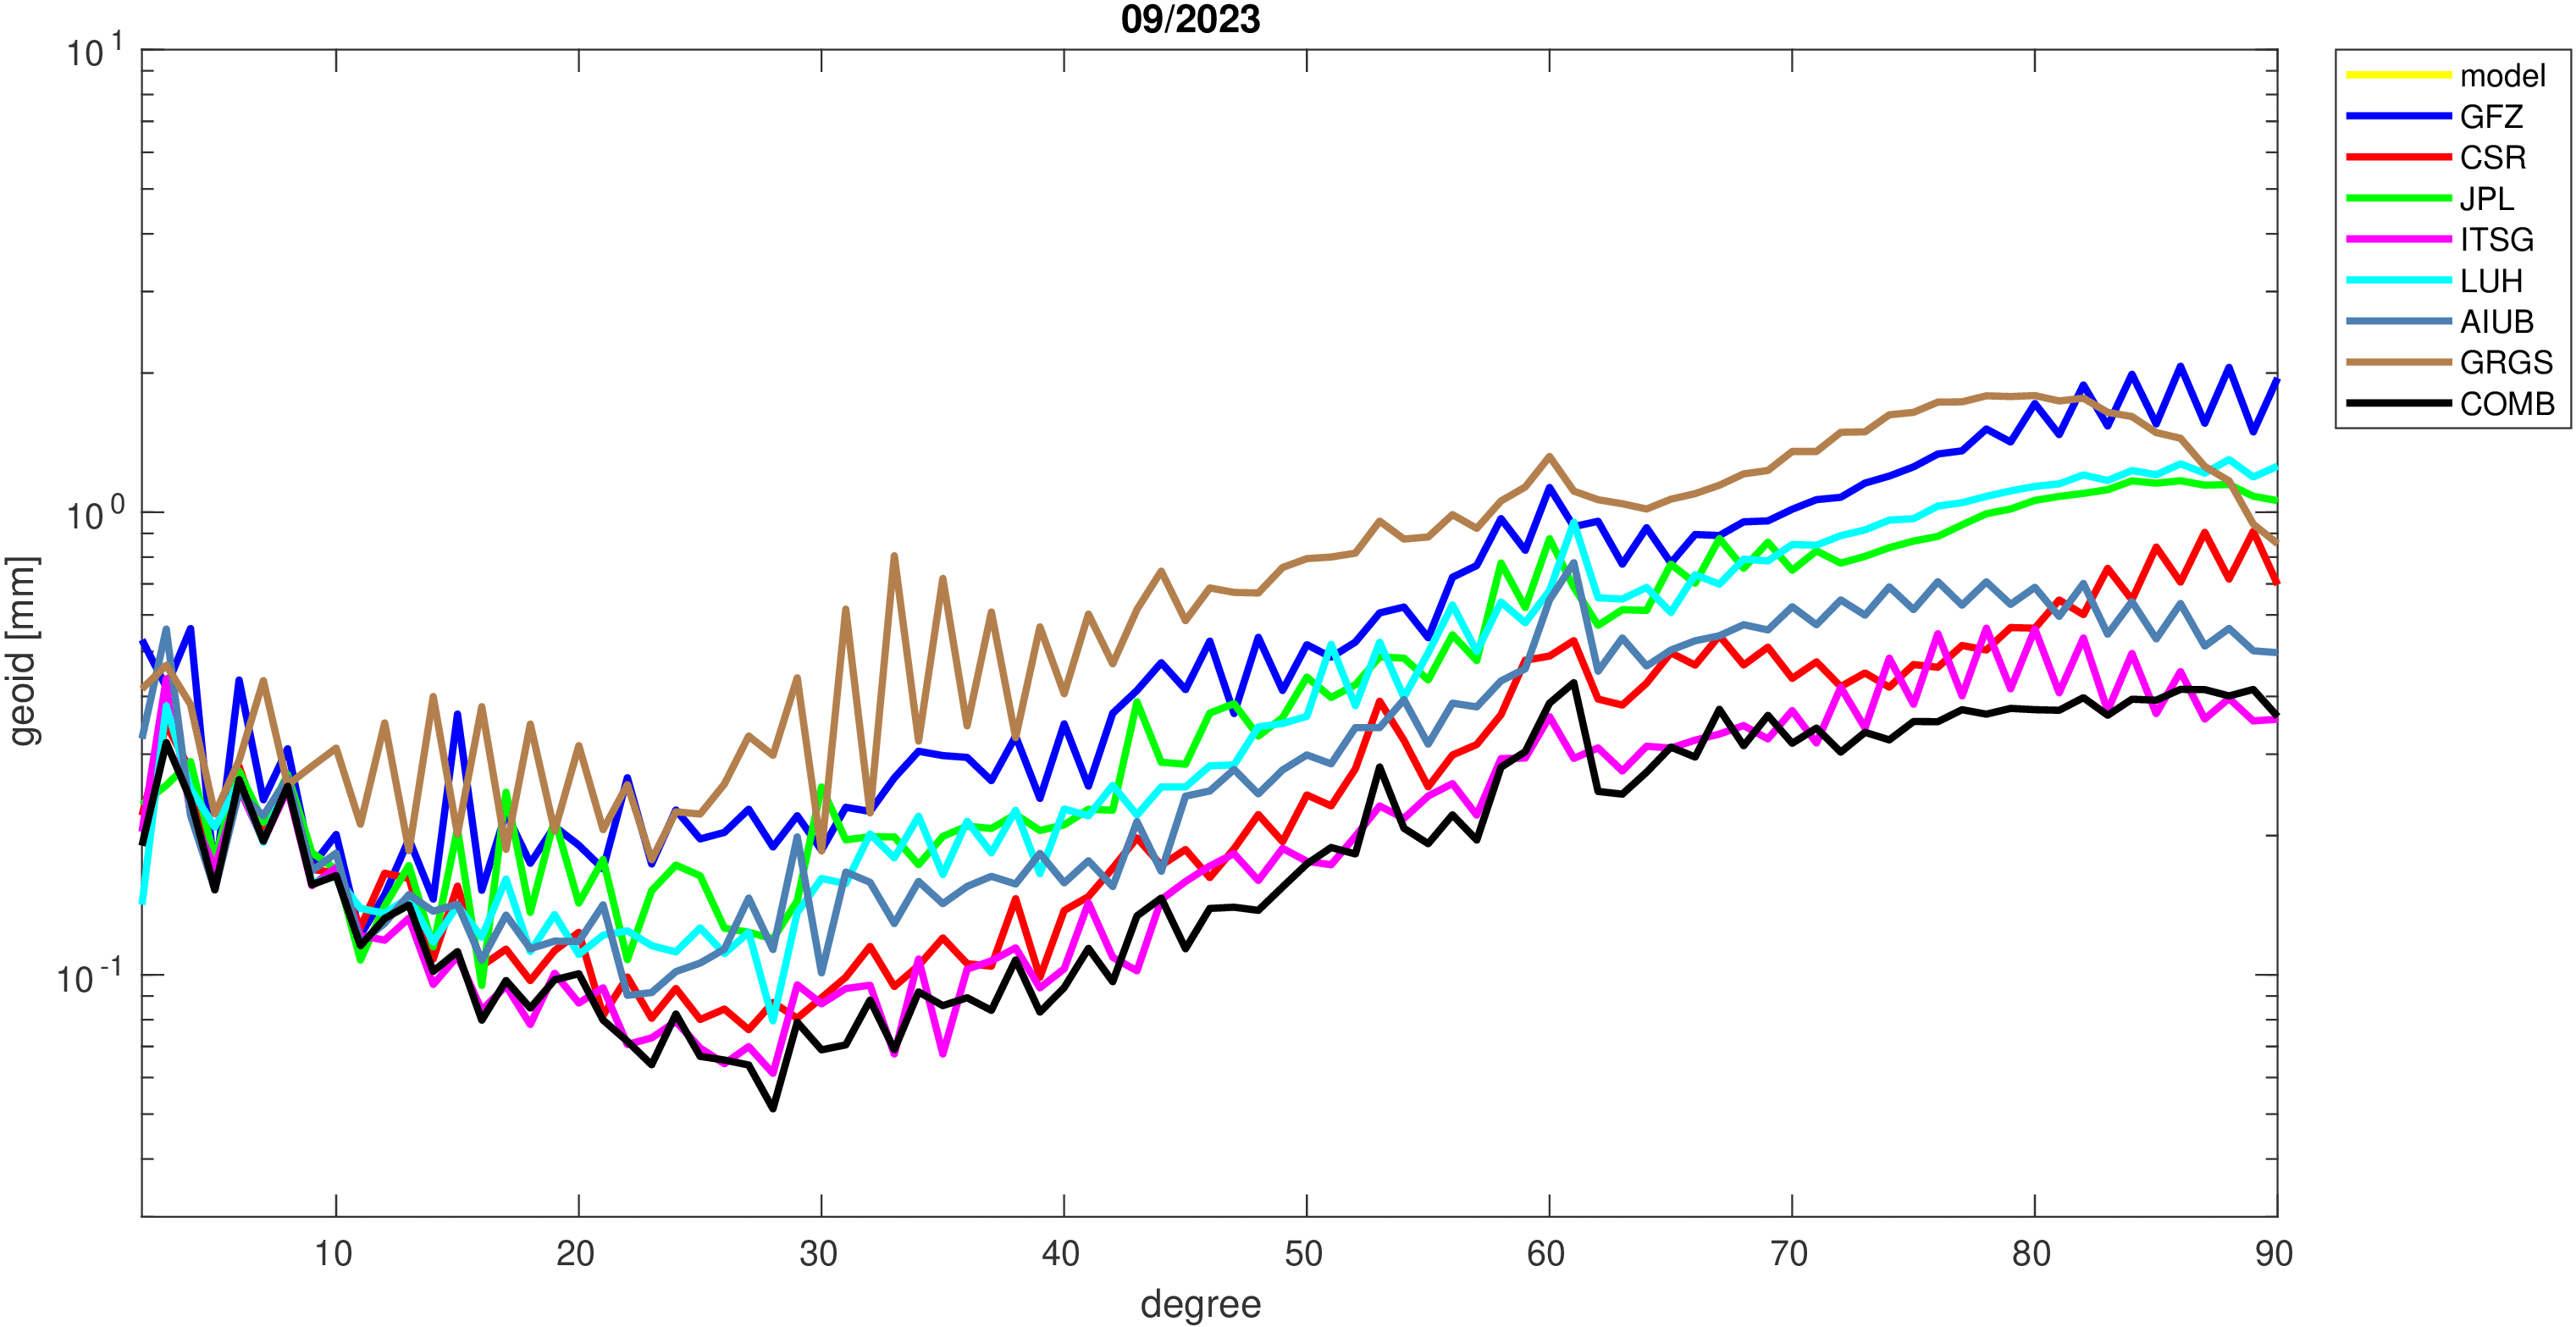
|
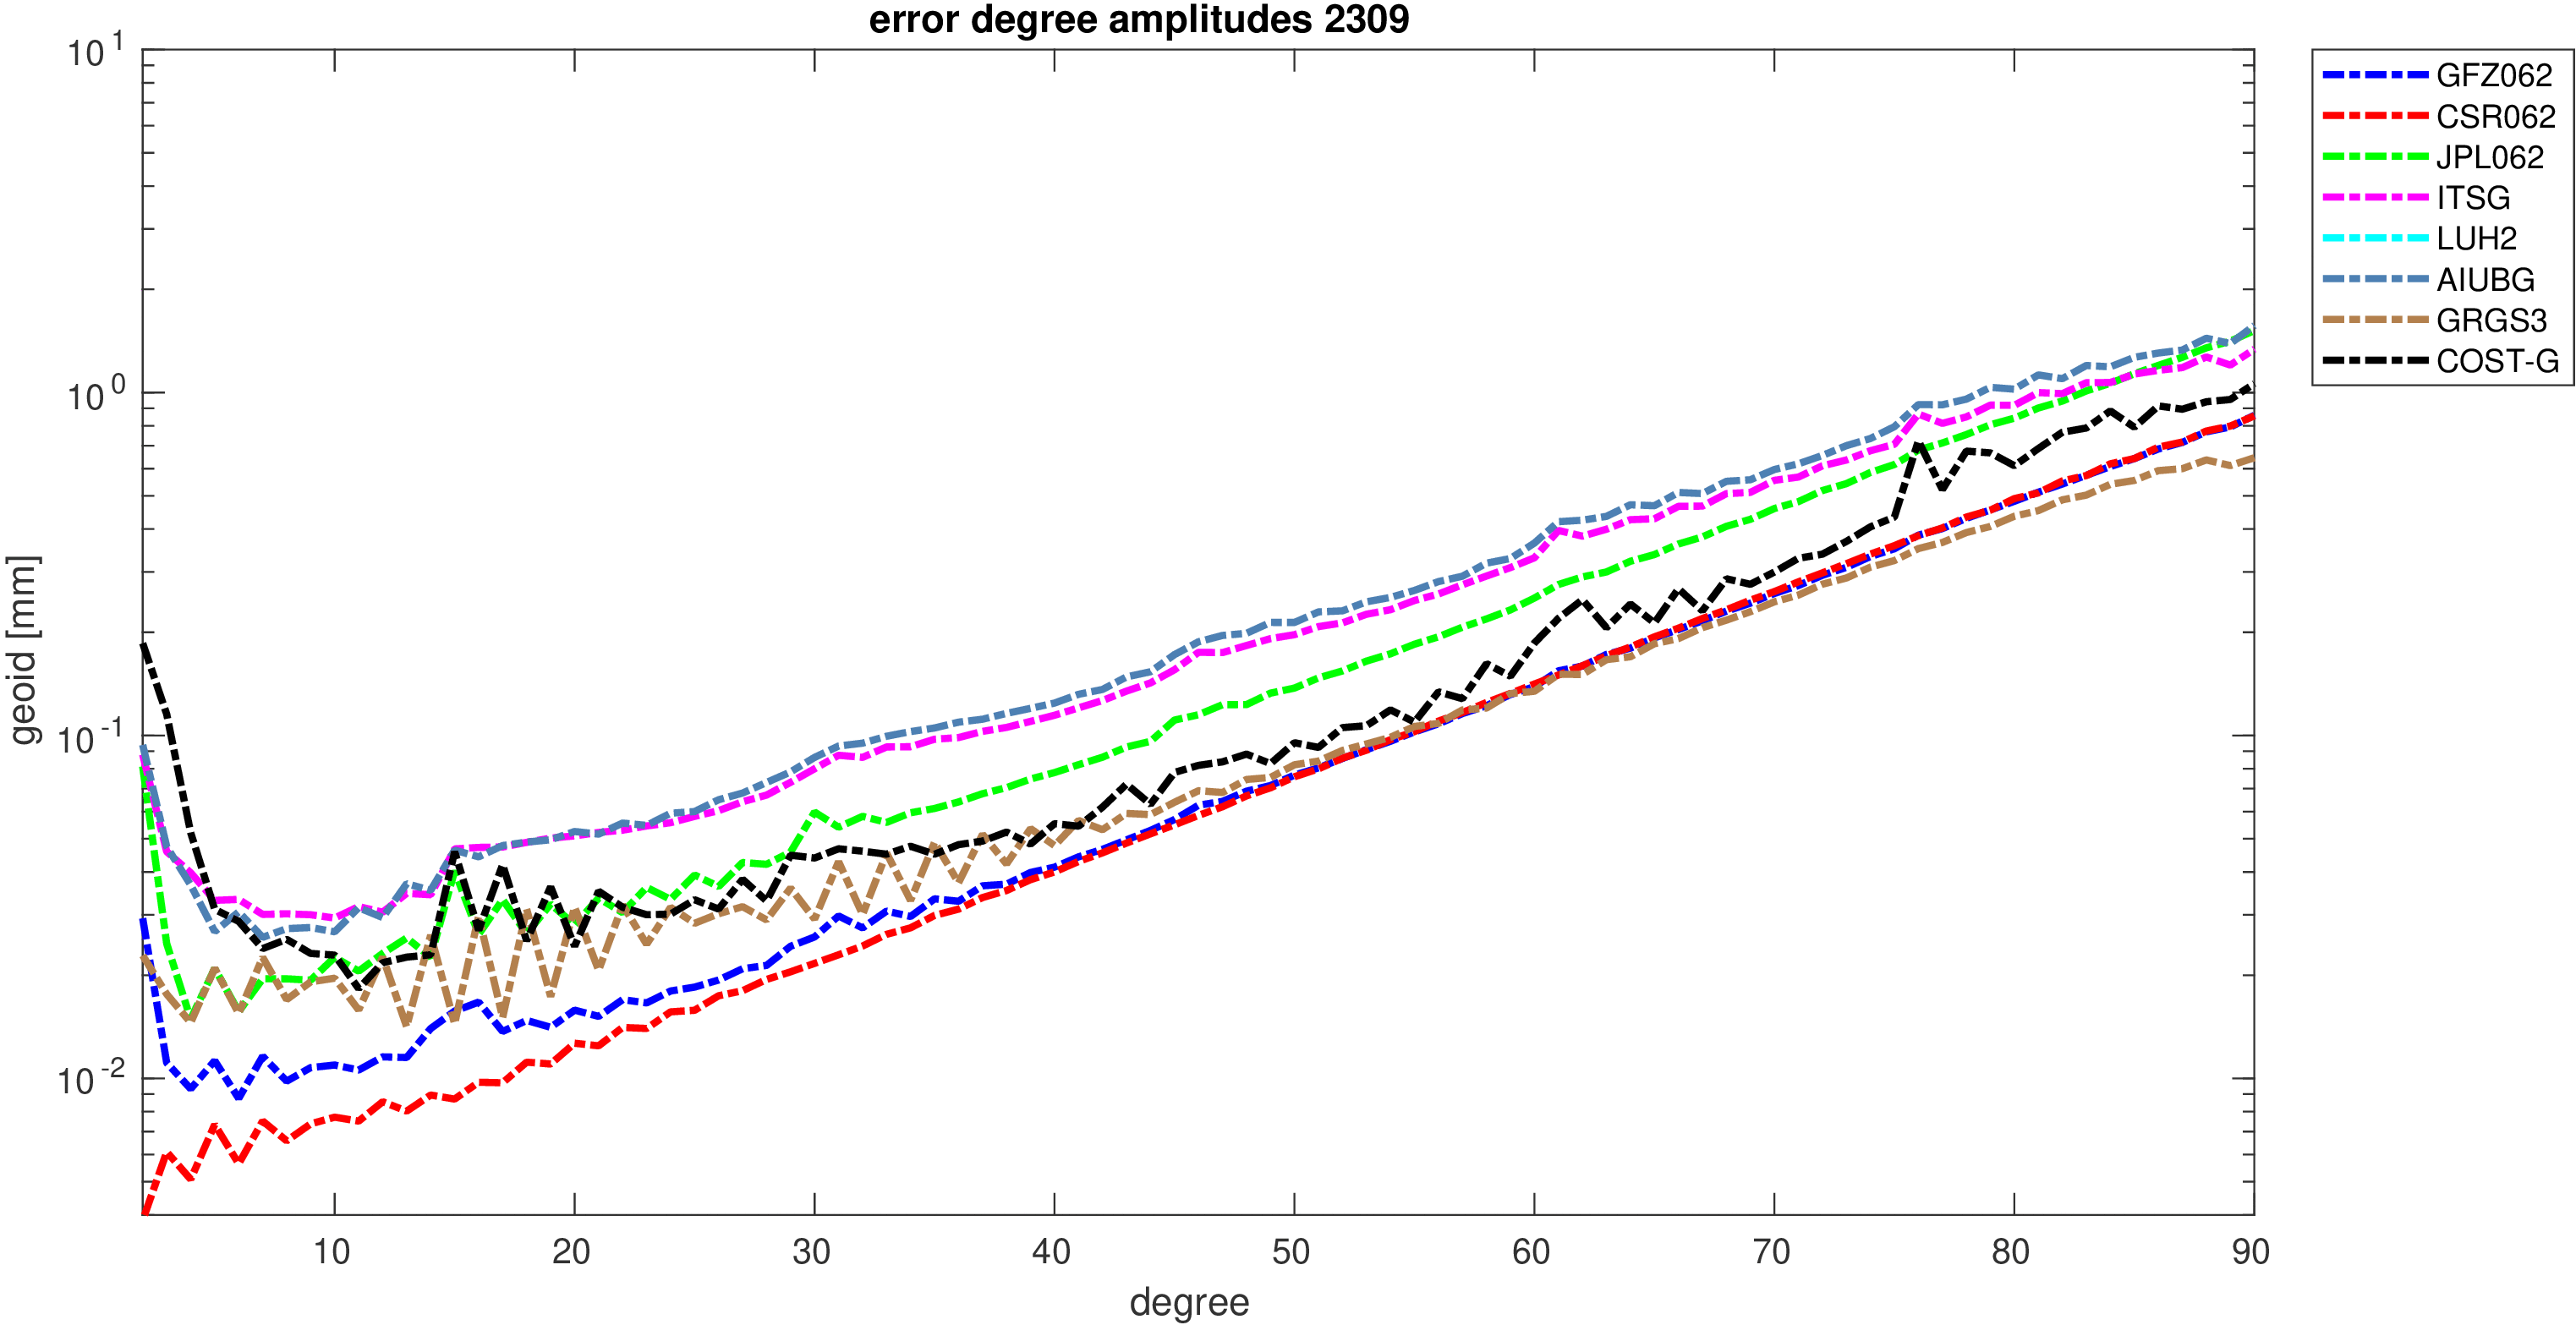
|
| 10/2023 |

|
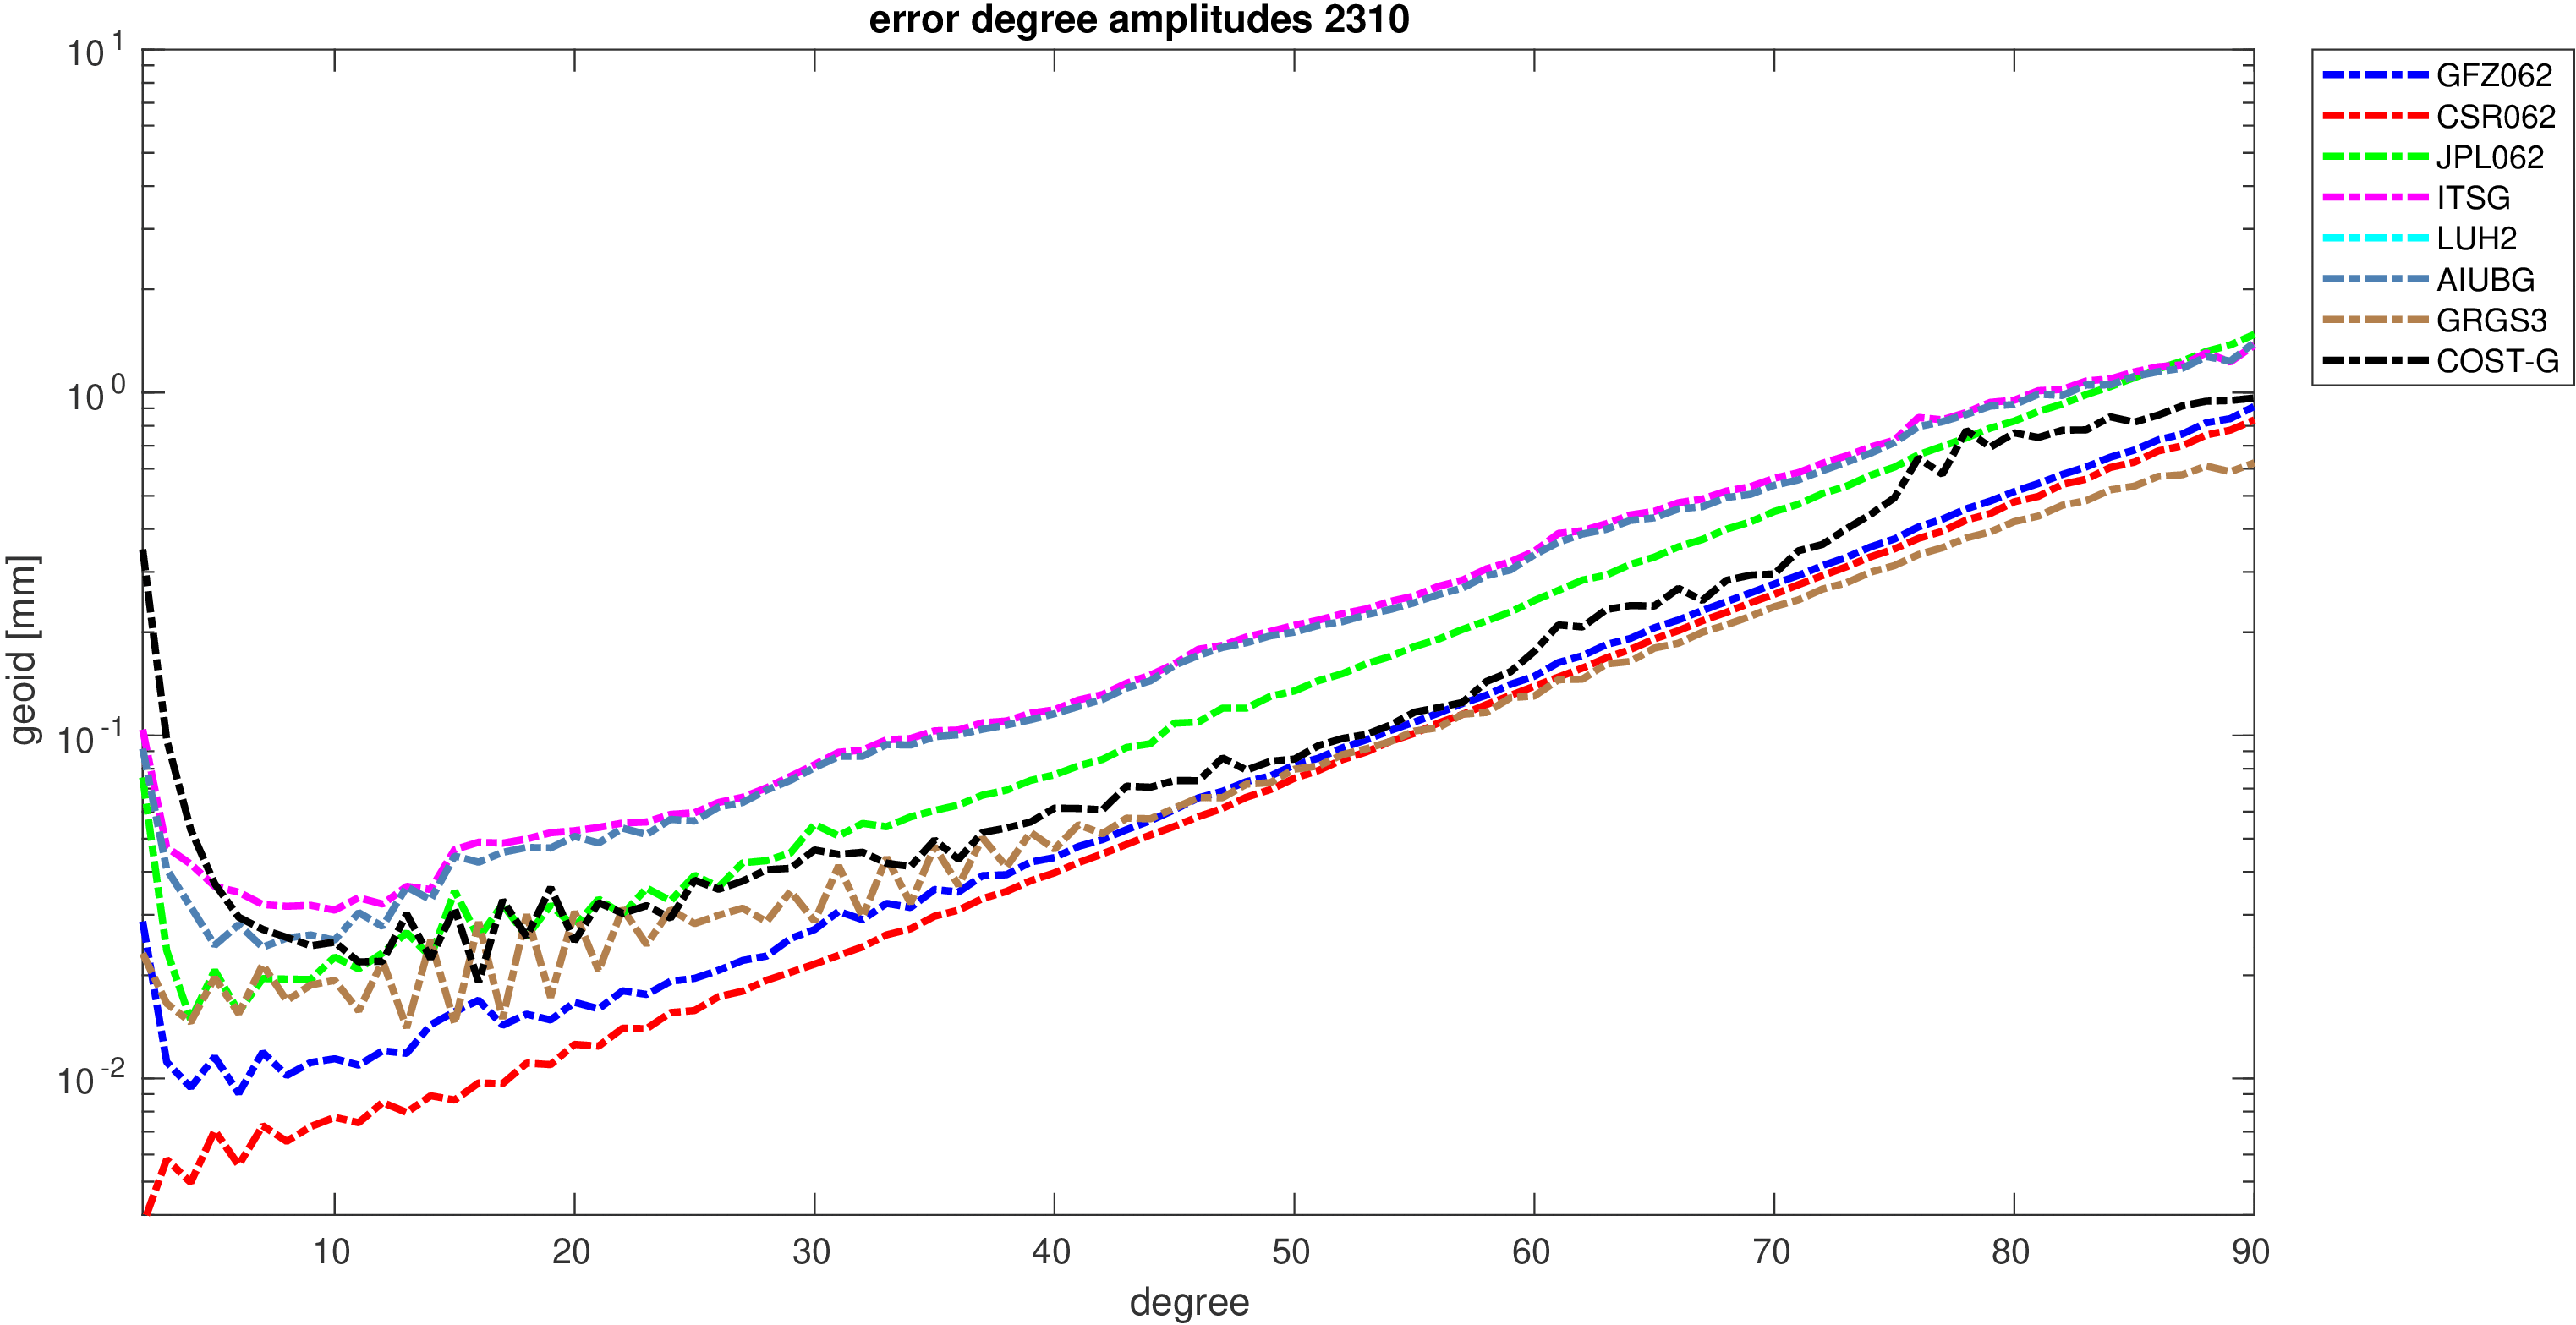
|
| 11/2023 |
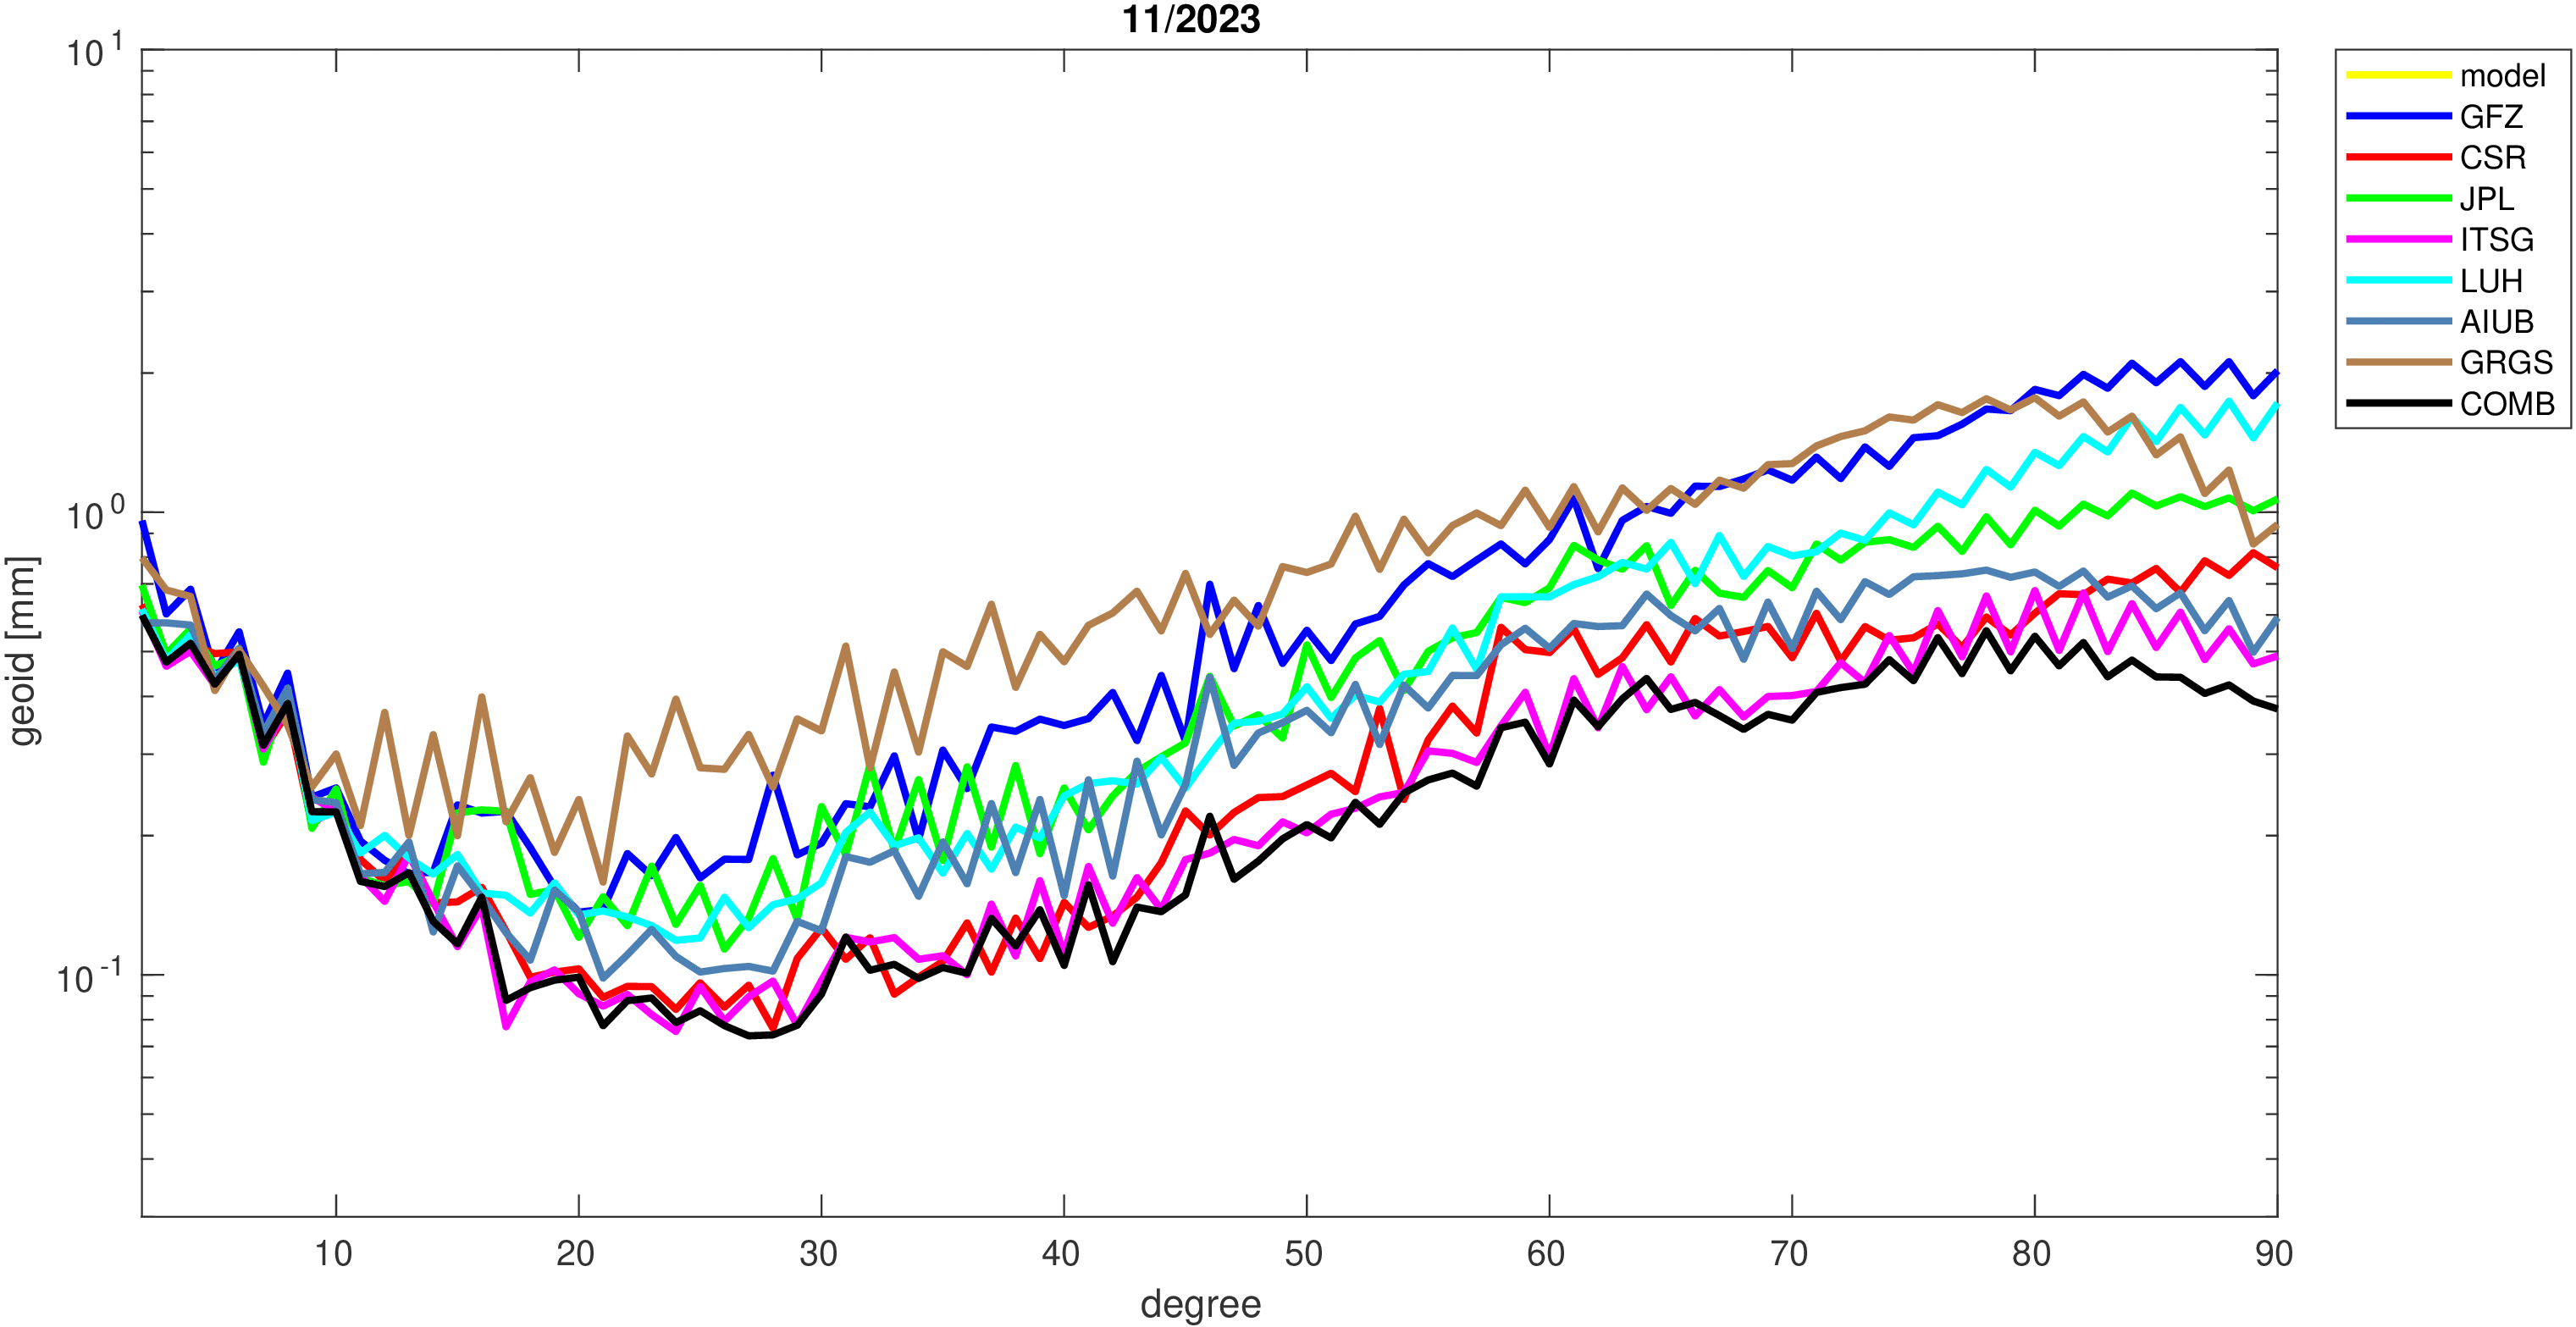
|

|
| 12/2023 |

|
|
| 01/2024 |
|

|
| 02/2024 |

|
|
| 03/2024 |

|
|
| 04/2024 |
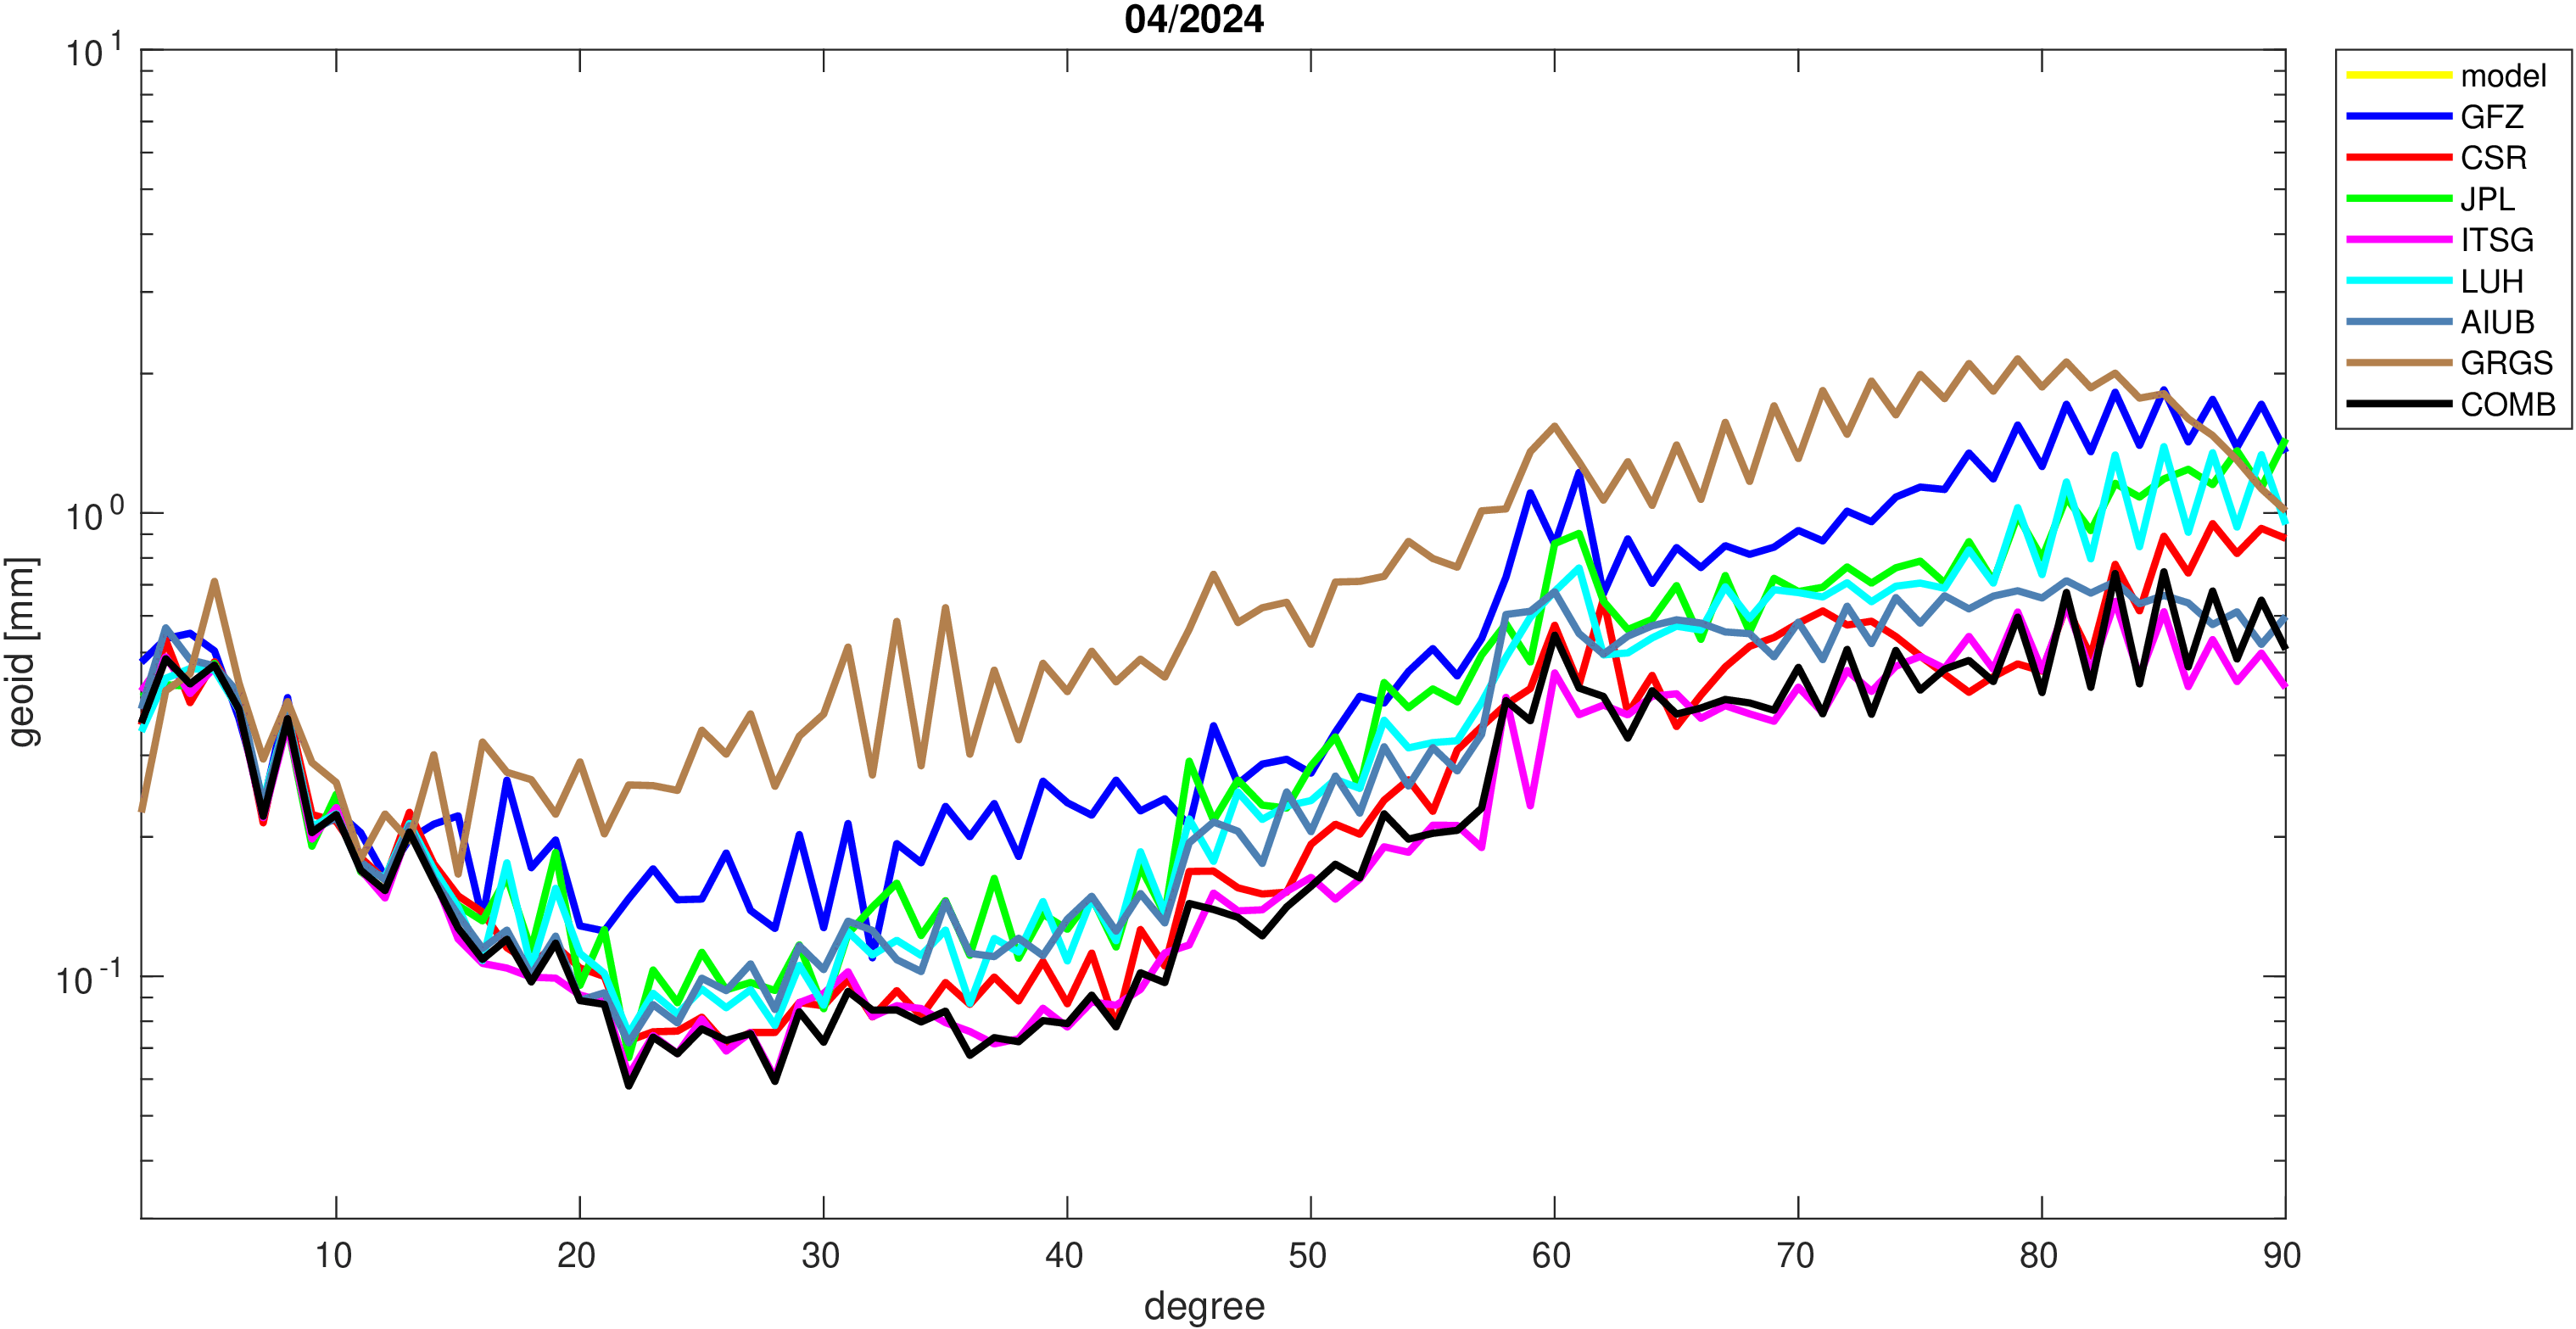
|
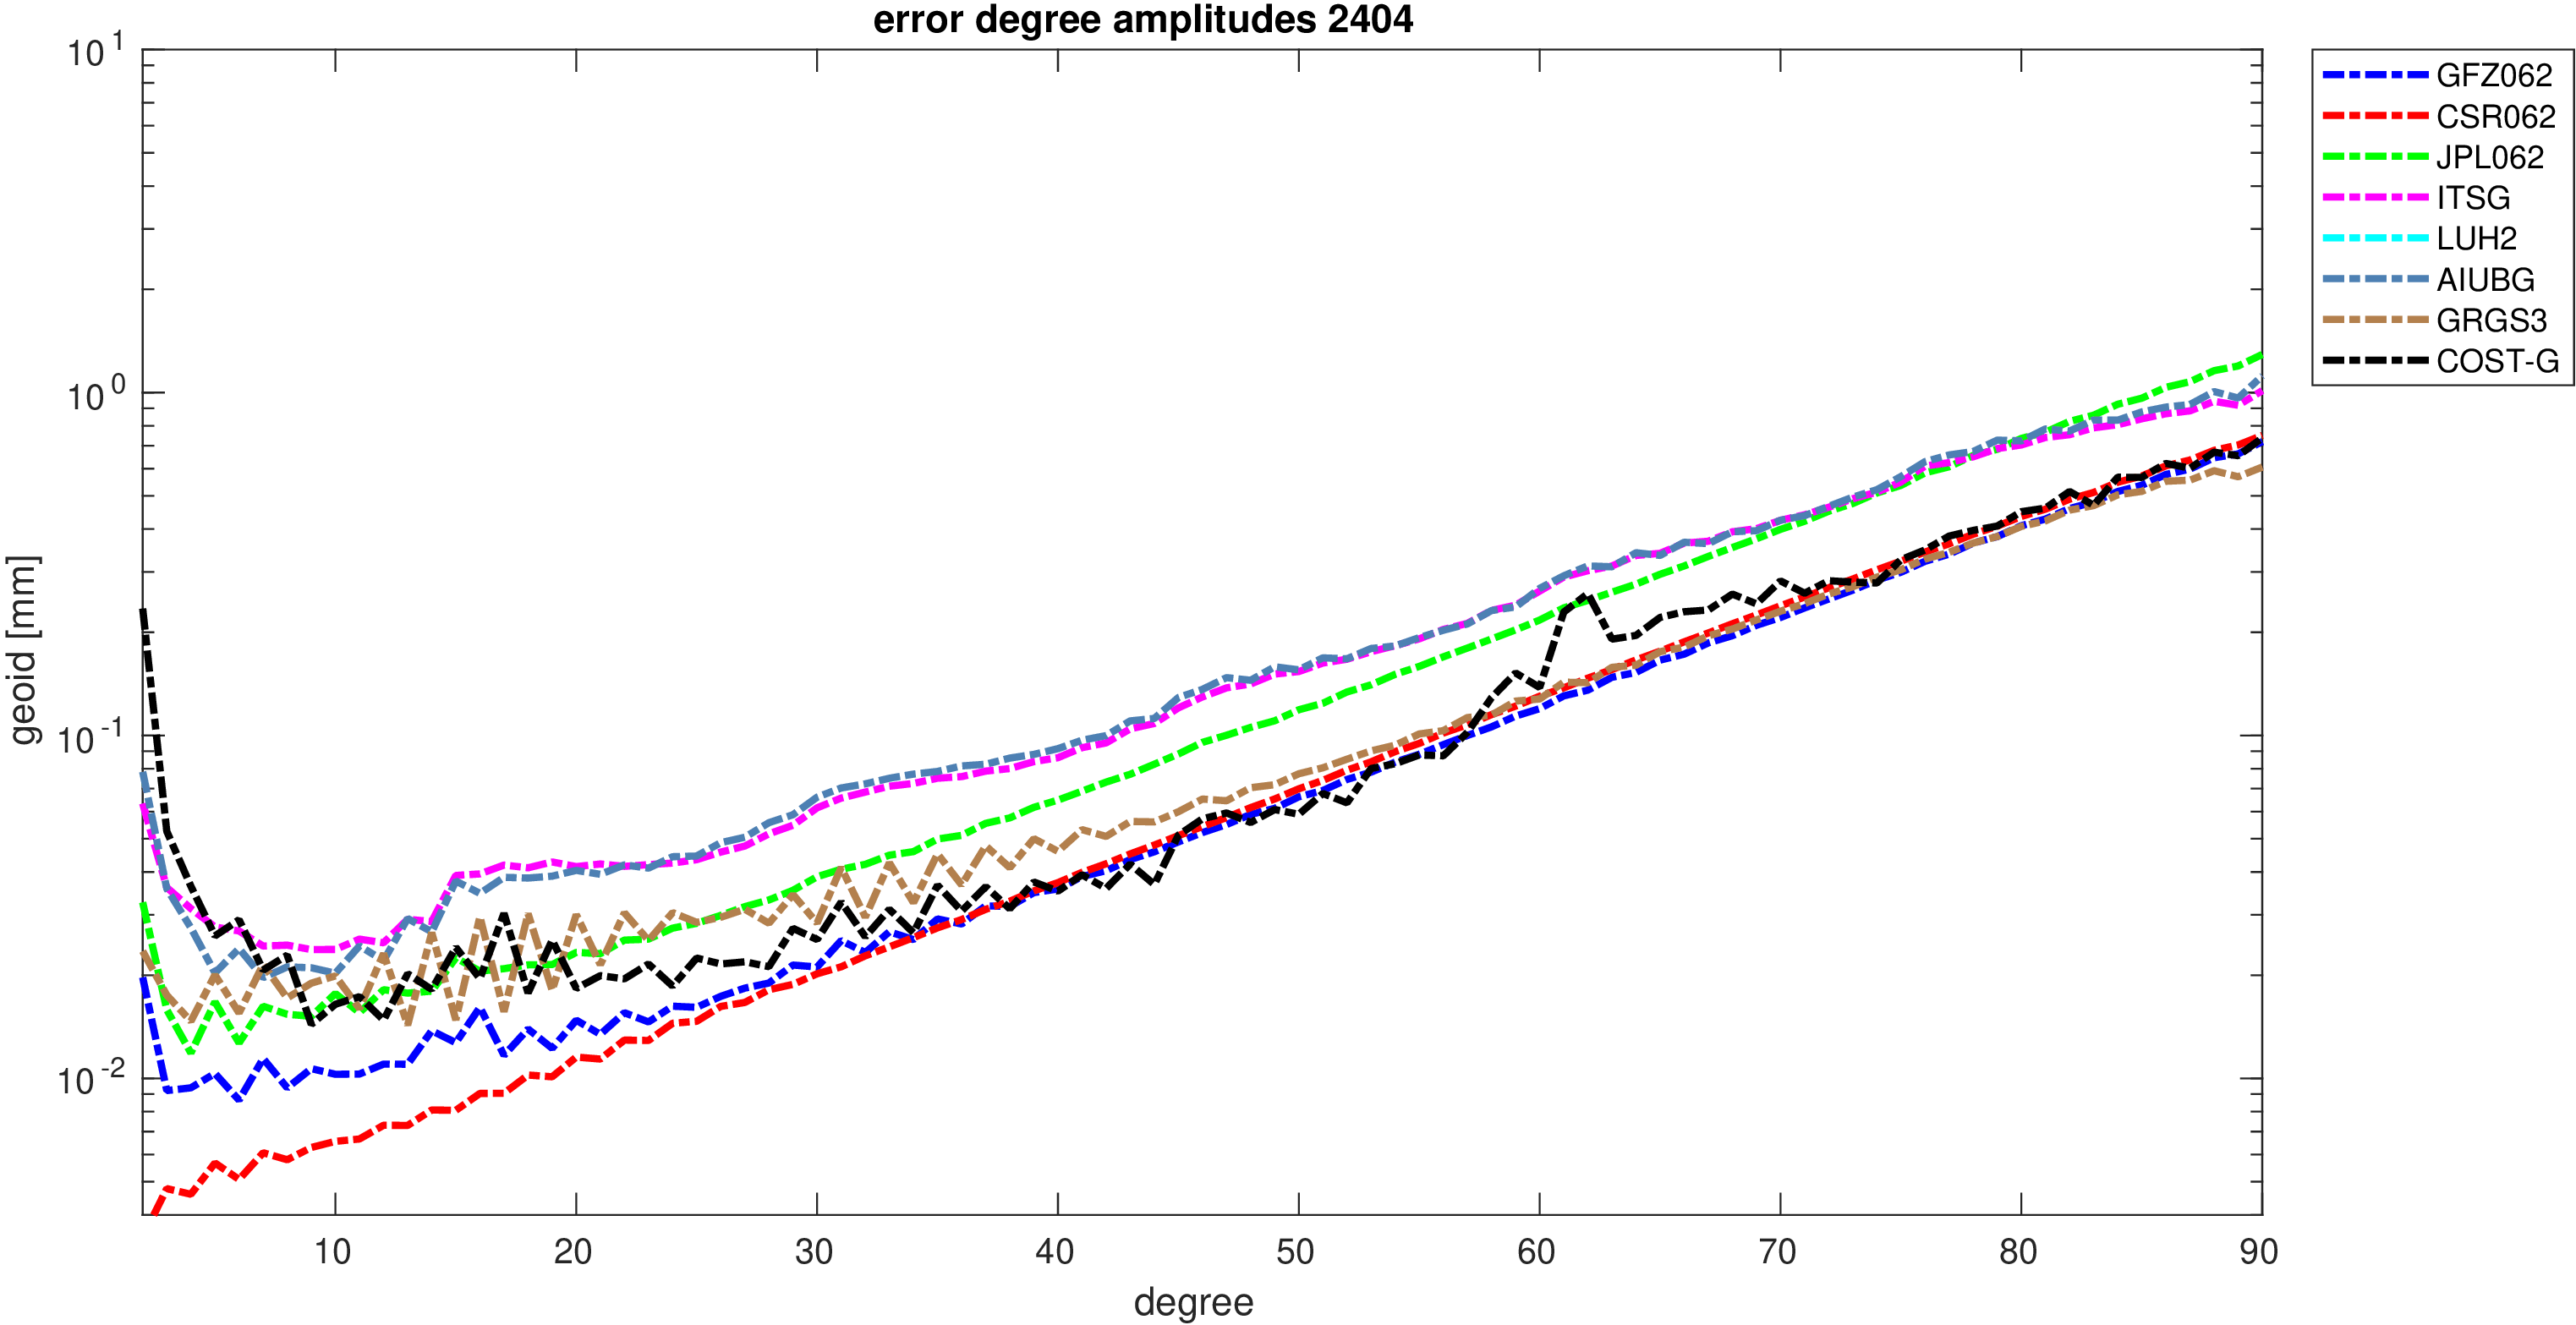
|
| 05/2024 |
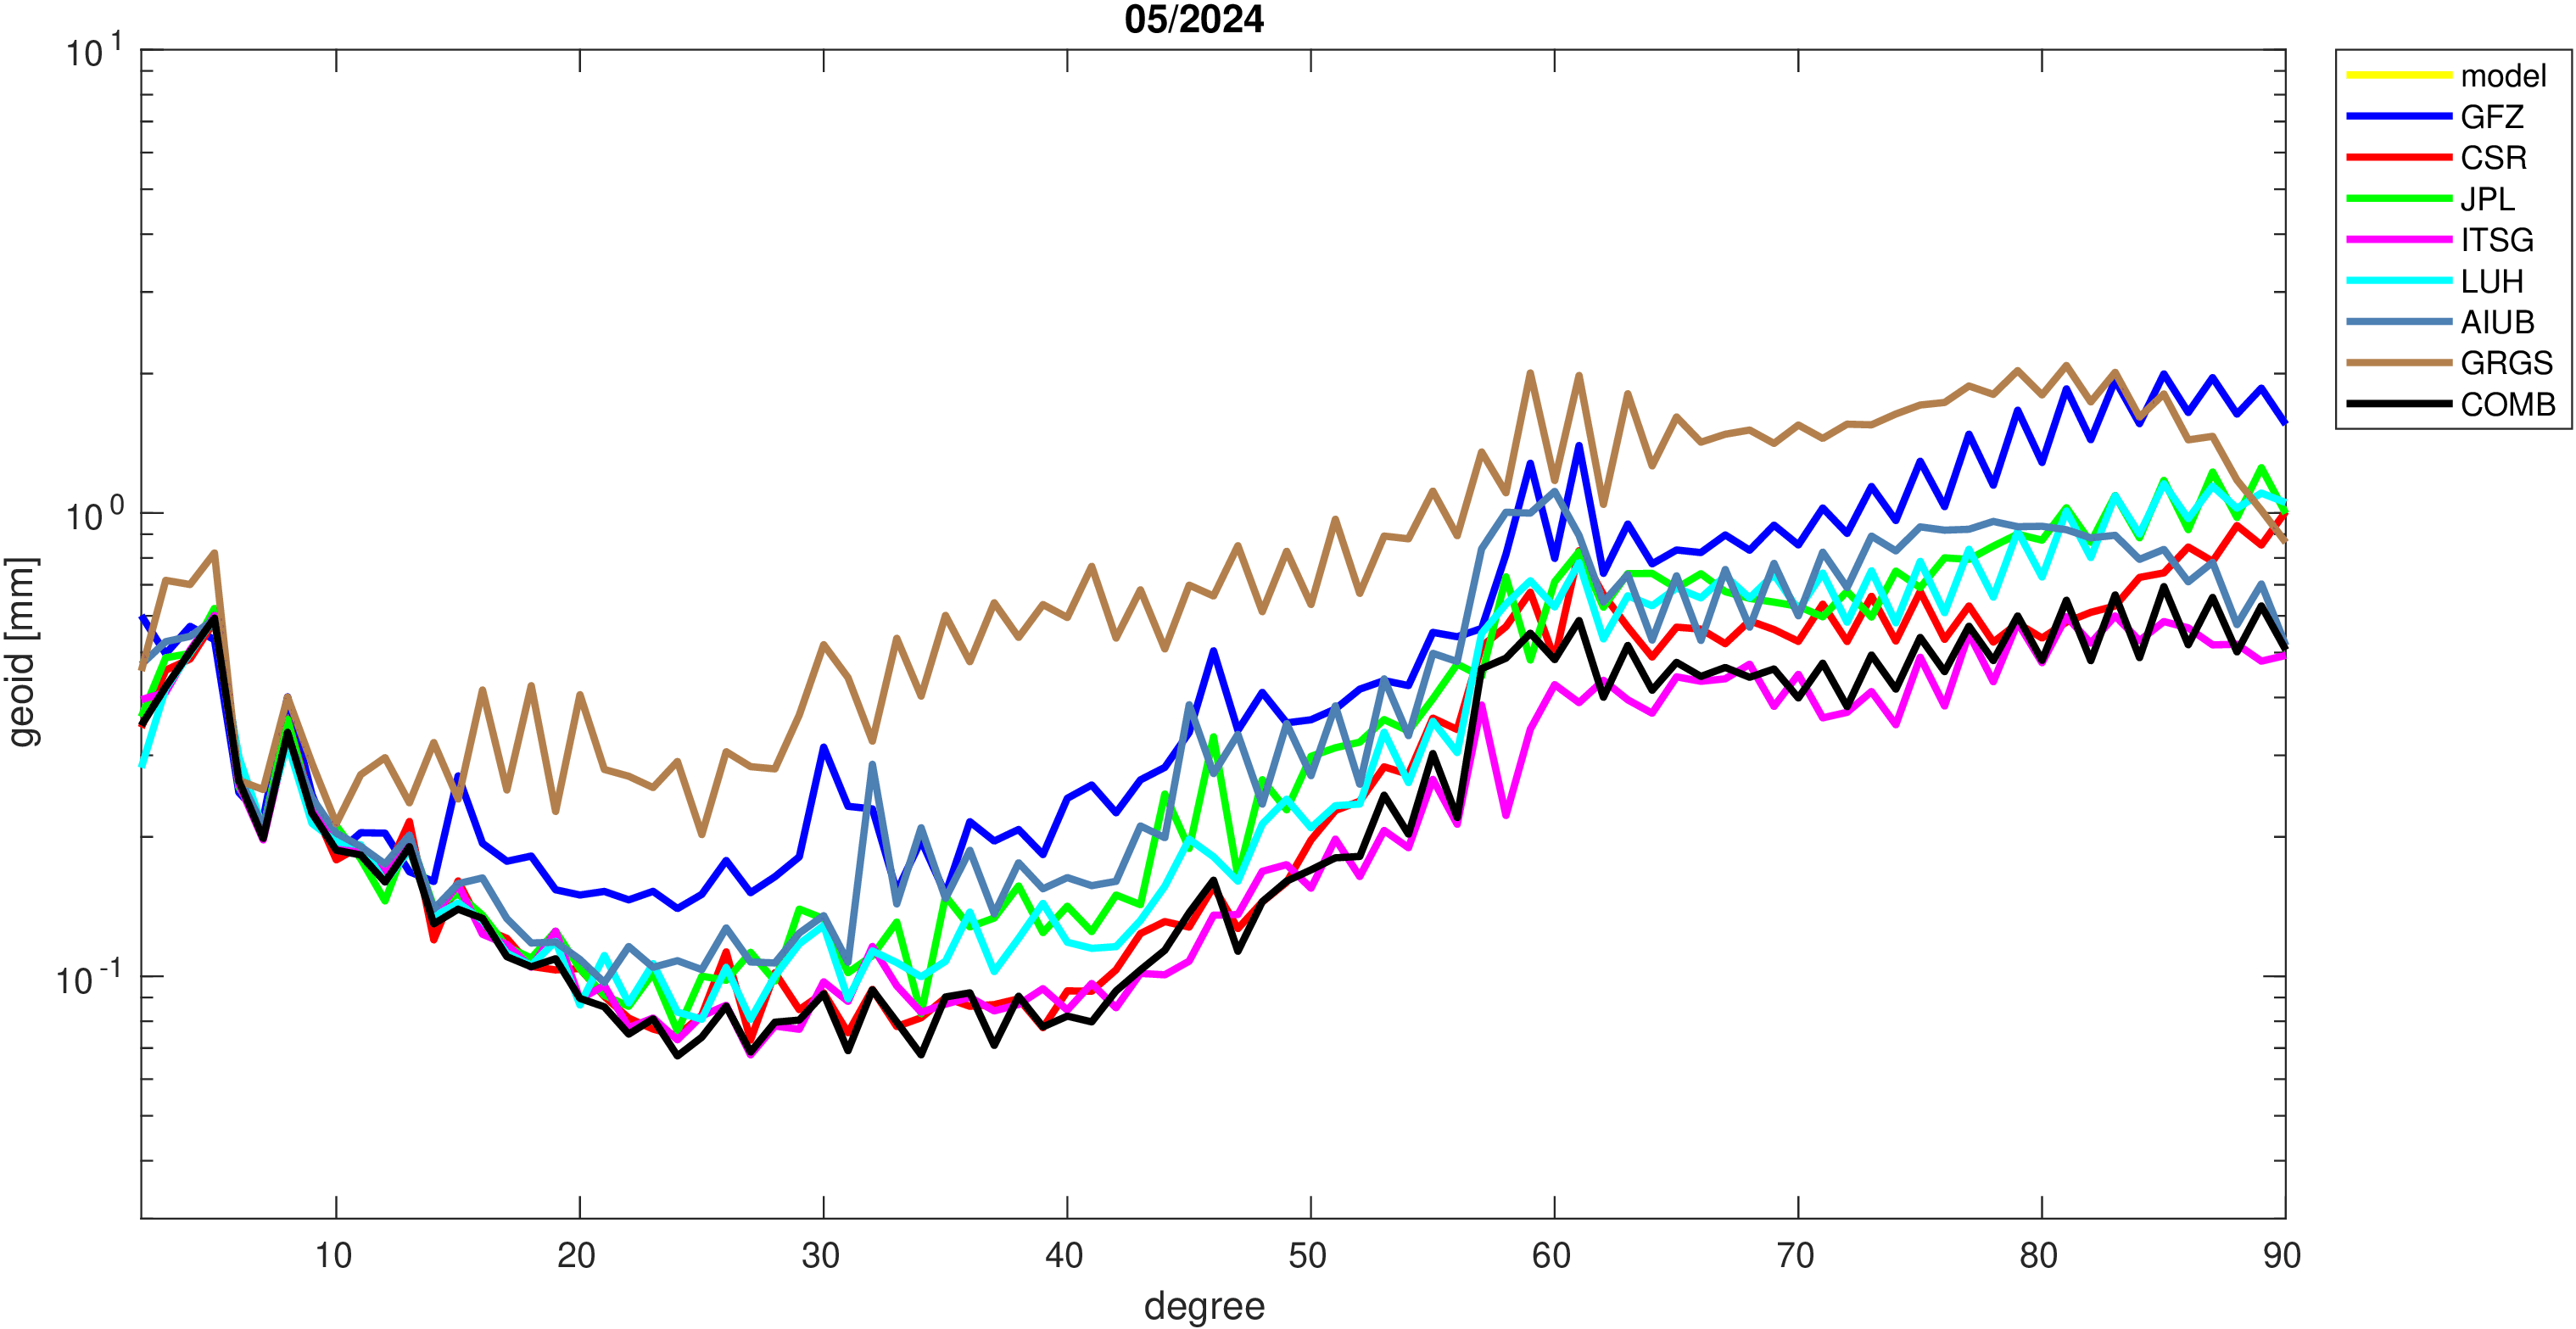
|
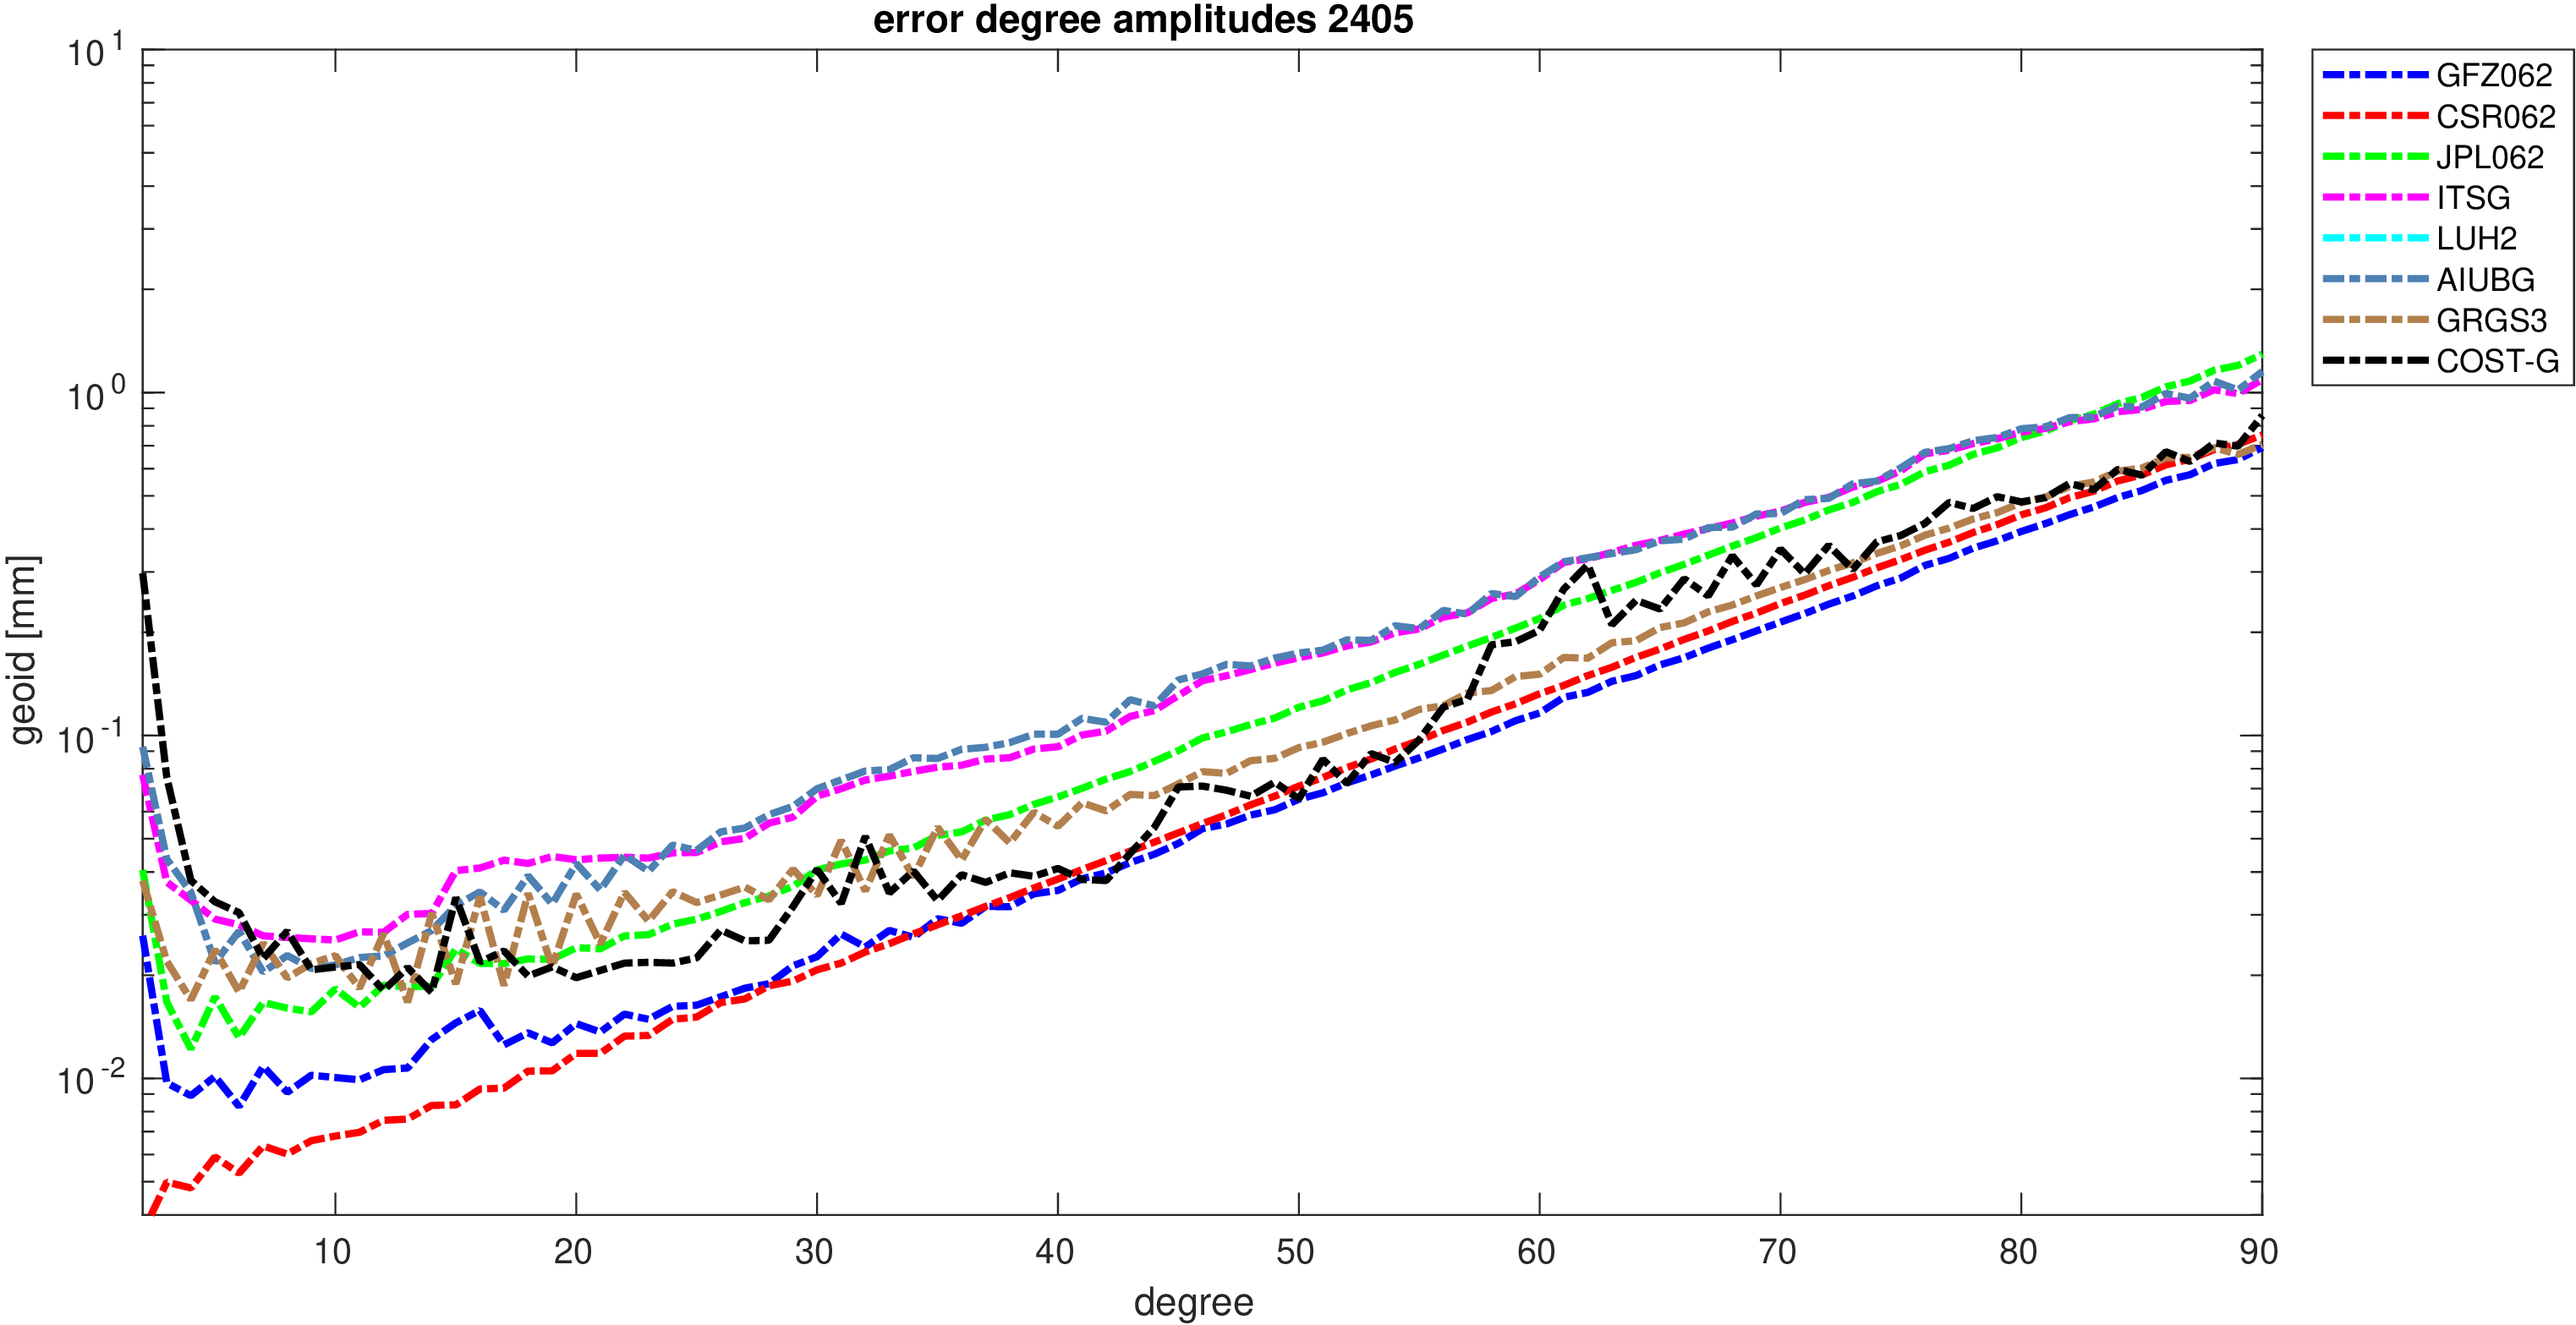
|
| 06/2024 |
|
|
| 07/2024 |

|

|
| 08/2024 |

|

|